1
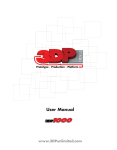
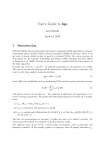
CalIPEr
ThE
ThE CalIPEr IS a PublICaTIon for uSErS of VErnIEr ProduCTS
MEASURE. ANALYZE. LEARN.
SPrIng 2012 | Vol 29 no.1
introducing labQuest 2
®
in this issue
2
new Equipment
to support
advanced
physics lab
Book
3
polarizer/
analyzer Kit
Experiments
5
identifying
sugars in
Everyday
Beverages
INVEST IGATIN G
BiologyInquiry
The Most Powerful, Connected, and Versatile Interface Ever
through
6
new
Investigating
Biology
through Inquiry
lab Book
AND GUIDED INQUIRY APPROACHES
EXPERIMENTS USING OPEN
since the announcement of labQuest
abQuest 2 in early March, we have heard from teachers all over
the world about the cool new features of labQuest
abQuest 2 and the Connected science system.
“ The LabQuest 2 is a completely different form factor and appears to have embraced many
of the features, operations, and shape we are used to with our other handheld devices.
10
software
Updates
and new
labQuest
Viewer™
By
Johnathan M. Melville
Donald L. Volz
Michael Collins
MEASURE. ANALYZE. LEARN.
It also appears that the fine folks at Vernier have not forgotten about the rest of our
devices in that the LabQuest 2 can work with them as well through several connectivity
options further changing the game. In fact, I’d go so far as to suggest that that very
feature, called the Connected Science System, is an excellent example of a ‘disruptive
technology’ and will surely become an industry standard option for all other similar
devices in the future.”
Martin Horejsi, NSTA blog
11
15
graphical
analysis for
ipad®
professional
Development
Read the full blog post at www.vernier.com/r121
Joel Matykowski, a physics teacher at Century High school in Hillsboro, Oregon, beta-tested
labQuest 2 with his students. Conducting a speed-of-sound experiment, the students were
able to view and analyze data using ipads. according to Matykowski, “My students loved
the way they could quickly collect and analyze data both in a group and on an individual
basis using labQuest 2 and ipads.”
More information about labQuest 2 can be found on pp. 8–9.
www.vernier.com/labquest2
THE CalipEr | spring 2012
1
VErniEr sOfTwarE & TECHnOlOgy
www.vernier.com
pHysiCs
new Equipment to Support
Advanced Physics with Vernier –
Beyond Mechanics lab book
includes selectable entrance apertures, so that the sensor can
sample small portions of the diffraction pattern for enhanced
spatial resolution. The position sensor is based on a linear optical
encoder. with zero backlash, the system can measure the light
sensor position to better than 50 µm resolution.
The new Advanced Physics with Vernier – Beyond Mechanics book is
a follow-up volume to the first Advanced Physics with Vernier –
Mechanics book, which focused mainly on mechanics and dynamics.
an optional green laser is also available (gDl-DaK), which can be
used to study the effect of wavelength on patterns.
Both books share a philosophy based on interactive engagement
with the instructor and other students. The activities are written
under the plan that the instructor will engage students in discussion
at critical junctures in planning, data collection, or analysis. in
addition, the activities assume that students have learned how to
perform common tasks such as linearizing a graph, and do not need
detailed instruction in how to do so.
To give you a sense of what this system can do, we looked at two
different double-slit patterns, both taken with a red laser. The slit
width is the same in these two runs, so that the overall envelope
of the intensity pattern is unchanged. what’s different is the slit
separation. in the lower graph, the slit separation is half that
of the upper graph, so that the fine pattern has half the spatial
frequency. in both cases, the vertical scale is set so that the smaller
features in the pattern can be examined.
some experiments in the books required that we introduce new
equipment. an experiment about resistivity of materials makes use
of our resistivity rod set (rrs), consisting of a variety of metal
rods of various metals and cross sections. Basic optics begins with
mirrors, so we now have a kit of concave and convex mirrors in our
Mirror set (M-OEK).
The most ambitious piece is our new Diffraction apparatus
(DaK). Consisting of a red laser, a collection of high-precision,
metal-on-glass slits, and a novel new combination linear position
and high-sensitivity light sensor, the apparatus lets your students
measure not only diffraction and interference fringe spacing, but
also model the quantitative intensity variation of the patterns.
The Diffraction apparatus parts snap to the same track as used in
the Optics Expansion Kit and as found in the Vernier Dynamics
system. a variety of slits allow students to see how patterns
depend on slit width, number, and spacing. since the intensity of
a diffraction pattern is much lower than other light sources, there
is a new high-sensitivity light sensor. in addition, the light sensor
normally a fussy experiment to set up, this apparatus lets your
students do classic light-as-a-wave experiments quickly and easily.
resistivity rod Set, rrs, $45
Mirror Set, M-oEK, $59
diffraction apparatus, DaK, $549
green diffraction laser, gDl-DaK, $250
Advanced Physics with Vernier – Beyond
Mechanics lab book, pHys-aBM, $48
how do You fill Your Class Time?
By John gastineau, ph.D.
My new year’s holiday thoughts were quickly brought back to
work and teaching, as on the radio i began to hear familiar names
and voices talking about how physics is taught. Joe redish, David
Hestenes, and others spoke about how lectures are often not as
effective as we think—even if they are really good lectures. a
report on npr’s All Things Considered gave a good summary of
how the interactive teaching methods refined over the last two
decades of physics Education research have spread to more
institutions and into other disciplines. www.vernier.com/r122
The report was based on a longer American Radioworks series
“Don’t lecture Me.” Check it out if you want to give your
classroom game a fresh look. www.vernier.com/r123
Even engineering classes are losing the lecture structure, as reported
in the Washington Post recently. www.vernier.com/r124
what i found interesting about these reports as a whole was that
they are treated as national news. The education culture seems to
be changing, so that students (and parents) may soon be surprised
if class time is taken with traditional lectures.
2
THE CalipEr | spring 2012
VErniEr sOfTwarE & TECHnOlOgy
www.vernier.com
pHysiCs
Polarizer/analyzer Kit Experiments
we thought we’d share some experiments you can do with the new
Vernier polarizer/analyzer Kit (paK-OEK). This kit, which includes
three polarizer/analyzer units, expands the Optics Expansion Kit
(OEK) so your students can study linearly polarized light. The three
polarizer/analyzer units are the same in polarizing function, but
traditionally, the first one struck by the light is called the polarizer,
since it polarizes the beam. subsequent polarizing filters are then
called analyzers, since they can be used to measure the polarization
of the beam.
a polarizing sheet works only by absorbing light of one polarization
and passing another. it is a filter, albeit a clever one. with the
addition of a third absorbing filter, the light transmitted by the
system increases. How can that be? we leave that as an exercise for
your students. Bonus points: predict the functional shape of the
transmitted light vs. angle graph for the middle polarizer.
Polarizer/analyzer Kit, paK-OEK, $68
Simple Machines
using the Vernier dynamics System
submitted by: Tim Barricklow, franklin County High school, in
we set up an experiment to measure how light intensity varies
with angle. with the OEK light source set with the lED fully
exposed, the polarizer was set to pass vertically polarized light.
a Vernier rotary Motion sensor (rMV-BTD) was attached to the
analyzer to measure orientation.
Using logger Pro, we plotted transmitted light intensity vs. the
analyzer angle. The graph showed peaks every 0 and 180 degrees.
Malus’s law tells us that the function should be that of a cosine
squared function. That function (now one of logger Pro’s curve
fits) fits the data well.
students in Tim Barricklow’s class at franklin County Hs, indiana,
learn important characteristics of simple machines through
hands-on investigations. Using a Vernier Dynamics system (VDs)
track, carts, strings, pulleys, and a Dual-range force sensor
(Dfs-BTa), students investigate inclined planes and pulleys. To
begin, students assemble the cart and track as an inclined plane.
with the addition of a Dual-range force sensor and a pulley,
students can pull the cart up the ramp with a constant force.
students then analyze this force in logger Pro using the statistics
function. after repeating these measurements at various ramp
angles, students calculate the mechanical advantage and efficiency
of each configuration.
To investigate pulleys, students use the Dual-range force sensor
to lift a mass via a pulley system attached vertically to a ring stand.
students calculate the average force used to lift a mass with pulley
systems of varying numbers of pulleys. again, students calculate
the mechanical advantage and efficiency of each configuration.
Challenge:
finding the average force is a great way to simplify the concept
of mechanical work. However, if the force is not constant, it can
be difficult to examine this experimentally. Using the Vernier
Dynamics system track and cart with a Motion Detector and
Dual-range force sensor, it is possible to sample the quantities of
force and displacement continuously. students can then analyze
the data in logger Pro by numerically integrating the force data
over the displacement to calculate the work.
“Watts up” with Wired?
Wired magazine’s science blog Dot physics recently used the
watts Up pro (wU-prO) energy meter to measure two favorite
physics topics: coffee and electric motors.
The polarizer/analyzer Kit includes a third polarizing filter to study
more complex phenomena. Our favorite is this little conundrum:
set the polarizer and analyzer to a 90 degree difference in angle
so that the light transmitted through the stack of two filters is at
a minimum. now, insert the third polarizing sheet between the
polarizer and the analyzer, set to about 45 degrees from the
analyzer.
in “Coffee pot physics,” author rhett allain looks at the power,
energy, and temperature involved in brewing everyone’s favorite
caffeine-laden beverage. www.vernier.com/r1225
in “power and Electric Motors,” allain starts by measuring the
energy used by his home fridge and dives into a great explanation
of why electric motors use more energy when they first start.
www.vernier.com/r1226
THE CalipEr | spring 2012
3
VErniEr sOfTwarE & TECHnOlOgy
www.vernier.com
pHysiCs & EnginEEring
how Much Energy does a
dehumidifier use?
Many homeowners in damp climates such as Oregon keep mold at
bay with an electronic dehumidifier. These tend to be large, loud
devices. we wondered just how much energy a dehumidifier uses?
To find out, a watts Up pro (wU-prO) was used with a labQuest
interface to collect real-time power consumption data. a relative
Humidity sensor was also connected to labQuest to monitor the
relative humidity, which is the amount of water vapor in the air
compared to the maximum amount it can hold.
SpectroVis® Plus with labVIEW
a new addition to our labViEw offerings is sample code for our
spectroVis plus (sVis-pl, $459) spectrophotometer. The spectroVis
plus is an affordable CCD array spectrophotometer/fluorometer.
CCD array spectrophotometer technology allows you to collect a
full wavelength spectrum (absorbance, percent transmittance,
or intensity). you can program the spectrophotometer to detect
the peak wavelength. Once this is determined, you can create a
program to determine the concentration of a solution (Beer’s law)
or monitor the rate of a reaction. with its two different excitation
wavelengths, you can also program the spectroVis plus to measure
the fluorescence spectra of many compounds, such as chlorophyll,
fluorescein, gfp, and more.
we provide labViEw sample code for many of our devices. in
addition, we frequently post software Development Kits (sDKs)
for programmers to collect sample data with their own custom
programs. we hope that providing these resources may lead to
exciting student projects, sensor control programs, custom analysis,
or sTEM classroom use that integrates more depth into the
data-acquisition process.
To see a list of all devices currently supported by labViEw go to
www.vernier.com/r128
Time series for humidity (left axis) and power consumed by a
dehumidifier (right axis)
The power data show that when the compressor is on, it draws a
whopping 470 watts. The fan also runs for several minutes after
the compressor shuts down, which is the middle level of energy
use near 200 watts. note that even when the dehumidifier is
nominally off, it still draws about 3 watts. Because of the noise,
the dehumidifier was turned off at night, yielding the long,
low-energy spots in the graph. it is also interesting to note that
the relative humidity quickly climbs during these periods.
bite force: Komodo dragon vs. house Cat
is the bite from a cat really
stronger than the bite from a
Komodo dragon? The Komodo
dragon (Varanus komodoensis) is
a very large monitor lizard that
can grow up to 10 feet long and
can weigh more than 150 pounds.
it is a voracious predator that can
©istockphoto.com/ayimages
take down prey as large as a deer
or buffalo. yet a group of researchers, including stephen wroe
from the University of south wales, found that the world’s largest
living lizard has developed a unique system to take down prey
that does not rely on bite force. The researchers used logger Pro
to measure the output voltage of a strain gauge system designed
to measure bite forces, and found that a cat does appear to have
a stronger bite than the Komodo dragon. for more information
about this interesting research, go to www.vernier.com/r127
4
THE CalipEr | spring 2012
for more information on the spectroVis plus go to
www.vernier.com/r129
STEM activity: build a Sensor
a great sTEM activity for your students is to have them build their
own sensor or measurement device. One example is to build a
strain gage to measure the tension and compression forces in a
cantilever beam. in this activity, two strain gages are glued to a
long metal bar, such that one is mounted on the top of the bar
and the other is mounted on the bottom. when a force is applied
to the end of the beam, it bends downward in proportion to the
force (Hooke’s law). The top of the bar stretches as it is placed
in tension, while the bottom of the bar compresses. The top
strain gage is also stretched, and its resistance increases slightly
because the length of gage wire increases while the width of the
wire decreases. These effects are reversed for the bottom strain
gage, causing its resistance to decrease slightly. These changes in
resistance are small, but they can be measured accurately with the
proper circuit and a Vernier instrumentation amplifier (ina-BTa,
$59). a well-known circuit designed to convert small changes in
resistance to changes in voltage is a wheatstone bridge circuit.
when performing an activity such as this, students gain insight
into design, construction, troubleshooting, and evaluation. They
learn to measure the output voltage and use logger Pro calculated
columns to mathematically convert raw voltage to proper units.
They also learn an important lesson in what steps are required to
successfully complete a project and work within a team.
we have developed several activities designed to help you
incorporate sTEM into your curriculum. To see a copy of this sensor
activity, as well as others, go to www.vernier.com/r1210
VErniEr sOfTwarE & TECHnOlOgy
www.vernier.com
CHEMisTry
an alternative to the Standard
acid-base Titration
Just when you think that every possible variation of acid-base
titrations has been explored and documented, along comes one
more—and this one is really interesting. larry Dukerich (arizona
state University) and guy ashkenazi (The israel Center for
Excellence through Education) constructed a custom logger Pro 3
experiment file so that an acid-base titration would plot the
hydronium H3O+ ion concentration vs. the volume of OH– ions
added to the reaction mixture. according to their article, displaying
the titration data in this form allows the student to “determine the
concentration of an unknown base by focusing attention on the
point at which the [H3O+] appears to reach zero.” as part of the
data analysis, Dukerich suggests that the student zoom in on the
area of the plot near the equivalence point to observe that the
hydronium ion concentration indeed is never exactly 0.00 M.
Examining the data in this way, Dukerich asserts, opens the
students’ eyes to a clearer view of an acid-base titration.
see the complete discussion, along with sample data, at
www.vernier.com/r1211
Progress of hydronium ion concentration during an acid-base titration
Innovative use for the new
Chemical Polarimeter
Identifying Sugars in Everyday beverages
By Melissa Hill, ph.D.
The Chemical polarimeter is our newest instrument for college
and advanced high school chemistry. it detects changes in rotation
of plane-polarized light in the presence of an optically active
compound. The polarimeter uses a light sensor and a bidirectional
optical encoder to detect the quantity of light passing through the
sample at each angle as the analyzer is manually rotated. a graph
is produced that shows a clear change in the light’s polarization
with respect to angle. This allows the user to determine various
characteristics, including the identity of the specific chemical
compound being investigated. we have written several experiments
for the polarimeter, some of which can be found in our new lab
book Organic Chemistry with Vernier. Others are available as free
downloads at www.vernier.com/chem-pol. The following activity is
a fun way to help students understand stereochemistry using our
new polarimeter.
in this activity, students use the polarimeter to identify which
sugars everyday beverages have in common. first, it is necessary to
concentrate the beverages. They are initially too dilute to see any
differences in sugar content. One way to concentrate the solution is
to dry 50 ml of each beverage over 10 g of na2sO4 (or similar drying
agent). if you want a quantitative comparison between beverages,
you should use the same volume of solution and mass of drying
agent. you should also dry each solution for the same amount of
time. Once the solutions are concentrated, it is possible to see the
difference between diet soda that contains aspartame (α = +15°)
and regular soda that contains fructose (α = –92°). you will also be
able to tell if there is a difference between “natural” sodas that
may contain glucose (α = +53°) or sucrose (α = +66°) as the primary
sugar and a generic soda that will contain fructose. for college
students, this can be extended to beer and wine to explore the
percentage of sugar in each beverage. Clear liquids work best for
these experiments, however, colored liquids can also be used. for
instructions on using the polarimeter, see the user manual located
at www.vernier.com/chem-pol
Chemical Polarimeter, CHEM-pOl, $499
Standard graph of pH during acid-base titration
Comparison of sugar in different sodas using the Polarimeter
THE CalipEr | spring 2012
5
VErniEr sOfTwarE & TECHnOlOgy
www.vernier.com
CHEMisTry & BiOlOgy
nEW! Investigating Biology through
Inquiry lab book
we are happy to announce that our new inquiry-based biology
book, Investigating Biology through Inquiry, is now available. This
book contains 22 activities that will help you integrate inquiry into
your existing biology curriculum, whether you teach high school,
ap* Biology, iB** Biology, or biology at the college level.
Each investigation includes a preliminary activity, teacher
information, sample researchable questions, and lots of sample data.
investigations are correlated to ap and iB standards and are designed
to meet the recommendations of the aaas “Vision and Change in
Biology Undergraduate Education.” investigations include:
•InvestigatingBuffers
•Diffusion
•investigating Osmosis
•Chemistry of Membranes
•investigating protein: The
Bradford assay
•Testing Catalase activity (O2)
•Testing Catalase activity (gas
pressure)
•introduction to Biofuels:
Enzyme action
•analysis of Enzymes Using
Tyrosinase
•Cellular respiration
•sugar Metabolism with yeast
•fermentation with yeast
•photosynthesis by Chloroplasts
•Transpiration of plants
•plant pigments
•Heart rate
•investigating Dissolved
Oxygen
•investigating primary
productivity
•Modeling population
Dynamics
•water Monitoring
•Evolution of Cellobiase in
fungi
•introduction to Molecular
Evolution
•Evolution of yeast: artificial
selection
Praise for “analysis of Enzymes using Tyrosinase”
from Investigating Biology through Inquiry
“ After a literature search, many
[students] wanted to investigate
the action of tyrosinase from other
sources and compare it to the
potatoes, so they did extractions
from apples, pears, bananas and
even sweet potatoes. It proved to
be a great inquiry lab.”
Barb Burkhardt, University of
Indianapolis, Indianapolis, IN
INVEST IGATIN G
BiologyInquiry
through
AND GUIDED INQUIRY APPROACHES
EXPERIMENTS USING OPEN
By
Johnathan M. Melville
Donald L. Volz
Michael Collins
MEASURE. ANALYZE. LEARN.
boiling as a Cooling Effect
Jon asbornsen of the Hawken school (gates Mills, OH) shared his
work on a novel twist to a time-honored demonstration of boiling
points that uses labQuest, a gas pressure sensor, and a Temperature
probe. in the demonstration, a small volume of water is placed in a
bell jar. as the air in the jar is evacuated, the water boils. asbornsen
measured the pressure and temperature inside the bell jar. The
graphs of his data tell the story more convincingly than mere
observation of the phenomenon. asbornsen’s article can be read
at www.vernier.com/r1212
if you are new to inquiry-based instruction, the extensive teacher
sections will help guide you. in addition, this book also includes a
primer on basic statistical tests and experimental design.
Investigating Biology through Inquiry, BiO-i, $48
Pressure and temperature as a two-stage pump evacuates a bell jar
BiOlOgy JOB OpEning
Tyrosinase activity from potatoes, bananas, and sweet potatoes
** ap and advanced placement program are registered trademarks of the College Entrance
Examination Board, which was not involved in the production of and does not endorse this product.
** The iB Diploma program is an official program of the international Baccalaureate Organization (iBO)
which authorizes schools to offer it. The material available here has been developed independently
of the iBO and is not endorsed by it.
6
THE CalipEr | spring 2012
Vernier’s Biology Department is about to grow! if you want to
be part of the future of biology at Vernier, consider applying
for our Biology Educational Technology specialist position.
we’re looking for someone who is currently teaching or has
recently taught high school biology and/or ap Biology using
Vernier probeware. if you want to move to the northwest
and be part of one of the “100 Best Companies to work for
in Oregon” (for 13 years in a row), consider applying today.
we’d love to have you join our team. application deadline is
april 30, 2012. Visit www.vernier.com/jobs for details.
VErniEr sOfTwarE & TECHnOlOgy
www.vernier.com
BiOlOgy
Investigate Your Sense of balance
using a force Plate
nEW! activities for Teaching
Evolution with Vernier
The sense of balance is complex since it combines sensory input
from the eyes, inner ear, and stretch receptors located in the
tendons and muscles. in the classroom, you can demonstrate that
visual input is important for balance. Try balancing on one foot
with your eyes open, and then try it again with your eyes closed.
you will find that balancing on one foot with your eyes closed is
much more difficult than doing this with your eyes open.
now that evolution is one of the Big ideas in the new ap Biology
curriculum, many teachers have been asking how our sensors can
be used to teach concepts in evolution. with this in mind, our
Biology staff scientist, John Melville, developed several innovative
ways to investigate evolution using Vernier products. all of these
investigations can be found in our new Investigating Biology
through Inquiry lab book.
John Melville, our Biology staff scientist, has developed a simple
and innovative way to quantify this difference in balance using
a force plate (fp-BTa, $215). Just have a student balance on the
force plate using one foot with their eyes open. when the student
is ready, collect data for ten seconds. as the student shifts back
and forth to maintain his or her balance, the force on the force
plate will increase and decrease. The same test is then repeated
while the student has his or her eyes closed.
One simple and exciting activity is the “Evolution of yeast: artificial
selection investigation.” Darwin’s theory of natural selection was
influenced by his observation that farmers select plants and animals
that have specific traits for breeding. This process is referred to as
artificial selection. for thousands of years, humans have selected
plants and animals for different traits, such as hardiness, drought
tolerance, and productivity. after multiple generations of selective
breeding, a strain or breed is established.
students analyze their results by determining how much the
force profile shifts back and forth during each balance test. The
simplest way to do this is to find the standard deviation of the
force profile during each test. The standard deviation tells us how
far away a measurement is from the mean or average. in this case,
the standard deviation of the force is a measure of how hard or
easy it is for the student to balance. you can quickly determine the
standard deviation of the force for each run using the statistics tool
in logger Pro. if you are using a labQuest, choose the statistics
option from the analyze menu.
The yeast Saccharomyces is an excellent example of artificial
selection. Different strains of yeast are used to make beer, bread,
and wine. as a result, brewers and bakers have used artificial
selection to select specific strains of yeast for each purpose.
students start by measuring the respiration rate of baker’s yeast
using a CO2 gas sensor (CO2-BTa, $249) and then design their own
experiment. One researchable question students can investigate
is, “what is the effect of ethanol on different yeast strains?” as
shown in the sample data below, beer and wine yeast have a
higher ethanol tolerance than baker’s yeast.
in the sample data below, the standard deviation of force when
the student is balancing with his or her eyes open is ±4.905 n.
when the student’s eyes are closed, the standard deviation of
force during the balance test is ±22.45 n.
for questions about this and other biology investigations, contact
[email protected]
This is a great activity that lends itself to inquiry. students can
easily compare the balance of males and females, athletes and
non-athletes, or dancers and non-dancers, among others.
for questions about this or other physiology activities, contact us
at [email protected]
Ethanol tolerance of lager, wine, and baker’s yeast
a spECial OffEr
from bio-rad laboratories to Vernier Customers:
receive 10% off on all Bio-rad kits aligned with Investigating
Biology through Inquiry or Advanced Biology with Vernier. for
more information, go to www.vernier.com/r1213
Comparison of balance data with eyes open and closed
THE CalipEr | spring 2012
7
VErniEr sOfTwarE & TECHnOlOgy
www.vernier.com
2
Vernier labQuest 2 is a standalone interface used to collect sensor data with its built-in graphing
and analysis application. The large, high-resolution touch screen makes it easy and intuitive
to collect, analyze, and share data from experiments. its wireless connectivity encourages
collaboration and personalized learning. you can also use labQuest 2 as a computer interface
using logger Pro software for advanced analysis and video features.
full sensor support
faster analysis
Compatible with all
Vernier sensors
Quick response to touch,
curve fits, and modeling
high-resolution touch screen
• 12.8 cm, 800 x 480 pixel resolution
• Designed for both stylus and touch
• wide viewing angle for lab groups
built-in sensors
•
•
•
•
•
gps
3-axis accelerometer
ambient temperature
light
Microphone
fast data collection
100,000 samples per second
rechargeable batteries
Wireless Connectivity
High capacity, lithium-ion
rechargeable battery
8
Key
features
new for
labQuest 2
•Standaloneandcomputer
interface with a touch screen
•CompatiblewithallVernier
sensors
•Fastdatacollection
•Rechargeable,high-capacity
battery
•CompatiblewithWindowsand
Macintosh computers
•Freesoftwareupdates
•Collect,analyze,andshare
sensor data wirelessly on any
device with a compatible
web browser
•Largerandhigherresolution
screen with portrait and
landscape orientations
•Additionalbuilt-insensorssuch
as gps and accelerometers
•Fasterprocessorforfastanalysis
and graphing
THE CalipEr | spring 2012
www.vernier.com/r1214
Take the labQuest 2 product tour and
watch a video demonstration.
VErniEr sOfTwarE & TECHnOlOgy
www.vernier.com
laBQUEsT 2 sOfTwarE
Multiple runs can
easily be stored
and recalled later.
Quick
access to
graphs,
tables,
and meters
Live display
of sensor data
Curve fits and
other analysis
tools available
One or
two highresolution
plots of
data are
displayed
in real
time.
Curve fit statistics
are displayed.
built-In Software
analYSIS fEaTurES
•Performlinearand
curve fits
•Landscapeand
portrait views
•Supportsbuiltin sensors—gps,
microphone, relative
light sensors,
accelerometers
•Drawaprediction
before collecting
data
•Displaytwographs
at once
•Displayatangent
line on the graph
•Integralfunction
•Statistics
oThEr grEaT fEaTurES
•Stopwatch
•Periodictable
•Scientificcalculator
•Audiofunction
generator
•Poweramplifier
(requires Vernier
power amplifier)
•Exportdatato
logger Pro
•Morethan100
preloaded lab
instructions from
Vernier’s popular
lab books
•Notesfield
•Voiceannotation
with internal
microphone
•Findslopes,fitaline
to a portion of your
data, and display
position data and
its derivatives
Meter
one-Touch
Simplicity
The labQuest graphing and
analysis application gives your
students real-time graphing
capabilities in a handheld
device. it’s powerful—yet
beautifully simple.
buIlT-In aPPlICaTIonS
Data Table
Graph
your students can collect data
and view them in a data Table,
Meter, or graph View.
THE CalipEr | spring 2012
9
VErniEr sOfTwarE & TECHnOlOgy
www.vernier.com
sOfTwarE
Introducing labQuest Viewer™
•CopyanimageoftheLabQuestscreenforuseinlabinstructions
and assessment documents.
•MonitorstudentprogressbyviewinganyLabQuestunit
connected to your network.
•Launchmorethanoneinstanceoftheviewertomonitor
multiple labQuest units.
Part of the Connected Science System™
labQuest Viewer is covered by our generous site license policy:
purchase one copy of labQuest Viewer software, and install it on
any computer in your school or college department. additionally,
future upgrades of the software are free. The labQuest Viewer
software is compatible with Macintosh® Os X® 10.5 (intel-based
Macs only), 10.6, and 10.7 and windows® Xp (32-bit only), Vista®,
and windows 7. for more information, visit www.vernier.com/r1215
labQuest Viewer (lQ-ViEw, $49) is our new Mac and pC computer
software that allows you to display and control a labQuest right
from your computer. (labQuest units sold separately.) when your
computer is connected to a projector or interactive whiteboard, you
can use labQuest Viewer to show a labQuest screen to the entire
class. This is a great way to teach students how to use a labQuest
or to allow students to present their data to the class. labQuest
Viewer also allows easy capture of screen images, making it easy to
create step-by-step lab instructions and assessment questions.
labQuest Viewer software communicates with labQuest through
a wireless connection. This means that you can view any labQuest
connected to the network right on your teacher computer. Use this
feature to monitor student progress and share student results in
real time. wireless connectivity is built into labQuest 2 and can
be added to an original labQuest using a wi-fi UsB adapter (sold
separately, wifi-UsB, $59). labQuest 2 also supports a connection
via UsB for use when wireless connectivity is not an option. note:
The UsB option is not available when using the original labQuest.
if this option is required, you will need to use the labQuest
Emulator software.
Key features
•ViewandcontrolLabQuestfromacomputerorinteractive
whiteboard.
•CollectdatawithanysensorthatissupportedbyLabQuest.
labQuest Viewer
labQuest Emulator
supported computer platforms
Mac and pC
pC only
labQuest support
labQuest 2
Original labQuest*
Original
labQuest only
Communication
wireless
UsB (labQuest 2 only)
UsB
Use with computer and
interactive whiteboards
yes
yes
View multiple labQuests at the
same time
yes
no
supports UsB sensors
(e.g., spectrometers)
yes
no
supports all built-in sensors
yes
no
Cost (includes site license and
free upgrades when available)
$49
free
* requires wi-fi UsB adapter, sold separately
10
THE CalipEr | spring 2012
Software updates
Have you updated your Vernier applications recently?
we regularly release updates to support new devices and
to add new features. Keeping up to date with software
releases is one way to keep things running smoothly in
your classroom or lab.
loggEr Pro 3.8.5 – logger Pro 3.8.5 was released
in april 2012. This update is free to all users of any
previous version of logger Pro 3, and is available at
www.vernier.com/r1216
Version 3.8.5 primarily adds support for labQuest 2, and
it is required if you will be using the new interface. it also
adds support for the Diffraction apparatus and projectile
launcher. previous recent releases have added Data Marks
and Data Tags, allowing you to attach notes to particular
data points. Data Marks were developed to support
the Melt station. new curve fits support the Chemical
polarimeter, and Video analysis acquired several new
features, including the ability to automatically skip frames
and to calculate the center of mass for multiple objects.
labQuEST 1.6 – labQuest 1.6 for the original labQuest
was released in January, 2012. Version 1.6 adds support
for the Chemical polarimeter, Diffraction apparatus, and
projectile launcher. previous recent releases added Data
Marks and Data Tags, as well as the Data Matrix. labQuest
now supports the wDss with the addition of a Bluetooth®
radio dongle. labQuest also supports labQuest Viewer with
the addition of a wi-fi radio dongle. This free update is
available at www.vernier.com/r1217
loggEr lITE 1.6 – logger lite 1.6 was released in
March 2012 to support labQuest 2. The previous release of
logger lite added support for labQuest Mini and windows 7
(including 64-bit machines), as well as linear fits. The free
update is available at www.vernier.com/r1218
VIdEo PhYSICS for ioS – The current version of
Video physics is 1.1.3, released in March, 2011. Updates to
Video physics are always free and are available in the apple
app store.
VErniEr sOfTwarE & TECHnOlOgy
www.vernier.com
sOfTwarE
Vernier Supports Mobile Technology
Teachers using android™, ioS® and other
mobile-platform devices now have solutions
for data collection
wHaT DOEs VErniEr HaVE fOr ipad ?
®
graphical analysis™ for iPad
graphical analysis allows every student in a lab group to
connect to a shared labQuest 2 and get their own copy
of the experimental data, live over a wireless connection.
This makes it the perfect app for a one-to-one ipad program in a
science classroom. instead of having an experiment tied to a single
device, students can now collaborate with individual accountability.
with graphical analysis, students perform curve fits and other data
analysis functions made popular by logger Pro and labQuest. The
advanced multi-touch interface makes these features easier to use
than ever, in a simple, yet powerful, environment. The app also
introduces new features, such as the ability to create multiple data
selections with annotations and graph captions. students' projects
are automatically saved for offline viewing, allowing them to take
the data home and complete a lab report. graphical analysis also
integrates with other ipad apps for education: send your data to
numbers® or open your graphs in pages®, Evernote®, iBooks®, or
many other notebook and writing apps. graphical analysis is the
ultimate app for utilizing Vernier sensors to carry out hands-on
experiments with the added student-centric power of ipad. for
more information, go to www.vernier.com/r1219
Video Physics
launched last year, Video physics quickly became one
of the most popular tools for learning physics on ipad,
®
Video Physics iphone, and ipod touch . This app is the easiest way for
students to capture video of moving objects in the field. students
can quickly track and analyze the motion of objects, and produce
graphs of position and velocity in both the horizontal and vertical
dimensions. what's more, Video physics allows users to quickly
export the movie and data file to logger Pro for further analysis.
for more information, go to www.vernier.com/r1220
arE yOU pUrCHasing iOs apps
fOr sCHOOls?
sHarE DaTa wiTH MUlTiplE DEViCEs
Vernier Data share™
, the technology behind graphical analysis for
ipad, also supports connection through a web browser. This means
that you can perform data analysis with android-powered phones
and tablets, Chromebooks, netbooks, laptops, and many other
devices. More than just a viewer, Data share includes a full-featured
web app with tools for data analysis and annotation. students get a
live view of the data during collection, and the data is then stored
as their own copy that they can access and analyze offline or take
home. Data share web app provides many of the ground-breaking
features found in graphical analysis for ipad. students can apply
curve fits to multiple selections, as well as annotate data and add
graph captions. Data share web app is the most flexible studentcentric data analysis tool ever, supporting many devices at once,
many sensors at a time, and any device with a compatible web
browser. it's perfect for hands-on science with a Bring-your-OwnDevice model or for any classroom with a mix of student devices.
for more information, go to www.vernier.com/r1221
purchasing apps for iOs devices can be a challenge for
schools. Did you know that your school or department
can purchase vouchers to distribute apps such as Vernier
Video physics to multiple devices?
This is a way to distribute iOs apps to both school-owned
and student devices. you can use purchase orders or credit
card, and school purchases are tax-exempt. you receive
a 50% discount when purchasing 20 or more copies of
Vernier Video physics or Vernier graphical analysis.
www.apple.com/itunes/education/
THE CalipEr | spring 2012
11
VErniEr sOfTwarE & TECHnOlOgy
www.vernier.com
awarDs
Science Teachers Win
Vernier/nSTa Technology award
$3,000 in Technology and Cash awarded for
Innovative uses of Vernier Technology
Congratulations to the 2012 Vernier/nsTa Technology
award winners!
ElEMEnTary (graDEs K–5)
Zoe ann Jorgensen, a.h. bush Elementary
Magnet School, Idaho falls, Id
when the idaho national laboratory needed a
year of wind speed data to establish the viability
of a small wind turbine installation, elementary
teacher Jorgensen used the opportunity
to have students conduct a real-world science
investigation. Vernier technology was used to
collect data that was presented to the school
board and the idaho national laboratory.
MiDDlE sCHOOl (graDEs 6–8)
Shannon hudson, Tuttle Middle School,
Crawfordsville, In
Hudson used the vast history of her school’s
soil to conduct interdisciplinary experiments.
Her school sits on a hill that was once a tropical
ocean, a deciduous forest, and crop fields.
students used Vernier equipment to conduct
various soil experiments over a period of months
and compared data to explain their results.
Christopher Widmaier, World of Inquiry School,
rochester, nY
widmaier’s students use probeware to complete
an investigation of varying light levels in
different environments. They will use this data
to help understand the influence of ultraviolet
light on living organisms and human skin color.
HigH sCHOOl (graDEs 9–12)
Sharla dowding, Ed.d, newcastle high School,
newcastle, WY
Encouraging her students to think inquisitively
about what they eat, Dowding has her students
use Vernier technology to conduct investigations
such as finding the food coloring concentration in
fruit loops, the concentration of color in Kool-aid
solutions, and the amount of sugar in soda.
John l. gensic, new Prairie high School,
new Carlisle, In
gensic’s students conducted experiments on
well water feared to be contaminated by
septic systems and over-fertilized farm land.
Understanding well-water quality helps these
students understand their surrounding’s resources.
COllEgE
Venkatesh gopal, Elmhurst College, Elmhurst, Il
gopal’s project is to build an audio-frequency
working model of a phased-array radar as a
striking demonstration of time-reversal in optics
and acoustics. The project will be used in an
upper-level course on modern optics.
The Vernier/nsTa Technology awards promote the innovative use
of data-collection technology using a computer, graphing calculator,
or other handheld in the science classroom. we encourage you to
apply for one of seven $3,000 awards.
To apply for 2013, see www.vernier.com/r1222
VErnIEr aWardS
Vernier is proud to
be recognized for
its philanthropic
commitment, steady
growth, and as one
of the Best 100
Companies to work
for in Oregon—for
13 years in a row.
INTERNATIONAL
AWARD
FOR LABQUEST
FASTEST GROWING
PRIVATE
COMPANIES
PLACED 25TH OF 100
BEST GREEN COMPANIES
IN OREGON
2011 HEALTHIEST
EMPLOYERS
6TH PLACE
OREGON BUSINESS
AWARD
Jacqueline bondell, north Carolina School of
Science and Mathematics, durham, nC
Ershela Sims, north Carolina School of Science
and Mathematics, durham, nC
Bondell and sim’s physics and robotics classes
teamed together and designed a walking robot.
The successful program is being adapted into
a teacher workshop as a model of an applied
sTEM activity for other classes.
logger Pro, labQuest, labpro, Vernier and caliper design, go!, logger lite, Vernier EasyTemp, Vernier
Easylink, and Vernier EasyData are our registered trademarks in the United states. Vernier software &
Technology, vernier.com, and graphical analysis are our trademarks or trade dress. all other marks not
owned by us that appear herein are the property of their respective owners.
iphone, ipad, and ipod touch are trademarks of apple inc., registered in the U.s. and other countries.
12
THE CalipEr | spring 2012
VErniEr sOfTwarE & TECHnOlOgy
Vernier in the Science Journals
Our products are often used in innovative experiments and
demonstrations described in journals. Here are some recent ones
from The Physics Teacher:
“Vibration analysis and the accelerometer,” The Physics Teacher,
november 2011 by paul Hammer, East Catholic Hs, Manchester, CT.
This article shows how to use our accelerometers and logger Pro
to obtain useful information about vibrating objects, such as small
fans, motors, and pumps. The ffT feature of logger Pro makes this
analysis relatively simple.
“laboratory activity: specific Heat by Change in internal Energy of
silly putty,” The Physics Teacher, December 2011, by John Koser,
University of st. Thomas, st. paul, Mn. in this article, the author
describes an experiment, designed for undergraduate liberal arts
majors, to show the conversion of mechanical energy to heat energy.
He uses our temperature sensor placed inside a blob of silly putty®.
“Empowering Technology and pOETry supporting scientific
inquiry: investigating the Motion of a rebounding Trolley,” by
Hildegard Urban-woldron, University of Vienna (austria), shows
how to use the Ti-nspire and one of our Motion Detectors to do
a very complete analysis of the bounces of low-friction carts. The
curve-fitting features of the Ti-nspire are nicely demonstrated.
25 years ago in
ThE
CalIPEr
25 Years ago in The Caliper:
we discussed compatibility with the new apple ii gs
computer and noted with great enthusiasm that The Physics
Teacher magazine had devoted their entire May 1987 issue to
“Computers in the Classroom.” Using computers in physics
teaching was catching on!
SCIEnCE huMor
This time we have two scientific bar jokes:
some mathematicians go into a bar. The first orders a beer.
The second orders a half beer; the third a quarter of a beer.
The bartender slams down two beers and says, “Know
your limits.”
“we don’t allow faster-than-light neutrinos in here,” says
the bartender.
a neutrino walks into a bar.
www.vernier.com
nEW! real-World Math with Vernier
lab book
Real-World Math with Vernier is a
newly revised lab book containing
E
32 activities that connect real-world
CONNE CTING MATH AND SCIENC
applications with concepts such
as functions, statistics, systems of
equations, and others from algebra
through calculus. with the gaining
popularity of the Ti-nspire
technology in math, we adapted
the activities from the previous
Real-World Math books for use with
the Ti-nspire using our DataQuest
application for collecting sensor
data. The Ti-nspire versions of our
student activities make use of the many features unique to the
Ti-nspire, including movable lines, sliders, and calculated columns.
orld Math
Real-W
WITH VERNIE R
By
John Gastineau
Chris Brueningsen
Bill Bower
Linda Antinone
Elisa Kerner
MEASURE. ANALYZE. LEARN.
• Use the Vernier gas pressure sensor to show the linear
relationship between depth and pressure or to investigate
inverse relationships through pressure and volume.
• Model a walker’s motion using a piece-wise continuous function,
plot an ellipse with a swinging pendulum, or introduce your
students to statistics through analyzing height data collected
with a Vernier Motion Detector.
• Explore logistic functions as students locate the equivalence
point in a titration with the Vernier pH sensor.
The Real-World Math with Vernier lab book includes teacher
information pages with tips and sample data, complete student
activities for the Ti-nspire in the printed manual, and a CD
of modifiable student versions in Microsoft® word®. student
instructions on the CD include Ti-nspire technology, EasyData,
DataMate, and logger Pro versions.
for standard and textbook correlations, experiment previews, and
more, please visit www.vernier.com/r1223
real World Math with Vernier, rwV, $48
rick Sorensen is retiring
rick joined Vernier software & Technology in
1994. we got to know him as a local physics
teacher. rick has been a very valued friend and
colleague ever since. He has led our company’s
very important collaboration with Texas
instruments, which included development of
CBl, CBl 2, labpro, Ti-nspire lab Cradle, and
many related products. He has been a key
player on our physics technical support/r&D
team, and he has been the driving force
behind most of our physics products, including our new Centripetal
force apparatus and projectile launcher. rick has been a senior
partner at Vernier for over a dozen years. we will all miss him, and
we wish him a happy retirement.
THE CalipEr | spring 2012
13
VErniEr sOfTwarE & TECHnOlOgy
www.vernier.com
VErniEr arOUnD THE wOrlD
Vernier Equipment used for Monitoring
South american rain forests
we recently received reports and photos of two great projects
involving water quality monitoring in south america.
Jack sanford and some of his students from Derryfield school,
Manchester, nH, recently completed a trip to the rain forest of
Ecuador. They were documenting the populations of amphibians
and measuring some environmental parameters that affect them:
pH, temperature, and conductivity. They used our sensors and
labQuest for the field work.
Canadian Workshops
are you one of our Canadian customers? if so, let Merlan
scientific customize a Vernier workshop for your school! we
know that opportunities for teacher professional development
are limited, and we can help you make the most efficient use of
your valuable time. request a customized workshop quote today!
1-800-387-2474 | [email protected] | www.merlan.ca
Investigate the Iron hypothesis
in the late 1980s, Dr. John Martin made a prediction that iron
was a factor limiting phytoplankton growth. He hypothesized
that increasing the amount of available iron in the ocean would
increase primary productivity, ultimately leading to a decrease in
the amount of carbon dioxide in the atmosphere, an idea known
as the iron hypothesis. seeding the ocean with iron has been
suggested as one way of mitigating global climate change.
The Biology Department at Vernier has developed a simple way
to demonstrate the iron hypothesis. increasing concentrations of
iron (ii) gluconate were added to samples of water containing
algae (Chlorella). we used the protocol from our new Investigating
Biology through Inquiry lab book (BiO-i, $48) to measure primary
productivity of each sample. as the data show, productivity
increased as the iron concentration increased.
New Hampshire students measure water quality in Ecuador
for more details on this investigation and the iron hypothesis, visit
www.vernier.com/r125
Junior scientists @ iracambi is a program that teaches students
about the environment in the atlantic forest of northern Brazil.
They have about 100 local students involved once a month. The
Junior scientists have done soil and water monitoring, recorded
weather data, started on tree identification, and learned how to
make tree seedlings. They use our water quality and soil moisture
sensors. Thanks to Binka le Breton, project leader, for the photos
and information on this program. you can watch a 3-minute video
about the Junior scientists at www.vernier.com/r1224
Increasing amounts of iron in solution produce an increase in both net
and gross primary productivity
Brazilian students become Junior Scientists in the Atlantic Forest
14
THE CalipEr | spring 2012
Please pass this newsletter on or recycle it again.
VErniEr sOfTwarE & TECHnOlOgy
www.vernier.com
prOfEssiOnal DEVElOpMEnT
free hands-on, data-Collection
Workshops
hands-on Training using labQuest 2 and labQuest Mini
Join us for a free, 4-hour, hands-on workshop using labQuest 2
and labQuest Mini to learn how to integrate our computer and
handheld data-collection technology into your science curriculum.
The workshops include lunch or dinner and lab handouts on CD.
for more information and registration, contact us or visit our web
site at www.vernier.com/r126
APRIL
MAY
16
18
19
24
25
26
28
30
30
30
1
1
3
3
Memphis, Tn
Jackson, Ms
Baton rouge, la
princeton, nJ
newark, nJ
white plains, ny
Bridgeport, CT
Hartford, CT
san Jose, Ca
Tri Cities, Tn
Oakland, Ca
winston-salem, nC
sacramento, Ca
Columbia, sC
one day Summer Workshops
Join us for a day using labQuest 2 and labQuest Mini to learn how
to integrate our data-collection technology into your chemistry,
biology, physics, middle school science, physical science, and Earth
science curriculum. These 6-hour, hands-on workshops include lunch
and lab handouts on CD. The cost of the workshop is $99.
JUne
11 Dallas, TX
11 Omaha, nE
14 little rock, ar
14 Minneapolis, Mn
25 atlanta, ga
25 Chicago, il
28 raleigh, nC
28 Cleveland, OH
Physics/aP Physics*
high School Two-day Institutes
biology/aP* biology
baltimore, Md | July 9–10
These Biology/ap Biology summer institutes will feature hands-on
training using labQuest 2 and labQuest Mini integrating
technology into your biology class. a variety of experiments will
be offered, including many that align with the new ap Biology
curriculum framework. specific emphasis will be placed on
how to conduct inquiry-based laboratory investigations. The
$199 registration fee includes a copy of Investigating Biology
through Inquiry.
aP* Chemistry
denver, Co | June 20–21
AUgUst
6 Beaverton, Or
9 spokane, wa
high School/College Two-day Institutes
denver, Co | June 18–19
denver, Co | June 22–23
JULY
16 Boston, Ma
16 phoenix, aZ
19 philadephia, pa
19 san Diego, Ca
baltimore, Md | July 11–12
Vernier and flinn scientific will co-host these ap Chemistry hands-on
technology institutes using labQuest 2 and labQuest Mini. During
these summer institutes, teachers will do many of the experiments
recommended by The College Board. These experiments will center
around Vernier and flinn equipment, supplies, and kits. The $199
registration fee includes a copy of Advanced Chemistry with Vernier.
online Webinars
Vernier holds free, one-hour training events online. The presenter
will give a tour of Vernier products and answer questions. all you
need is a broadband internet connection and a phone line. recorded
versions will also be available for download.
baltimore, Md | July 13–14
This institute will survey physics data-collection and video tools
offered by Vernier. participants will learn both basic and advanced
skills in logger Pro. Video capture and analysis will be emphasized.
Data collection will use labQuest 2, labQuest Mini, and a variety
of physics sensors. The $199 registration fee includes a copy of
Advanced Physics with Vernier – Mechanics.
College Two-day Institutes
College biology
Chicago, Il | august 6–7
in this institute, you will conduct a series of laboratory exercises
using labQuest 2 and labQuest Mini that are designed for
general biology at the college level. areas of focus will include
cellular respiration, carbohydrate metabolism, enzyme kinetics,
photosynthesis, and more. Options for human physiology, ecology,
and biotechnology will also be presented. The $199 registration
fee includes a copy Advanced Biology with Vernier.
College Chemistry
Chicago, Il | august 8–9
Vernier and flinn scientific team up to present this institute.
you will investigate many important topics in chemistry, including
thermodynamics, kinetics, acid-base reactivity, and equilibrium.
Data collection and analysis will open your eyes to new ideas for
hands-on activities in your laboratory using labQuest 2 and
labQuest Mini. The $199 registration fee includes a copy of
Advanced Chemistry with Vernier.
for more information and registration for these training opportunities, go to www.vernier.com/training/
* AP and Advanced Placement Program are registered trademarks of the College Entrance Examination Board, which was not involved in the production of and does not endorse this product.
THE CalipEr | spring 2012
15
Toll free 888-837-6437
www.vernier.com
prsrT sTD
U.s. pOsTagE
paiD
salem, Or
permit no. 526
13979 sw Millikan way
Beaverton, Or 97005-2886
MEASURE. ANALYZE. LEARN.
aDDrEss sErViCE rEQUEsTED
Follow us on Twitter
and become a Vernier
fan on Facebook
TM
facebook is a registered trademark of facebook, inc.
nEW Vernier Projectile launcher
investigate important concepts in two-dimensional
kinematics. www.vernier.com/vpl
OrDEr CODE
Vpl
$289