1
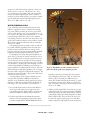
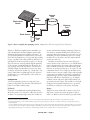
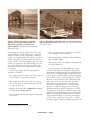
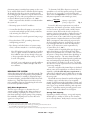
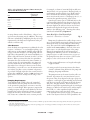
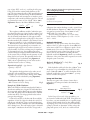
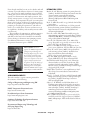
Designing Solar Water Pumping Systems
for Livestock
Circular 670
Thomas Jenkins1
Cooperative Extension Service • College of Agricultural, Consumer and Environmental Sciences
INTRODUCTION
In many parts of the world, including New Mexico
(NM), water and energy availability are growing concerns. In areas where connection to an electric utility
is not available, the primary technologies for water access—surface sources or pumping—have remained fairly
constant for decades. As demands for higher quantities
and quality of water, lower costs, improved reliability,
and environmental concerns have increased, many livestock and agricultural producers are investigating an alternative technology for remote water pumping: directcoupled solar photovoltaic (PV) powered systems.
Since the process to design and implement such a system may be a challenging task, New Mexico State University’s Engineering NM program initiated a project to
provide the Cooperative Extension Service (CES) with
a demonstration module, an interactive design spreadsheet, and literature related to solar water pumping to
better inform NM water users about the benefits and
methodology of implementing this technology. Available through NMSU multimedia and the CES statewide
Extension agent network, these tools serve to educate
interested constituencies (primarily farmers and ranchers) in using solar energy to pump water.
This publication provides a general discussion of how
to design a photovoltaic-powered solar water pumping
system for livestock. A companion publication, Circular
671, Designing Solar Water Pumping Systems for Livestock:
User Manual (http://aces.nmsu.edu/pubs/_circulars/
CR671.PDF), provides step-by-step instructions for using a Microsoft Excel spreadsheet to perform necessary
calculations for designing a solar pumping system.
SURFACE WATER SOURCES AND LIVESTOCK
Livestock, crops, and people often depend upon surface
sources of water (streams, ponds, catch tanks, etc.) or
wells accessing underground aquifers2. Because of a vari-
ety of benefits, and increased regulations in some states,
it is often desirable to move water from a surface source
to a different location, elevation, or “drinker,” or to
pump water from a remotely located well.
For surface sources, a well-vegetated riparian zone
establishes a buffer that filters and purifies water as it
moves across the zone, reducing sediment loads, supporting soil stability, improving water quality, and enhancing wildlife habitat. Excessive livestock pressure on
surface sources often causes nutrient loading, streamside
vegetation damage, erosion, pollution, and decreased
animal growth and health. One approach is to remove
or limit access to these areas; however, often this is the
only viable water source for producers. Fortunately,
research shows that in many cases pumping water to a
different location, combined with a managed rotational
grazing plan3, optimizes animal performance, pasture
use, water quality, and wildlife in these zones (Buschermohle and Burns, n.d.; Morris and Lynne, 2002).
While cows may wade out to obtain better water,
calves tend to only drink from the shore. By wading
into surface sources, cattle pollute the water with their
urine and feces and may disturb the water with their
wading action. Eventually cattle may refuse to drink,
and they will have to be moved even though local forage is still plentiful.
Calves require higher-quality water and will not fight
cows or mud to obtain it. Increases of 50 pounds/head
in weaning weight have been reported when water in
sufficient quantity and quality is provided. Studies have
shown that, when given a choice, cattle drank from a
water trough 92% of the time rather than from a nearby
stream (Bartlett, n.d.). Research also shows that yearling
steer performance increased 23% when supplied with
an alternate water source rather than dugouts (earthen
dams or reservoirs). In addition to increased livestock
and resource performance, by routing the livestock away
from riparian zones, very large reductions (50–90%) in
Professor ([email protected]), Department of Engineering Technology and Surveying Engineering, New Mexico State University.
An excellent source on windmills: http://aces.nmsu.edu/ces/windmill
3
It has been shown that livestock will only travel a limited distance to water sources with typical water source spacing of one source per 250 ha to harvest
grasslands, otherwise there is strong potential for overgrazing close to water supplies.
1
2
To find more resources for your business, home, or family, visit the College of Agricultural, Consumer and Environmental
Sciences on the World Wide Web at aces.nmsu.edu
streptococci and coliform fecal organisms, waterborne
diseases (foot rot, red nose, TB, mastitis, etc.), nitrogen, phosphorous, suspended solids, and surrounding
erosion are realized. By pumping water to drinkers,
ranchers can better utilize pastures, get superior animal
growth and health, and provide higher-quality water
(Pfost et al., 2007; Surber et al., n.d.).
WATER PUMPING BASICS
Costs, reliability, and environmental concerns often
influence a producer’s choice of surface water pumping system. When producers do not have economical
access to grid electric power4, they generally look to options such as ram, sling, diesel, wind (Figure 1), or solar
powered pumps. When these choices are compared,
solar pump systems are often the best choice due to the
operational conditions inherent to New Mexico, which
allows them to function effectively and economically
(Foster et al., 2010).
Solar pumping systems for surface sources or wells can
be portable, which is appealing because more and more
producers want systems that can move among various
locations. Some users are even powering broken windmill
pump jacks with portable photovoltaic (PV) systems.
For pumping water from underground aquifers via
wells, access to existing AC electric connections (closer
than one-half kilometer or 0.3 mi) is again the best option. In remote locations, though, PV water pumping
systems represent a very attractive, long-term, cost-effective alternative to hauling water, diesel pumps, and even
traditional windmills for drinking water and many irrigation applications (drip/trickle, hose/basin, and some
channel irrigation–although typically not for very high
flow rates such as might be used in flood irrigation). The
abundant and varied benefits of PV systems make them
attractive in many situations.
A solar pumping system involves calculations and
concepts that may make it difficult to determine a
design if one is unfamiliar with the technology and terminologies. With this in mind, NMSU developed the
following tools to aid and educate a potential user:
1.Two portable demonstration devices that illustrate
the concepts and major system components for a
solar pumping system. Each module is portable and
therefore available for displays and presentations.
2.Literature and educational multimedia materials
related to PV water pumping systems (http://www.
youtube.com/playlist?list=PL89870B418A514D27),
4
Figure 1. Windmills are still a common source of
power for off-the-grid water pumping systems.
including comparisons between three main remote
water pumping technologies (Table 1) used in New
Mexico today, contrasting two different ways to
mount PV modules (fixed-angle mounting vs. singleaxis tracking systems), and a simple cost analysis for
each of the three technologies and mounting systems
(Foster et al., 2010).
3. A Microsoft Excel spreadsheet to provide an easy and
visual educational tool to present concepts behind PV
technology and system design methodology (available
to download at http://aces.nmsu.edu/pubs/_circulars/
CR671/CR671.xlsx). This tool allows the user to follow the basic step-by-step design process, and offers
sample components and simple economic analysis for
It can cost $10,000 to $30,000 per mile to install electrical power line through rugged terrain.
Circular 670 • Page 2
Table 1. Remote Water Pumping Technologies Comparison Chart
TechnologyAdvantages
Disadvantages
Solar
Wind
• Renewable/sustainable
• No fuel costs
• Can be portable and remote
• Very low operation/maintenance costs
• Federal and state tax incentives
• Acceptable capital costs and low recurring costs
• Reliable warranty of 20+ years for panels
• Relatively easy to install
• System is modular and may be modified to fit needs
• Variable water delivery depending on sun intensity
• Low flow rates
• Supplemental storage needed
• Extended time to meet required storage
• Higher initial costs (although costs are trending lower)
• Renewable/sustainable
• No fuel costs
• Federal and state tax incentives
• Remote applications
• Proven technology with pool of expertise and experience
• Lower initial costs
• Only works when wind conditions are adequate
• Winds are seasonal
• Some operating costs and higher repair/maintenance costs
• Labor-intensive • Difficult to find parts and special tools needed
• Low flow rates
• Extended time to meet required storage
• High winds may damage windmill
Fossil fuels (diesel)
• Higher flow rate
• Often no need for storage
• Proven technology with large pool of expertise
• Easy to install
a user-defined scenario. For the sake of organization
and ease of use, the spreadsheet follows the design
approach outlined in this publication. A companion
publication, Circular 671, Designing Solar Water
Pumping Systems for Livestock: User Manual (http://
aces.nmsu.edu/pubs/_circulars/CR671.PDF), covers the step-by-step instructions for using the Excel
spreadsheet to design a solar water pump system.
• Environmental issues
• Manually operated
• Accessibility issues
• Required periodic maintenance and replacement
• Moderate to high initial cost
• Fuel costs and storage/transportation
charge point, total feet of pipe, nominal diameter of
the pipe, valves, and elbows, etc.
• Storage systems—catch tanks, concrete or plastic
storage tanks, etc.—to ensure the daily water requirement is available during low-light conditions.
• Costs—capital, operation and maintenance, labor,
life-cycle, etc.
SOLAR WATER PUMPING SYSTEMS
In order to design and successfully implement solar
water pumping systems, you need an understanding of
several concepts as well as information specific to how
you will use your system. This includes:
In addition, these factors should be considered:
• Who will install and maintain the system.
• Daily water requirements and usage—drinking, irrigation, etc. Requirements for high volumes or flow
rates may limit applications.
• Environmental benefits (including low noise).
• Available sunlight, which depends on location. Low
levels of sun may limit PV.
• Well characteristics, such as water depth, drawdown levels and recharge rates, seasonal variations,
discharge elevation from earth’s surface to water dis-
• Security—although ideal for remote locations, systems may be vulnerable to theft and vandalism.
Basic Operation
With no moving parts, the PV panel takes energy from
sunlight and generates DC electricity, which is then directed through a controller to the pump/motor in what is
termed a “direct-coupled system” (Figure 2). The pump/
motor combination (hereafter referred to as the pump)
moves water from the source through a pipe to a discharge
point, commonly a storage tank that feeds a trough-drinker
Circular 670 • Page 3
Photovoltaic
Panels
Pump
Controller
Storage
Tank
Watering
Tank
Water Source
Pump
Set
Figure 2. Direct-coupled solar pumping system. (Adapted from The University of Tennessee Extension.)
(Figure 3). This direct-coupled system is intended to operate only during the day when sunlight is present, thus
eliminating the expense and complexity of batteries5. In
a properly designed direct-coupled system, extra water
must often be pumped into a storage tank. By providing
storage, a producer can still provide their daily water requirements from the storage tank at night or on cloudy
days. The amount of water pumped depends primarily
on the amount of sunlight hitting the PV panels, the
type of pump, and a few other factors. The amount of
available sunlight is predictable by location, but there
are always variations in weather (e.g., cloudy days6). By
using a simple direct-coupled approach, the operation,
maintenance, costs, and complexity of the system are
greatly reduced.
Solar water pumping systems are composed of two
primary components other than the well itself: the PV
panels (or modules) and the pump.
security, and minimize shading and damage (Figure 4).
It is critical to minimize shading from structures and
vegetation during all watering seasons because even partial shading can cause significant power loss. Locating
modules close to the water source also helps minimize
power losses and costs.
Modules are sized as DC power (watts [W]) and
come in all sizes, from a few watts to over 250 W. Rated
power is determined by the output voltage and current
under standard sun intensity. A module rated at 50 W
may have an operating voltage up to 17.4 volts (V) and
a maximum current of 3.11 amps (A). Modules can be
wired in series to increase output voltages and in parallel
to increase current while also increasing total power. If
sunlight changes (clouds), output current will fall and
thus power will fall at a relative level (e.g., if sunlight
is halved, current and power will be halved while voltage remains about the same). PV modules are sized and
configured (series/parallel combinations) to power the
second major component of the system: the pump.
PV Panels
PV panels are installed with mounting hardware that
allows the panels to be oriented7 to adjust the tilt of the
modules to an optimum angle, elevate the modules for
Pumps
Pumps move water from wells or surface sources. It is
important to analyze the system properly in order to
make it as efficient and economical as possible while
Components
Batteries are expensive, must be replaced every few years, and require periodic maintenance, while the useful life of storage tanks may be decades.
PV panels may produce up to 80% of their maximum output power on partly cloudy days, and even on extremely overcast days can still produce about 25%
of their maximum.
7
As a rule of thumb, PV panels are faced due south and at a tilted angle equal to the location’s latitude. This may be fixed or variable depending on seasonal conditions and other factors. For example, a summer tilt angle would be flatter to capture more sun with tilt angle equal to the latitude angle -15° while a winter tilt
angle might be latitude angle +15°. In Las Cruces, the latitude angle would be 32° tilt, a summer tilt of 17°, and a winter tilt of 47°.
5
6
Circular 670 • Page 4
Figure 3. PV-powered pump systems often
discharge to a storage tank to provide the
daily water requirement even under lowlight conditions. (Photo from National Renewable
Energy Labs, 1997.)
Figure 4. PV modules mounted to trailers can be easily oriented
and moved based on water needs. (Photo from National Renewable
Energy Labs, 1997.)
still meeting the watering requirements. Choosing
and matching PV modules and pumps to meet the
design constraints is vital. In designing an efficient
system, one should minimize the amount of work required of the pump, which minimizes the amount of
energy needed to operate the pump and thus the size
and cost of components. By understanding these basic concepts beforehand, the designer will be able to
determine the appropriate pump (and PV modules)
for a system.
In selecting a pump, the following parameters
should be considered:
• The required capacity or flow rate—how many gallons per minute (or per day) are needed.
• The conditions on the suction side of the pump
(lots of grit, sand, or dissolved minerals in the water; algae growth; etc.).
• Whether the pump will be submersible in a well
or pump from a surface source.
• The total head capability (how high can the pump
move water).
8
• Space, weight, and position limitations, as well as
cost of equipment and installation.
• Codes and standards, including the National Electrical Code (Wiles, 2001).
• The voltage(s) and power required for the pump and
its working efficiency8.
Once each parameter is clearly addressed, a pump
can be selected. Pumps are classified as either positivedisplacement or kinetic/centrifugal, and each has advantages. The list of available pumps (and manufacturers)
is very extensive, and many will be capable of pumping
from a surface source or a well. A pump for a “well application” is most commonly a DC submersible pump
with a range of 12 V to more than 36 V, but may be
much higher for very deep wells or high flow rates.
The current is typically in the 3 to 5 A range, which
equates to a rough operating power up to (though
typically much less) around 1 horsepower (or 746 W).
DC pumps use one-third to one-half the energy of AC
pumps and are specifically designed to use solar power
efficiently even during low-light conditions at reduced
voltages without stalling or overheating. Solar pumps
are low volume, pumping an average of 1 to 5 gallons
per minute (gpm). A majority of pumps are positive dis-
Average pump efficiencies are in the 25–35% range.
Circular 670 • Page 5
placement pumps (centrifugal-type pumps are also common), which enables them to maintain their lift capacity
all through the solar day at varying speeds that result
from changing light conditions9. A good match between
the pump, PV array, and system parameters is necessary
to achieve efficient operation (Morris et al., 2002).
Other components that should be considered within
the system are:
To determine Daily Water Requirement using the
spreadsheet tool, enter the quantity and type of animals
(cow, horse, etc.) you wish to service from this well.
These entries and Equation 1 are used to calculate total
daily water required for each animal type (item).
• Mounting system for the PV modules10.
Livestock’s daily water requirements vary with air
temperature, the animal’s age and size, activity, distance
to water, lactation, dry matter intake, and dry matter
moisture content. Water needs closely correspond to
quantity of feed or forage intake; as intake increases, the
water requirement level will increase. However, with a
moisture content of 70 to 90%, lush forage may supply
a large amount of required moisture in cooler weather.
Water consumption is almost directly proportional to
the level of milk production, and lactating cows therefore need higher amounts of water. Air temperatures
of 70 to 95°F may increase water requirements by
2.5 times (Pfost et al., 2007).
Common values of required gallons per day per animal in New Mexico can be found in the Daily Water
Requirement spreadsheet tab or in Table 2, but you have
the option to change these default values depending on
your unique situation11. The water demand should be
estimated for the highest demand period (typically summer) and anticipated growth during the design cycle
(at least 10 years). In windy, hot, dry areas, you should
also take into account evaporation losses associated with
open storage methods.
Once the total gallons/day/animal figure is calculated
and any extra water requirements are entered, values are
summed to yield the total daily water requirement in
gallons/day. A multiplier may be added that can provide
an extra water cushion, offset evaporation losses, or refill
the storage tank.
Household water use demand is variable and depends
on climate, usages, and other factors, but is typically
around 75 gallons/person/day for drinking, cooking, and
bathing. Irrigation water demand depends on local conditions, season, crops, methods of delivery, and evapotranspiration12. Agriculture watering is usually greater in summer seasons when solar radiation is at its highest.
• A controller that allows the pump to start and operate under weak-sunlight periods (cloudy conditions,
early morning, late afternoon).
• Water level sensor for on/off operation if using storage.
• Direct-burial wire (UF), grounding, disconnects,
and lightning protection.
• Pipe, fittings, and other balance-of-system components (a common mistake is to oversize the piping).
- Most PV applications will be pumping at low flow
rates (1–5 gpm), and these low flow rates will not
have sufficient water velocity through a large pipe
to keep suspended solids from settling out into the
bottom of the piping.
- One-half- to two-inch piping is typically sufficient
for most scenarios; smaller is cheaper and often
more efficient.
DESIGNING THE SYSTEM
A livestock watering well will be used in this example. This
section will reference the accompanying Excel spreadsheet
covered in Circular 671 (available to download at http://
aces.nmsu.edu/pubs/_circulars/CR671/CR671.xlsx). Italicized text (e.g., Daily Water Requirement) refers to sheets
in the spreadsheet; sheets are accessed using the tabs at the
bottom of the spreadsheet window.
Daily Water Requirement
The first step in a design is to determine the total
amount of water needed per day. Many producers are
used to thinking of pumping lots of water in a short
time frame with large-capacity pumps. Solar pumping,
like windmills, will pump water at slower flow rates
(gpm) over a longer time.
Water/Day
= Quantity × required gallons
Eq.
Item
of water per day per item
1
Gallons of
Storage Tank Capacity
Depending on climate and usage, storage tank capacity
should equal 3 to 10 days of water use. For domestic
use in a cloudy climate, 10 days may be necessary, while
See Foster et al. (2010) for a more complete pump and PV discussion.
PV mounts may be fixed racks or poles, or some type of tracking system that follows the sun.
11
See your NMSU county Extension agent for more information.
12
Contact your county Extension agent for information on estimated evapotranspiration rates for your area.
9
10
Circular 670 • Page 6
Table 2. Selected Example Amounts of Water Per Day for
Various New Mexico Livestock
Required amount
of water per day
Item(gallons/day)
Nursing Cow
17.5
Bred Dry Cows and Heifers
14.5
Bulls19.0
Horses
15.0
Sheep2.0
Humans
75.0*
*For drinking, cooking, bathing, etc.
in sunny climates such as New Mexico, 3 days of storage for livestock watering may be sufficient. The storage
tank size is calculated by multiplying the days-of-storage
requirement by the daily water requirement and is provided as a reference only.
Solar Resource
Once the daily water requirement is calculated, the solar
resource—“insolation,” or total sunlight reaching a specific location—is determined. Sunlight will provide the
energy, via the PV modules, to run the pump, and sunlight value is determined by the nearest latitudinal coordinate of the well location (between 31 and 37° in New
Mexico). When you insert this value, the spreadsheet
determines the solar insolation for winter, summer, or
a yearly average. It is recommended to use winter values since winter has the least amount of sunlight per
day and it is best to design for the worst-case scenario.
Nevertheless, you can choose to use the summer insolation value if you plan to water a summer-only pasture.
A good rule of thumb is that the solar resource must be
greater than 3.0 kWh/m2 per day (3,000 watt-hours per
square meter of area in one day) for choosing a solar
option13.
Pumping Requirements
Total dynamic head (TDH) is the total “equivalent”
vertical distance that the pump must move the water,
or the pressure the pump must overcome to move the
water to a certain height. Water pressure is expressed in
pounds per square inch (psi) and is defined as the force
caused by the weight of water in a column of a certain
height, also known as “head.” Head is a term relating
feet of water in a column that exerts a certain pressure;
13
14
for example, a column of water 10 ft high would exert
10 ft of head, or 4.3 psi (pressure). Knowing head, you
can determine pressure and vice versa. Head is important to determine how hard the pump must work to
move water from the source to a discharge point (i.e., to
overcome the equivalent pressure of that water).
Static head is a major part of TDH and refers to the
total vertical lift (distance) from the water level in the
well to the discharge level. Static head is composed of
the water depth in the well at its lowest seasonal and
draw-down levels plus the elevation from the water
surface to the discharge point14. Entering these values,
static head is calculated by Equation 2.
Static Head (ft) or Total Vertical Lift =
water level + draw-down + elevation Eq. 2
Pumps may be submersed in a well as deep as necessary to ensure reliable water supply (taking into account
drawn-down levels, seasonal variations, and recharge
rates). The water level variable in Equation 2 is measured from the water surface to the level of the water
in the source—not the depth location of the pump.
Placing the pump lower in the well (increasing its
submergence) will NOT cause it to work harder or to
pump less water, nor will it increase stress or wear on
the pump. However, there are reasons to NOT set the
pump too close to the bottom of the well:
1. A deep setting will increase cost, length, and weight
of pipe and cable.
2. A setting near the bottom may increase the chance
of sand or sediment being drawn into the pump and
damaging the pump mechanism.
The pump must move the water from the well to an
elevation, but it must also overcome friction losses in
the system. These losses depend on the type of pipe (its
roughness), total length of pipe including any horizontal
runs, flow rate (speed) of the water in the pipe, fittings
and joints, and pipe diameter. These friction losses,
which are expressed in equivalent lengths of vertical pipe
distance, are added to the static head to yield an equivalent TDH—i.e., what equivalent height would the
pump need to move water given these values.
To determine friction losses in pipe, you should enter
(in the Total Dynamic Head tab of the spreadsheet) the
All areas of New Mexico meet this limit with values well above 5 kWh/m2 per day. New Mexico climate website (http://climate.nmsu.edu) has good historical
solar, wind, and temperature data.
Draw-down is the level of water that may drop in the well as pumping occurs—the well pipe is refilled at a recharge rate. The low flow rates of solar systems
have less negative impact on draw-down.
Circular 670 • Page 7
type of pipe (PVC, steel, etc.), total length of the pipe
being used, and the nominal inside diameter of the
pipe. The approximate head loss (HL) caused by friction
within the pipe is calculated using the Hazen-Williams
Empirical formula with assumptions of mediocre water
temperature and somewhat turbulent pipe flow. The value generated is in units of “feet of head” (Mott, 2006).
Equation 3 illustrates the Hazen-Williams formula.
Q1.852
10.472
Eq.
3
HL =
×
× L
4.871
C1.852
D
The roughness coefficient variable C within the equation depends on the type of pipe, but the roughness coefficient is typically around 140. Q is the flow rate in gpm,
D is the nominal inside diameter of the pipe in inches,
and L is the total length in feet of the pipe for the system.
Another standard “rule of thumb” is that friction losses in
the pipe are typically 2–5% for a well-designed system.
The friction loss due to fittings must also be calculated.
The friction losses for pipe fittings are converted to an
equivalent length of pipe (in feet) and are a function of
several variables. Losses due to fittings may be significant.
To determine these losses, the spreadsheet lists many
common fittings that might be utilized within the design
of the system, and you should enter the quantity of each
fitting used in your system. The equivalent friction loss
for each fitting type is calculated using Equation 4.
Table 3 shows a partial listing of some values used to
calculate friction loss due to a fitting.
Equivalent Length (ft) = (pipe diameter
× quantity × L/d) / 12Eq. 4
The equivalent head pipe friction loss values are calculated for each specific fitting used. These are then
summed to give a total loss due to fittings (Mott, 2006).
TDH can now be calculated by using Equation 5.
Total Dynamic Head (ft) = Static Head
+ HL + Friction Loss Due to Fittings Eq. 5
Example of a TDH Calculation:
What is the TDH in a well with water depth of 150 ft (no
draw-down) and flow rate of 4 gpm? The well is 80 ft from
the storage tank, and the delivery pipe rises 8 ft to discharge
into a tank. The piping is 0.75-in. diameter PVC, and there
are three 90° elbows, one swing-type check value, and one
gate-type valve in the pipe.
Solution: From Table 3, the three 90° elbows add the
equivalent of 5.625 ft of pipe, the check valve 8.4375 ft,
and the gate valve 0.56 ft, giving a total equivalent pipe
length head of 14.6 ft (rounded to the nearest hundredth)
due to fittings losses. The total length of pipe is 150 (well
water depth) + 80 (distance from well to storage tank) +
Table 3. Examples of Equivalent Length in Pipe Diameter
(L/d) of Sample Pipe Fittings
Pipe Fitting
Globe valve, fully open
Gate valve, fully open
90° standard elbow
Swing check valve
Standard tee, flow through branch
L/d (inches)
275
9
30
135
60
8 (distance from surface discharge to tank) = 238 ft. From
the HL calculation (Equation 3), 100 ft of 0.75-in. pipe
at 4 gpm has a pressure drop of 4.9 ft/100 ft of tube,
which yields 4.9 × 238 / 100 = ~11.74 ft.
The water must be lifted 150 + 8 = 158 ft (static
head); therefore, TDH (Equation 5) is 158 + 11.74 +
14.6 = ~184 ft.
Hydraulic Workload
Oftentimes, we may work in units other than gallons
and feet. One U.S. gallon is equal to about 0.0037854
cubic meters, while 1 foot of distance is equal to about
0.3048 meters. If we convert TDH from feet to meters and the daily water volume from gallons to cubic
meters, then we can calculate something called the
hydraulic workload (Equation 6), which is an excellent
indication of the power that will be required to meet the
designed system constraints.
Hydraulic Workload (m4) = Daily Water
Volume (m3) × TDH (m)Eq. 6
If the hydraulic workload is less than 1,500 m4, then
the project is a good candidate for solar PV. If it is between 1,500 and 2,000 m4, it will be borderline. If the
hydraulic workload is greater than 2,000 m4, you may
need to consider other options.
Pump and Flow Rate
The flow rate (gpm) is the volume of water that is
pumped in a set time period and is determined via
Equation 7.
Total Daily
Water Requirement
Eq.
Flow Rate (Q) =
7
Total Daily Solar
Insolation × 60 min
hr
In the Pump Selection tab of the spreadsheet, you
are shown the calculated Q and TDH. Using these two
key values, you must manually choose a specific pump
(from an initial limited selection) that will be capable
of pumping water at the necessary Q and TDH. Once
a pump is selected, we determine at what voltage this
pump will operate (12 V, 30 V, etc.) and how much
Circular 670 • Page 8
power (watts) is required to run this pump assuming
standard pump efficiency (η ~35%). This is the power
that de-rated15 PV modules must supply to operate the
pump. Pump power can often be looked up in pump
tables, but it can a lso be determined by Equation 8.
Pump Power (W) = (0.1885 × TDH × Q) / η
Eq. 8
PV Determination
The Array Sizing spreadsheet tab involves the automatic
sizing of the PV array given the calculated and manually selected pump parameters. The first calculation
performed is to determine the number of PV modules
in series—a string. Each PV module has an operating output current and voltage. Connecting modules
in series increases the total voltage to match or exceed
the required pump motor voltage (determined earlier).
Equation 9 illustrates this, while Equation 10 describes
how the PV strings may be connected in parallel to
increase total current and thus total power to match
or exceed the required pump’s power (also determined
earlier). Voltage multiplied by current determines total
power provided by the PV array in watts (or converted
to horsepower, HP). NOTE: It is possible that there will
only need to be a single module or modules only in series and not in parallel.
In Equation 9, the 17.4 V value represents the operational voltage for our PV module.
Eq.
Modules in Series
Pump’s Motor Voltage
9
(rounded to higher integer) =
17.4 V
In Equation 10, the 3.11 A represents the PV panel’s
rated current (at standard operating conditions) and the
0.80 value represents the de-rating factor.
Number of PV Strings
Pump’s Peak Panel Wattage
=
in
Parallel
(integer)
(Modules in Series × 17.4 V
× 3.11A × 0.80)
Eq. 10
NOTE: These values are for a pre-selected example PV
module. If other size PV modules are selected, then the
values must be changed to reflect those modules’ voltage
and current.
Because we round up the number of strings and parallel combinations to whole numbers, the total amount
of energy and therefore water pumped will be greater
than our daily requirements on any full sunny day. This
is typically not an issue when float switches are incorporated into storage systems, which will stop the pumping
when the tank is full. Excess power produced by solar
panels can be used for cathode protection, to aerate a
dugout, or to power an electric fence.
15
The estimated total daily water pumped (gallons/day)
on a full sunny day can be found by Equation 11:
(#Modules × Module Volts × Module Amps ×
hr
min
Daily Insolation
× 60
× Pump Efficiency %
day
hr
× Module derating factor %)
≈
(0.1885 ×TDH)
Eq. 11
Final Design Specifications
The Design Specification spreadsheet tab summarizes the
design values obtained through the use of the spreadsheet and lists the key components and materials for
this scenario’s direct-coupled solar water pumping system. The description and quantities for specific items
are obtained from calculations or specified by you. The
cost for each itemized component is calculated by multiplying the quantity of each item by a representative
retail price, but prices will of course vary over time. The
necessary length of UF wire is roughly determined by
the length of pipe plus an extra 25%. The market price
for the UF wire is for 250-ft rolls. Pipe is assumed to
be PVC and the price is calculated by dividing the total
length of needed pipe by 10 (PVC pipe is typically sold
in 10-ft lengths) and multiplying by its market price.
The grand total of the entire system (not including the
well, labor, storage, etc.) is calculated by adding up all
the itemized totals. This will reflect an approximate cost
to construct the system plus the costs of other materials, labor, sales taxes, shipping, etc. Federal and state tax
incentives may lower the initial costs by up to 40% (as
of 2012).
CONCLUSION
Using the spreadsheet allows you to test various design
scenarios and demonstrate the design method and terminology for a direct-coupled solar water pumping system. It is important to consider the limits of this spreadsheet because it is only able to calculate for flow rates
up to ~4 gpm and TDH values no greater than ~230 ft
due to the very limited PV and pump selection options
within this version. In the case of design values outside
these limits or for pumps or PV module choices not
available within the spreadsheet, you should reference
alternative performance data provided by other pump
or PV manufacturers. We hope that later versions of this
spreadsheet will address several of these issues.
Photovoltaic-powered water pumping systems are
attractive for livestock and agricultural producers with
remote water sources and limited access to AC power.
De-rating takes into account temperature and soiling effects on the modules.
Circular 670 • Page 9
Even though wind has been in use for decades and will
continue to provide effective solutions for water pumping, solar power has made significant steps toward becoming the system of choice for these situations. Solar
systems’ low maintenance and simple operation, lack
of fuel (transportation or storage) costs, environmental
friendliness, and competitive life-cycle economics place
them at the forefront of choices for supplying water to
livestock or agriculture. The technology for solar water
pumping is exceeding all expectations, and will continue to be a viable choice for more and more users as
its capabilities, reliability, and versatility increase while
costs decrease.
The spreadsheet, documentation, and demonstration
modules provide you with terminologies, knowledge,
and skill sets that can be the foundation for informed
choices relating to alternative water pumping systems.
For additional information, contact your county
Cooperative Extension agent or NMSU.
Thomas Jenkins has been a
professor in NMSU’s Department
of Engineering Technology and
Surveying Engineering since 1990.
He previously worked for many
years in both private and public
sectors as a computer scientist and
engineer. Professor Jenkins lead
the effort to develop the College of
Engineering Renewable Energy
Technology minor and helped establish the NMSU student organization Engineers Without Borders.
ACKNOWLEDGMENTS
The author wishes to express extreme gratitude for
the assistance of the following:
College of Engineering and Engineering NM
http://engr.nmsu.edu/index.shtml
NMSU Cooperative Extension Service
http://extension.nmsu.edu/
New Mexico Space Grant Consortium
http://www.nmspacegrant.com/
Southwest Technology Development Institute
http://www.nmsu.edu/~tdi/
LITERATURE CITED
Bartlett, B. n.d. Watering systems for grazing livestock
[Online]. Available from http://www.msue.msu.edu/
objects/content_revision/download.cfm/
revision_id.557516/workspace_id.213590/
Watering%20Systems%20for%20Grazing%20
Livestock.pdf
Boyle, G. 2004. Renewable energy. Oxford: Oxford University Press.
Buschermohle, M., and R. Burns. n.d. Solar-powered
livestock watering systems [Online]. Available from
https://utextension.tennessee.edu/publications/
documents/pb1640.pdf
Foster, R., and A. Ellis. 2003. Renewable energy for
water pumping applications in rural villages [Online;
NREL/SR-500-30361]. Available from http://www.
nrel.gov/docs/fy03osti/30361.pdf
Foster, R., M. Ghassemi, and A. Cota. 2010. Solar
energy: Renewable energy and the environment. Boca
Raton, FL: Taylor & Francis Group.
Masters, G.M. 2004. Renewable and efficient electric
power systems. Hoboken, NJ: John Wiley & Sons, Inc.
Morris, M., and V. Lynne. 2002. Solar-powered livestock watering system [Online]. Available from
http://www.clemson.edu/sustainableag/
IP217_solar_livestock_watering.pdf
Mott, R.L. 2006. Applied fluid mechanics (6 ed.).
Upper Saddle River, NJ: Pearson Prentice Hall.
National Renewable Energy Labs. 1997. Electricity
when and where you need it: From the sun: Photovoltaics for farms and ranches [Online; NREL/
BR-412-21732]. Available from http://www.nrel.gov/
docs/gen/fy97/21732.pdf
NMSU Water Task Force, various publications. Available at http://aces.nmsu.edu/ces/watertaskforce/
index.html
Pfost, D., J. Gerrish, M. Davis, and M. Kennedy. 2007.
Pumps and watering systems for managed beef grazing [Online]. Available from http://extension.
missouri.edu/p/EQ380
Surber, G., K. Williams, and M. Manoukian. n.d.
Drinking water quality for beef cattle: An environment friendly & production management enhancement technique [Online]. Available from http://
animalrangeextension.montana.edu/articles/
natresourc/Drinking%20Water%20Quality%20
for%20Beef%20Cattle.pdf
Wiles, J. 2001. Photovoltaic power systems and the National Electrical Code: Suggested practices [SAND870804]. Albuquerque, NM: Sandia National Laboratories.
Department of Engineering Technology and
Surveying Engineering
http://et.nmsu.edu/
Circular 670 • Page 10
Circular 670 • Page 11
Disclaimer: This document is intended for educational purposes only in providing a basic understanding of
terminology and concepts of design. It is not intended to be used beyond this purpose. The authors incorporated
good analysis, but all situations are different and you should consult a professional in all cases.
Contents of publications may be freely reproduced for educational purposes. All other rights reserved. For permission to use
publications for other purposes, contact [email protected] or the authors listed on the publication.
New Mexico State University is an equal opportunity/affirmative action employer and educator. NMSU and the U.S. Department
of Agriculture cooperating.
October 2013
Las Cruces, NM
Circular 670 • Page 12