1
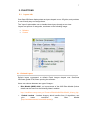
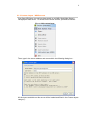
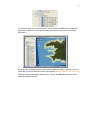
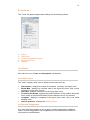
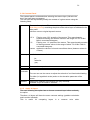
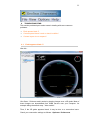
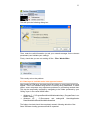
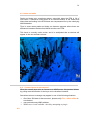
1
Geo-Seas
Pan-European infrastructure for management
of marine and ocean geological and
geophysical data
D11.5 – Part B
Geo-Seas 3D viewer end-user manual
for Geo-Seas DTM prototype
Organisation name for lead contractor for this deliverable: [SHOM]
Project acronym: Geo-Seas
Project full title: Pan-European infrastructure for management of marine and ocean geological and
geophysical data
Grant Agreement Number: 238952
Start date of project: 1st May 2009
Co-ordinator:
2
Deliverable number
Short Title
D11.8
Geo-Seas 3D viewer end-user manual
Long Title
Geo-Seas 3D viewer end-user manual for the Geo-Seas DTM prototype
Short Description
This document describes the functionalities of the 3D viewer developed for the viewing services
associated to the DTM demonstrator and according to the Geo-Seas methodology (D11.4). This
manual aims to guide end users through: a) installing the tool, b) features of the 3D viewer, and c)
accessing help if required.
Keywords
DTM, 3D viewer, demonstrator
Authors / Organisation(s)
Editor / Organisation
E. Moussat, Ifremer
H. Glaves (NERC-BGS)
File name
GS_WP11_D11-5B_GEO-SEAS_3DViewer_End-user_Manual_v0.2.doc
Deliverable due date
Deliverable submitted date
Month 38
Month 38
Comments
History
Version Author(s)
Status
Date
001
E.Moussat Ifremer
DRAFT
002
G Sutton
DRAFT
25-06-2012
Minor amendments
003
E.Moussat
FINAL
26-06-2012
Minor amendments
19-06-2012
Comments
Circulated for comment
Dissemination level
PU Public
CO Confidential, for project partners and the European Commission only
X
3
Summary
1.
INTRODUCTION.............................................................................................. 4
1.1.Overview........................................................................................................ 4
1.2. Prerequisites................................................................................................. 5
1.3. License and download .................................................................................. 6
1.4. Installation .................................................................................................... 6
1.5. About this document ..................................................................................... 6
2. FUNCTIONS .................................................................................................... 7
2.1. Layers tab ................................................................................................. 7
2.1.1. Default Layers.................................................................................... 7
2.1.2. Custom Layers : WMS servers .......................................................... 8
2.2. Tools tab ................................................................................................. 10
2.2.1.Effects ................................................................................................... 10
2.2.2. Other Layers ........................................................................................ 10
2.2.3.Vertical exaggeration ............................................................................ 10
2.2.4.Measurement tool ................................................................................. 12
2.2.5.Settings ................................................................................................. 13
2.3. Terrain tab .............................................................................................. 15
2.3.1. DTM and texture Loading ................................................................ 15
2.3.2. Terrains menus................................................................................ 18
2.3.3. Differences between DTM and texture files ..................................... 18
2.3.4. Contrast Panel ................................................................................. 20
2.3.5. Apply all layers................................................................................. 20
3. MENUS .......................................................................................................... 21
4. TROUBLESHOOTING ................................................................................... 22
4.1. Earth appears blank !? ........................................................................ 22
4.2. Data layer is invisible and a hole appears instead............................... 23
4.3. Holes and walls ................................................................................... 24
4.4. Custom layers do not respond............................................................. 24
4.5. Application crash..................................................................................... 25
4.6. Helpdesk ................................................................................................. 25
4
1. INTRODUCTION
1.1.Overview
The Geo-Seas-3D Viewer is a geographical 3D Viewer, providing an
innovative and high-performance 3D viewer for data types such as Digital
Terrain Models (DTM) and Web Map Service (WMS) which are plugged into a
virtual globe.
It has been designed for the purposes of :
•
•
•
in-depth evaluation of dataset content to assess the quality of a DTM
(resolution, coverage, quality) using basic GIS functionalities,
combining data layers such as sample location, sediment properties etc.
Using WMS from other data sources to assist end-users searching for
data or analysing interactions between processes on the seabed or
between the water column and topographic features.
demonstrating the concept of making this type service available to endusers without them requiring specific skills to install or to use the service.
It
is
a
declination
of
SonarScope
3DViewer
(http://www.ifremer.fr/fleet/acous_sism/sonarscope/SSC3D.html)
which
is
primarily aimed at displaying DTM and water column data, such as bubbles
and other features detected by SonarScope algorithms.
The following attributes should be noted:
• DTM elevation and resolution are properly rendered, rather than
5
•
•
•
•
•
•
consisting of a simple image draped over the software’s own DTM, as
would be the case e.g. for a GoogleEarth export (in Public Version).
Vertical exaggeration can be adjusted up to a maximum of 20 times
which is expected to suffice for most sea floor representation.
A variety of different georeferenced scientific data themes
(oceanography, geology, etc.) that can be downloaded from WMS
server are viewable.
The Geo-Seas 3D viewer has been specifically designed to allow quick
and easy 3D viewing of DTMs distributed using the NetCDF transport
format specified and adopted by the European Geo-Seas infrastructure
(http://www.geo-seas.eu/ ).
Bathymetric grids of the European Seas produced in the framework of
the Hydrography and Seabed mapping preparatory actions of the
European Marine Observation and Data Network (EMODnet)
http://www.emodnet-hydrography.eu/ can be downloaded in the GeoSeas transport format and also viewed using the 3D Geo-Seas viewer.
Grids in such format can be produced using Generic Mapping Tool
(GMT) and scripts developed specifically for these purposes (see
http://www.geo-seas.eu/ for downloading) or various softwares such as
Caraibes or Sonarscope (http://flotte.ifremer.fr/fleet/Presentation-ofthe-fleet/On-board-software).
Geo-Seas 3DViewer is a complete standalone application based on
NasaWorldWind technology and associated 3D engine. It is developed
in Java, and available on all platforms runnning NasaWorldWind.
1.2. Prerequisites
Geo-Seas - 3Dviewer is visual and graphic software which relies on the
hardware capabilities of the user’s PC in order to function optimally.
Sometimes the application may encounter problems when integrating DTM
Files or at times the rendering may not be optimal (data quantification for
example).These effect are most likely to occur if the machine has an old or
outdated Graphic Process Unit (recommended configuration: 2007 or never
Nvidia or ATI cards) or the driver is not updated.
Recommendations from the NASA as follows:
•
•
some information about configurations can be obtained from:
http://worldwind.arc.nasa.gov/java/
how to update the driver : http://worldwind.arc.nasa.gov/java/video.html
The
viewer
works
with
Windows
32
and
64
bits.
The Linux version does not have wizard installers and has not been subject to
advanced tests.
The viewer requires Java 1.6.
In 32 Bits configuration, 1 Go RAM and in 64 bits, 4 Go are recommended.
Successful tests were performed with DTM below 300 Mo. The upper limit is
not precisely known but problems can occur when loading the MNT, especially
when tiling.
6
1.3. License and download
The 3D viewer is freely available for general use provided the user has
registered in Geo-Seas portal: /http://www.geo-seas.eu/. and has accepted
conditions of use. Users may then download a copy of the 3D viewer directly.
1.4. Installation
The complete installation of GeoSeas viewer is managed by a setup wizard.
The version of this setup depends on your system version (32 Bits or 64 Bits).
It installs elements in the directory you’ve choosen during the installation :
- Java dll,
- Uninstallation item,
- Libs directory,
- And GeoSeas Viewer executable (as a shareware).
1.5. About this document
This document describes all the functionalities available in Geo-Seas
3DViewer. It is adapted from the help section in the software which has been
designed to mimic the graphical behaviour of the software window.
7
2. FUNCTIONS
2.1. Layers tab
Geo-Seas 3DViewer displays data as layers draped over a 3D globe, and provides
a user-friendly way to manage these.
The "layers" tab enables user to handle these layers through a tree view.
Layers are split into 2 categories, as shown on the following image :
•
•
Defaults
Custom
2.1.1. Default Layers
Default layers correspond to default Earth images draped over Geo-Seas
3DViewer global DTM, when opening the software.
Users can choose between two type of images :
•
Blue Marble (WMS) 2004 : an improvement of the 2002 Blue Marble (further
details can be found on the following Nasa’s website
http://earthobservatory.nasa.gov/Features/BlueMarble/BlueMarble_history.php
•
iCubed Landsat : Landsat imagery which benefits from i3 algorithms, can
give
better
resolution
than
Blue
Marble
(http://worldwindcentral.com/wiki/Landsat).
8
2.1.2. Custom Layers : WMS servers
Geo-Seas 3DViewer can retrieve data stored on a WMS (World Map Server)
cartographic data server. To access one of those servers, proceed as follows :
file >> Add custom layer
Then, type in the server address and name within the following dialog box :
All the layers available on this server will be loaded and filled in the Custom layers
category :
9
For instance, here are some data from French Geolittoral WMS server displayed
within the Software SonarScope-3DViewer (the result is the same in Geo-Seas
3DViewer ):
NB: If an error message occurs warning about WMS connection, then you need to
check that you have used the correct input options in Menu Options-->Preferences
.
There are many cartographic data servers. Ifremer and BRGM servers are given
used as examples for test.
10
2.2. Tools tab
The "Tools" tab gathers parameters settings for the following effects:
•
•
•
•
•
Effects
Other tools
Vertical exaggeration setting
Measurement tool
Settings
2.2.1.Effects
User can turn on or off star and atmosphere visualisation
2.2.2. Other Layers
The "other" category allow user to display several tools such as :
•
•
•
•
•
•
Place names : displays the name of continents, countries, and major cities.
World Map : displays an overview map in the upper left corner, with a cross
indicating current point of focus.
Scale bar : displays a scale bar on the lower right corner
Terrain Profile Graph : displays the profile Elevation of the medium horizontal
line or swap to the profile Elevation from the Measure tool if it is selected.
Compass : displays a compass in the upper right corner, with a red arrow
heading north.
Lat/Lon graticule : displays the MGRS graticule
2.2.3.Vertical exaggeration
Geo-Seas 3DViewer enables a user to apply vertical exaggeration to different
layers. Vertical exaggeration can be applied up to 20x which should suffice for
most sea floor representation
11
Without vertical exaggeration
With vertical exaggeration set to 20x
12
2.2.4.Measurement tool
The measurement tool can be used to retrieve the distance between two points
on the spheroid.
This tool is activated once you have checked the corresponding check box. The
user can point to profiles by clicking simultaneously on "P" key and click in the
Main Panel.
The pointer then changes to a cross, and user can left-click points anywhere on
the globe.
13
When "P" is released, the user can change the position of one point of the path
by left clicking on it and drawing it to a new position. The same with "Alt" pressed
will result in the translation of the path.
The measure gives the approximate orientation and direct lengths of the
segments.
Once the measuring process is finished, you can export the Elevation profile as a
csv file (Comma Separator Value readable by Excel) by clicking on the Export
Profile button.
To erase and redo the measure, just uncheck and recheck the check box.
2.2.5.Settings
The group of three buttons located on top of the tool panel gives access to the
following functionality:
14
•
Reset the view point : Reset azimuth and elevation angles to their default
values (i.e Az = 0°, El = 90°).
•
Go to a location : Centre the view point onto a specific location whose
coordinates (in decimal values) are input by user, through the following
dialog box :
•
Display transparency manager : - (disabled in the current version) display sliders controlling layer transparency in front of each layer within the
tree view (moving slider to the left will set the corresponding layer totally
transparent) : see also.
15
2.3.
Terrain tab
The "Terrain" tab displays a tree view of all the DTM loaded by user.
Only DTM data files in the NetCDF transport format specified and adopted by
the European Geo-Seas infrastructure (http://www.geo-seas.eu/ )can be viewed
using the version 1.0.
MNT Files are CARAIBES format Files which contain Depth data associated
with Lat/Long coordinates. When reading a MNT file, the NWW library
processes it by tiling and creating a pyramid multi-resolution in data cache
folders of NWW. Two types of cached files are created :
•
"_elevation" files contain DTM data
•
_"texture" files contain image data, which is draped over DTM data
2.3.1. DTM and texture Loading
User can load a DTM through the file menu :
File >> Open
The following file browser appears.
Note : multiple selection is allowed.
16
If the user has already loaded this data, a pop-up prompts you to load data
directly data from the cache without tiling it. If the user responds negatively, the
tiling process is called and erases the cache data.
The User can choose to gather these files under one of the previously loaded
group of files through the "Existing macro layer" listbox, or create a "new macro
layer" (i.e. a group of files) whose name is to be typed in.
By checking the "Apply this choice for all layers" checkbox, the software won't
prompt the user to choose a macro layer for next files, in case of a multiple file
loading.
17
Finally, Geo-Seas 3DViewer displays a tree view of the DTM data file within the
"Terrain" panel, and automatically zooms to the DTM :
18
2.3.2. Terrains menus
Terrains are directly visible in the browser layers.
The user can rapidly access a layer that has been loaded by right-clicking on it :
He can remove one or more layers from the browser (but not a macrolayer) by
right-clicking on the selected layer and selecting “delete” as below:
2.3.3. Differences between DTM and texture files
The following routine is given in order to underline and illustrate the differences
between DTM data and texture files. We will see this though manipulating the
attributes of each layer :
Firstly please note that :
•
"_elevation" (icon layer ) files contain DTM data, so you can adjust Vertical
Exaggeration in Tab Tools.
•
_"texture" (icon layer ) files contain image data, which is draped over DTM
data : so Contrast Panel effects can be adjusted.
19
20
2.3.4. Contrast Panel
The contrast panel is activated when selecting the texture layer (clik twice the
box if the panel does not appear).
The user can then dynamically modify the contrast of a given texture using the
following filters:
Contrast:
There are four options . The contrast is computed on the tiles (cf. Nasa World
Wind tiling process) containing the pixels of the active layer as indicated in the
main panel.
min/max return to original dynamic texture
0.5 %
Filtering on a 0.5% quantile of the texture. This approximately
equates to filtering out extreme values in the range of 0.5% of Min /
Max in cumulated histogram.
1%
Filtering on a 1 % quantile of the texture. This approximately equates
to filtering extreme values in the range of about 1% of Min / Max in
cumulated histogram.
custom applies the values of min and max sliders above (between values in
cursors)
Colormap
list of colors tables available :
jet
catherine
gray.
Invert
Reverse color map selected
Sun
Illuminatio
n
Interactive dynamic illumination/shading.
The user can use the mouse to adjust the azimuth of sun illumination/shading.
The slider (in logarithmic scale) works on the elevation parameter of the
texture.
Gradient
Displays the gradient of the texture in a gray colormap.
Available only if the shade is selected.
2.3.5. Apply all layers
The user choosing this option has to choose a textural layer before activating
the option.
Therefore, all layers will have the same contrast settings (gradient calculation
and inversion included).
This
is
useful
for
comparing
layers
in
a
common
color
table.
21
Example : Color Map on Banc du Four
Color Map : Jet
ColorMap : catherine
ColorMap : grey
Invert Jet ColorMap
1% Contrast on Jet ColorMap
SunShading on
Gradient
3. MENUS
Move the cursor over the figure below, and click on the item to reach
corresponding help section :
Once 3DViewer is open, you can expand the full application by clicking on the
button.
The general Menus appear as follows :
22
4. TROUBLESHOOTING
This section provides tips to assist users in dealing with some common
problems :
•
•
Earth apears blank !?
Contrast panel doesn’t work or data is invisible !
•
Custom layers do not respond !
4.1. Earth appears blank !?
Like this :
Geo-Seas - 3Dviewer mainly works by draping images over a 3D globe. Most of
these images are downloaded from WMS servers onto your computer. An
example being the default map : "blue marble".
Thus, if the 3D globe appears blank, it may be due to a connection issue.
Check your connection settings as follows : Options > Preferences
23
This will open the following dialog box :
Then, enter the valid information (or ask your network manager for the relevant
parameters) and validate your settings.
Finaly, check that you are not working off line : File > Work offline
This usually solves the problem.
4.2. Data layer is invisible and a hole appears instead
After loading a DTM layer, the data should be visible. In some cases a hole may
appear. This is an identified bug which is currently being addressed. In some
cases, some computers may experience problems in processing cached data.
This can be temporarily resolved by navigating to the folder produced by your
"failing" layer in the cache NWW folder :
•
•
Windows 7 : C:\ProgramData\WorldWindInstalled\tmp (ProgramData is an
hidden folder),
Windows XP : C:\Documents and settings\All Users\Application
Data\WorldWind\Earth\WorldWindInstalled.
The folders involved should be completely erased, following which the GeoSeas 3DViewer loading process should be repeated.
24
4.3. Holes and walls
Peaks and holes may sometimes appear, especially when the DTM is full of
non-values. It should be noted that it is an inherent feature of the viewer that
where data are lacking in the DTM these are compensated for by the underlying
NASA datasets.
Thus in some cases peaks and holes can become apparent where there are
differences between the data from NASA and the user DTM.
This issue is currently under review, and it is anticipated that a solutions will
appear in the next software release.
4.4. Custom layers do not respond
When the custom layer tries to connect to a WMS server, this process initiates
by pulling meta-information for the layer to be visualised visualise.
Sometimes an error message may appear in one of the following situations:
•
•
•
4.5.
Geo-Seas 3DViewer is disconnected , please verify File--> Work offline is
not checked
user entered wrong WMS address,
WMS server is not available : check by attempting to ping it .
25
Application crash
Very few random crashes of the 3D viewer application have been reported. If this
does occur then you may not be able to simply close-out of the application. You will
need to exit the application as follows:
Use the task manager to kill the java.exe process associated with the GeoSeas 3D
viewer.
The viewer can now be re-launched. Please report the case to the helpdesk.
4.6. Helpdesk
In case of anomalies, please send an email to the GeoSeas “contact” on
http://www.geo-seas.eu/.