1
Analyzing Crash Dumps
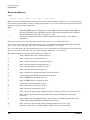
Stack Tracing Tricks
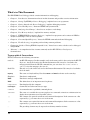
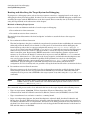
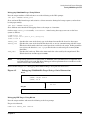
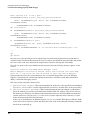
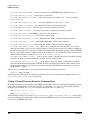
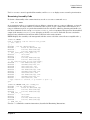
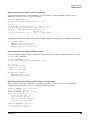
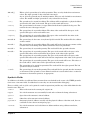
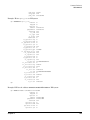
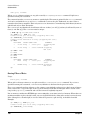
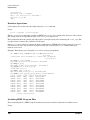
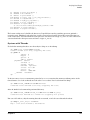
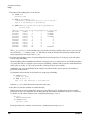
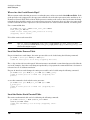
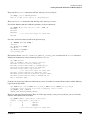
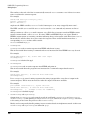
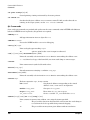
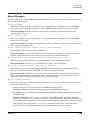
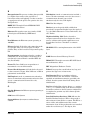
#11 0xc07f0 in skip_int_save_crs2_0+0x38 ()
#12 0x2cb858 in idle+0x5a0 ()
processor 2 claims to be idle
Event selected is 3. It was a TOC
#0
#1
#2
#3
#4
#5
#6
#7
#8
#9
#10
0x48ea8 in iodc_mfctl+0x24 ()
0x48654 in iodc_wait_n_msec+0x94 ()
0x82894 in kgdb_lan_lasi_ready_check+0x84 ()
0x82cdc in kgdb_lan_lasi_attention+0x44 ()
0x82d78 in kgdb_lan_lasi_read+0x88 ()
0x72cc8 in kgdb_do_poll+0x30 ()
0x7fef10 in clock_int+0x88 ()
0xac934 in mp_ext_interrupt+0x394 ()
0x7be74 in kgdb_pre_int+0x154 ()
0xc07f0 in skip_int_save_crs2_0+0x38 ()
0x2cb72c in idle+0x474 ()
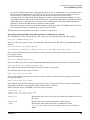
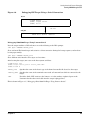
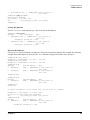
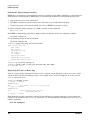
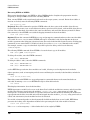
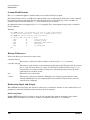
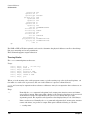
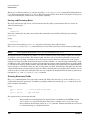
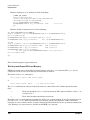
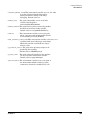
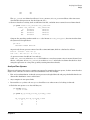
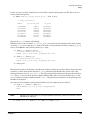
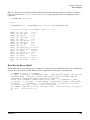
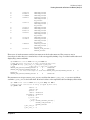
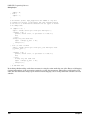
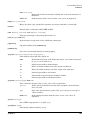
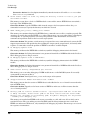
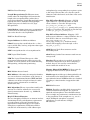
processor 3 claims to be idle
Event selected is 2. It was a TOC
#0
#1
#2
#3
#4
#5
#6
#7
#8
#9
q4>
0x48658 in iodc_wait_n_msec+0x98 ()
0x82894 in kgdb_lan_lasi_ready_check+0x84 ()
0x82cdc in kgdb_lan_lasi_attention+0x44 ()
0x82d78 in kgdb_lan_lasi_read+0x88 ()
0x72cc8 in kgdb_do_poll+0x30 ()
0x7fef10 in clock_int+0x88 ()
0xac934 in mp_ext_interrupt+0x394 ()
0x7be74 in kgdb_pre_int+0x154 ()
0xc07f0 in skip_int_save_crs2_0+0x38 ()
0x2cb72c in idle+0x474 ()
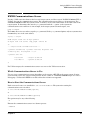
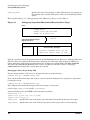
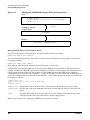
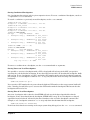
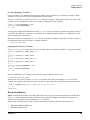
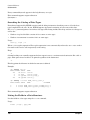
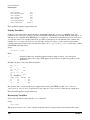
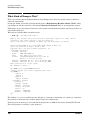
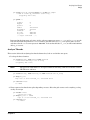
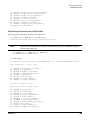
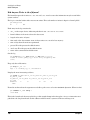
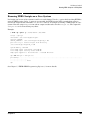
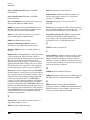
Trace Every Processor on IPF System
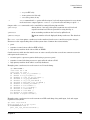
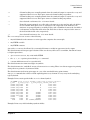
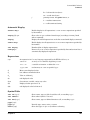
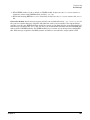
Load the processor information table and trace every processor.
q4> load mpinfou_t from &spu_info max nmpinfo
loaded 1 union mpinfou as an array (stopped by max count)
q4> pileon mpinfo_t from pikptr
loaded 1 struct mpinfo
q4> trace pile
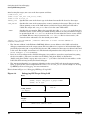
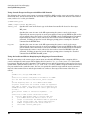
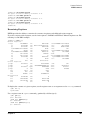
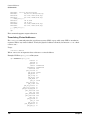
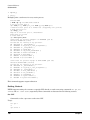
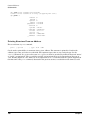
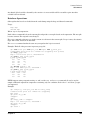
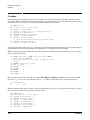
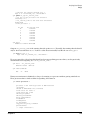
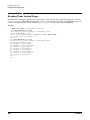
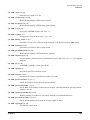
processor 0 claims to be idle
Event selected is 0. It was a panic
#0 0xe0000000002b1ac0:0 in change_stack_end+0x0 ()
#1 0xe0000000003babd0:0 in panic+0x360 ()
#2 0xe0000000003bbfe0:0 in assfail+0x50 ()
#3 0xe000000000756d60:0 in increment_callout_time+0x280 ()
#4 0xe00000000075a1f0:0 in expire_callouts+0x300 ()
#5 0xe0000000007520f0:0 in hardclock+0x130 ()
#6 0xe000000000295da0:0 in clock_int+0x7e0 ()
#7 0xe0000000003db430:0 in external_interrupt+0x300 ()
#8 0xe0000000003e7630:0 in bubbledown+0x0 ()
190
Chapter 5