1
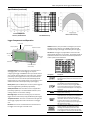
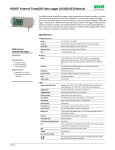
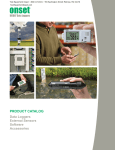
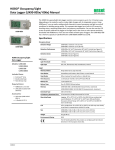
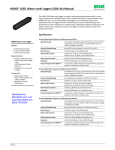
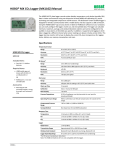
HOBO® Temp/RH 3.5% Data Logger (UX100-003) Manual
The HOBO Temp/RH data logger records temperature and relative humidity (within 3.5%
accuracy) in indoor environments with its integrated sensors. Using HOBOware®, you can easily
configure the logger alarm to trip for specific high or low sensor readings. Or, you can set up burst
logging in which the logger records data at a different interval during certain conditions. The
logger can also calculate minimum, maximum, average, and standard deviation statistics. This
compact data logger has a built-in LCD screen to monitor the current temperature, relative
humidity, logging status, battery use, and memory consumption in between readouts.
Specifications
Temperature Sensor
Range
-20° to 70°C (-4° to 158°F)
Accuracy
±0.21°C from 0° to 50°C (±0.38°F from 32° to 122°F), see Plot A
HOBO Temp/RH 3.5%
Data Logger
Resolution
0.024°C at 25°C (0.04°F at 77°F), see Plot A
Response Time
4 minutes in air moving 1 m/s (2.2 mph)
UX100-003
Drift
<0.1°C (0.18°F) per year
Included Items:
• Command™ strip
• Double-sided tape
• Hook & loop strap
Required Items:
• HOBOware 3.4 or later
• USB cable (included with
software)
RH Sensor
Range
15% to 95%
Accuracy
±3.5% from 25% to 85% over the range of 15° to 45°C (59° to 113°F)
including hysteresis; ±5% from 25% to 95% over the range of 5° to
55°C (41° to 131°F) including hysteresis, see Plot B
Resolution
0.07% at 25°C (77°F) and 30% RH
Response Time
43 seconds to 90% in airflow of 1 m/s (2.2 mph)
Drift
<1% per year typical
Logger
Logger Operating Range
Logging: -20° to 70°C (-4° to 158°F); 0 to 95% RH (non-condensing)
Launch/Readout: 0° to 50°C (32° to 122°F) per USB specification
Logging Rate
1 second to 18 hours, 12 minutes, 15 seconds
Logging Modes
Normal, burst, or statistics
Memory Modes
Wrap when full or stop when full
Start Modes
Immediate, push button, date & time, or next interval
Stop Modes
When memory full, push button, or date & time
Restart Mode
Push button
Time Accuracy
±1 minute per month at 25°C (77°F), see Plot C
Battery Life
1 year, typical with logging rate of 1 minute and sampling interval of
15 seconds or greater
Battery Type
One 3V CR2032 lithium battery
Memory
128 KB (84,650 measurements, maximum)
Download Type
USB 2.0 interface
Full Memory Download Time
20 seconds
LCD
LCD is visible from 0° to 50°C (32° to 122°F); the LCD may react slowly
or go blank in temperatures outside this range
Size
3.66 x 8.48 x 1.52 cm (1.44 x 3.34 x 0.6 in.)
Weight
30 g (1.06 oz)
Environmental Rating
IP50
The CE Marking identifies this product as complying with all relevant
directives in the European Union (EU).
16209-E
HOBO Temp/RH 3.5% Data Logger (UX100-003) Manual
Specifications (continued)
100%
Not Specified
+/- 5%
90%
80%
70%
+/-3.5%
60%
50%
40%
30%
20%
0
Plot A: Temperature
Accuracy and Resolution
10
20
30
40
50
50
60
°C
Plot C: Time Accuracy
Plot B: RH Accuracy
Logger Components and Operation
Battery Door
Alarm/Stats Button
USB Port: Use this port (not visible in the diagram) to connect
the logger to the computer or the HOBO U-Shuttle via USB
cable (see Setting up the Logger and Reading Out the Logger).
Start/Stop Button
Temperature Sensor
LCD Screen: This logger is equipped with an LCD screen that
displays details about the current status. This example shows all
symbols illuminated on the LCD screen followed by definitions
of each symbol in the table below.
Mounting
Loop
Mounting
Loop
LCD Screen
USB Port
RH Sensor (behind
louvered door)
Start/Stop Button: Press this button for 3 seconds to start or
stop logging data, or to resume logging. This requires
configuring the logger in HOBOware with a push button start or
stop, and with “Resume logging on next button push” selected
(see Setting up the Logger). You can also press this button for
1 second to record an internal event (see Recording Internal
Logger Events) or to turn the LCD screen on if the option to turn
off the LCD has been enabled (see Setting up the Logger).
LCD Symbol
The logger has been launched with a push button
stop enabled; press and hold the Start/Stop
button for 3 seconds to stop the logger. Note: If
you also launched the logger with a push button
start, this symbol will not appear on the display for
30 seconds.
Battery Door: Open the battery door on the top of the logger to
access the logger battery (see Battery Information).
Alarm/Stats Button: Use this button to clear a tripped alarm
(see Setting up Alarms) or to switch between statistics, alarm
readings, and the current sensor readings.
The battery indicator shows the approximate
battery power remaining.
The logger has been configured to stop logging
when memory fills. The memory bar indicates the
approximate space remaining in the logger to
record data. When first launched, all five segments
in the bar will be empty. In this example, the
logger memory is almost full (only one segment in
the memory bar is empty).
Mounting Loops: Use the two mounting loops to mount the
logger with the hook-and-loop strap (see Mounting the Logger).
Temperature Sensor: This sensor is located at the far right side
of the logger, slightly behind the louvered door in the logger
case.
RH Sensor: This sensor is located behind the louvered door in
the logger case to the right of the LCD screen.
1-800-LOGGERS
Description
The logger is waiting to be launched. Press and
hold the Start/Stop button for 3 seconds to launch
the logger.
The logger has been configured to never stop
logging (wrapping). The logger will continue
recording data indefinitely, with newest data
overwriting the oldest data. When first launched,
all five segments in the memory bar will be empty.
2
www.onsetcomp.com
HOBO Temp/RH 3.5% Data Logger (UX100-003) Manual
LCD Symbol
a logging interval less than 15 seconds, the data will be
recorded at the faster interval, but the sensor readings
will only be updated on the screen every 15 seconds.
Description
In this example, the memory is full (all five
segments are filled in) and new data is now
overwriting the oldest data. This will continue until
the logger is stopped or the battery runs out.
• When the logger has stopped logging, the LCD screen will
remain on until the logger is offloaded to a computer or
HOBO U-Shuttle (unless launched with the “Turn LCD off”
option). Once the logger has been offloaded and
disconnected from the computer, the LCD will turn off
automatically after 2 hours. The LCD will turn back on the
next time the logger is connected to the computer.
The logger is currently logging.
A sensor reading is above or below the high or low
alarm that you configured. Press and release the
Alarm/Stats button until the “alm” symbol
(described below) is displayed on the screen. This
symbol at left will clear depending on how alarms
were configured in HOBOware. If the alarm was
configured to clear when the logger is relaunched,
this symbol will remain on the LCD. Otherwise, it
will clear when the sensor reading is back within
the alarm limits or by pressing the Alarm/Stats
button for 3 seconds.
Setting up the Logger
Use HOBOware to set up the logger, including setting alarms,
selecting the options to start and stop logging, and choosing a
logging mode.
An alarm is ready to be cleared. This will only
appear if “Cleared with button press” was selected
in the HOBOware alarm settings. Press the
Alarm/Stats button for 3 seconds to clear the
alarm.
1. Connect the logger and open the Launch Logger window.
To connect the logger to a computer, use the USB cable
provided. Click the Launch icon on the HOBOware toolbar
or select Launch from the Device menu.
These symbols show the maximum, minimum,
average, and standard deviation values most
recently calculated for the logger (if the logging
mode has been set to Statistics in HOBOware).
Press the Alarm/Stats button for 1 second to cycle
through each of the available statistics and then
back to the current sensor reading (or to the alarm
value if applicable).
Important: USB 2.0 specifications do not guarantee
operation outside the range of 0°C (32°F) to 50°C (122°F).
2. Select the sensors to log in this deployment. Choose
Temperature or Temperature and RH. Type a label for the
sensor(s) if desired. Note that both sensors are required to
calculate dew point, which is an additional data series
available for plotting after reading out the logger.
This is the sensor reading that tripped the alarm.
Press the Alarm/Stats button to view this reading.
Press the Alarm/Stats button again to cycle
through any statistics (defined above) and
ultimately back to the current sensor reading.
This is an example of a temperature reading.
Temperature units are determined by the settings
in HOBOware. To switch between Celsius and
Fahrenheit, change the Display Preferences in
HOBOware before launching the logger.
This is an example of an RH reading.
The logger has been configured to start logging on
a particular date/time. The display will count down
in days, hours, minutes, and seconds until logging
begins. In this example, 5 minutes and 38 seconds
remain until logging will begin.
The launch settings are being loaded onto the
logger from HOBOware. Do not disconnect the
USB cable during this process.
An error occurred while loading the launch
configurations onto the logger from HOBOware.
Make sure the USB cable is connected to both the
logger and the computer and try launching again.
3. Set up alarms (optional). Click the Alarms button if you
want to configure an alarm to trip when the sensor reading
is above or below a value you specify. See Setting up Alarms
for details.
The logger has been stopped with HOBOware or
because the memory is full.
4. Configure filters (optional). Click the Filters button to
create additional filtered data series. Any filtered series will
be available automatically upon reading out the logger.
Notes:
• You can disable the LCD screen when logging. Select
“Turn LCD off” when setting up the logger as described in
the next section. When this option is enabled, you can
still temporarily view the LCD screen by pushing the
Start/Stop button for 1 second. The LCD will then remain
on for 10 minutes.
5. Select the Logging Interval. Select a logging interval from 1
second to a maximum of 18 hours, 12 minutes, and 15
seconds.
6. Select the Logging Mode:
• The LCD screen refreshes every 15 seconds regardless of
the logging interval selected in HOBOware. If you choose
1-800-LOGGERS
3
www.onsetcomp.com
HOBO Temp/RH 3.5% Data Logger (UX100-003) Manual
• Normal. In Normal mode, data will always be recorded at
the regular logging interval set in the previous step. This
is the default setting.
1. Click the Alarms button from the Launch Logger window. If
the Alarms button is disabled, make sure the Logging Mode
is not set to Burst. (Alarms can only be configured if the
logger is in Normal or Statistics mode.)
• Burst. In Burst mode, logging will occur at a different
interval when a specified condition is met. See Burst
Logging for more information.
2. Select a sensor. In this example, the temperature sensor
was selected.
• Statistics. In Statistics mode, maximum, minimum,
average, and standard deviation statistics are calculated
for all enabled sensors during logging, sampling at an
interval you specify. See Statistics for more information.
7. Choose when to start logging:
• Now. Logging begins immediately.
• At Interval. Logging will begin at the next even interval as
determined by the selected logging interval.
• On Date/Time. Logging will begin at a date and time you
specify.
• Push Button. Logging will begin once you press the
Start/Stop logging button for 3 seconds.
8. Choose when to stop logging:
• When Memory Fills. Logging will end once the logger
memory is full.
• Never (Wrapping). The logger will continue recording
data indefinitely, with newest data overwriting the
oldest. This option is not available if Burst is selected for
the Logging Mode.
3. Select the High Alarm checkbox if you want an alarm to trip
when the sensor reading rises above the high alarm value.
Type the reading next to the High Alarm checkbox or drag
the red upper slider in the Configure Alarms window.
• Push Button. Logging will end once you press the
Start/Stop logging button for 3 seconds. If you select
Push Button, you also have the option to select “Resume
logging on next button push.” Select this if you want to
be able to start and stop logging at any time during the
deployment by pushing the Start/Stop button on the
logger. Note that if you also choose Push Button to start
logging, then you will not be able to stop logging until 30
seconds after logging begins.
4. Select the Low Alarm checkbox if you want an alarm to trip
when the sensor reading falls below the low alarm value.
Type the reading next to the Low Alarm checkbox or drag
the blue lower slider.
5. Set the “Number of out-of-range samples displayed before
alarm is raised,” which is the number of sensor readings
needed to trigger each alarm. The time next to the
“Number of out-of-range…” field indicates the amount of
time it will take for the alarm to trip based on the number
you entered in that field and the 15-second LCD refresh
rate.
• Specific Stop Time. Logging will end at a date and time
you specify. Note that if you also configure the logger for
a Push Button stop and to “Resume logging on next
button push,” then the logger will stop logging at the
date you select regardless of how many times you stop
and restart the logger with the Start/Stop button.
6. Select either Cumulative or Consecutive for the Sensor
Alarm Mode. If you select Cumulative, the alarm will trip
after a specific number of samples (as set in the previous
step) are outside the limits (the high or low samples do not
need to be consecutive). If you select Consecutive, the
alarm will trip after a specific number of samples (as set in
the previous step) outside the limits are displayed in a row.
9. Choose whether to keep the LCD on or off. By default, the
LCD will always remain on while logging. If you select the
“Turn LCD off” checkbox, the LCD will not show the current
readings, status, or other information while the logger is
logging. You will, however, be able to temporarily turn the
LCD screen on by pressing the Start/Stop button for 1
second if you select this option.
7. Repeat steps 2 through 6 for the other sensor if desired.
10. Click the Start button to launch the logger. Disconnect the
logger from the computer and deploy it using the mounting
materials (see Mounting the Logger). After logging begins,
you can read out the logger at any time (see Reading Out
the Logger for details).
8. Choose how long the logger should maintain a sensor alarm
once it has tripped. Select “Host has relaunched logger” if
you want the alarm to remain visible on the LCD until the
next time you relaunch the logger. Select “Sensor reading
within limits” if you want the alarm to clear once the sensor
reading returns to the normal range between the high and
low alarm limits. Select “Cleared with button press” if you
want the alarm to remain on until you press the Alarm/Stats
button on the logger.
Setting up Alarms
You can set an alarm to trip on the logger when a sensor
reading rises above or falls below a specified value. To set an
alarm:
1-800-LOGGERS
9. Click OK to save alarm settings.
4
www.onsetcomp.com
HOBO Temp/RH 3.5% Data Logger (UX100-003) Manual
Notes:
• Once the logger is launched, alarms will trip as
determined by these settings. Logger alarms will display
on the LCD screen. Note that the alarm limits are only
checked when the logger’s LCD screen refreshes every 15
seconds.
• The actual values for the high and low alarm limits are set
to the closest value supported by the logger. For
example, the closest value to 85°F that the UX100 series
logger can record is 84.990°F and the closest value to
32°F is 32.043°F. In addition, alarms can trip or clear
when the sensor reading is within the logger
specifications of 0.02°C resolution. This means the value
that triggers the alarm may differ slightly than the value
entered. For example, if the High Alarm is set to
75.999°F, the alarm can trip when the sensor reading is
75.994°F (which is within the 0.02°C resolution).
• When you read out the logger, high and low alarm levels
will be displayed on the plot along with “Chan <#> Alarm
Tripped” and “Chan <#> Alarm Cleared” events showing
when the sensor alarm tripped and cleared. The “Chan
<#> Alarm Cleared” event contains the value that was
furthest out of range for the sensor before the alarm
cleared (see the Points table for the actual value).
5. Repeat steps 2 through 4 for the other sensor, if desired.
6. Set the burst logging interval, which must be less than the
logging interval. Select either a preset burst logging interval
or select Custom and enter your own interval. Keep in mind
that the more frequent the burst logging rate, the greater
the impact on battery life and the shorter the logging
duration.
Burst Logging
7. Click OK when done. This will return you to the Launch
Logger window. Click the Edit button next to Logging Mode
in the Launch Logger window to make additional changes.
Burst logging is a logging mode that allows you to set up more
frequent logging when a specified condition is met. For
example, let’s say the logger is recording data at a 5-minute
logging interval and burst logging is configured to log every 10
seconds when the temperature goes above 85°F (the high level)
or falls below 32°F (the low level). This means the logger will
record data every 5 minutes as long as the temperature
remains between 85°F and 32°F. Once the temperature reaches
90°F, for example, the logger will switch to the faster logging
rate and record data every 10 seconds until the temperature
falls back below the high level (or 85°F in this case). At that
time, logging then resumes every 5 minutes at the normal
logging interval. Similarly, if the temperature falls to 30°F, for
example, then the logger would switch to burst logging mode
again and record data every 10 seconds. Once the temperature
rises back to 32°F, the logger will then return to normal mode,
logging every 5 minutes.
Notes:
• Once the logger is launched, the high and low burst
logging levels are only checked when the logger’s
LCD screen refreshes once every 15 seconds. Therefore,
if you set the logging interval to less than 15 seconds and
the sensor reading falls outside the levels, the burst
logging will not begin until the next 15-second refresh
cycle.
• If high and/or low levels have been configured for more
than one sensor, then burst logging will begin when any
high or low condition goes out of range. Burst logging will
not end until all conditions on all sensors are back within
normal range.
• The actual values for the burst logging levels are set to
the closest value supported by the logger. For example,
the closest value to 85°F that the logger can record is
84.990°F and the closest value to 32°F is 32.043°F.
To set up burst logging:
1. Select Burst for Logging Mode in the Launch Logger
window. If Burst has already been configured for this
logger, click the Edit button in the Launch Logger window.
Note that you cannot set up alarms with burst logging. You
also cannot select the Stop Logging option “Never
(wrapping)” if burst logging is configured.
• Burst logging mode can begin or end when the sensor
reading is within the logger specifications of 0.02°C
resolution. This means the value that triggers burst
logging may differ slightly than the value entered. For
example, if the High Level for a temperature alarm is set
to 75.999°F, burst logging can start when the sensor
reading is 75.994°F (which is within the 0.02°C
resolution).
2. In the Burst Logging window, select a sensor. In the
example at right, the temperature sensor was selected.
3. Select the High Level checkbox if you want to set up a
condition in which burst logging will occur when the sensor
reading rises above the high level value. Type in the value or
drag the red upper slider (see example at right).
• Once the high or low condition clears, the logging
interval time will be calculated using the last recorded
data point in burst logging mode, not the last data point
recorded in “normal mode.” For example, let’s assume
the logger has a 10-minute logging interval and logged a
data point at 9:05. Then, the high level was surpassed
4. Select the Low Level checkbox if you want to set up a
condition in which burst logging will occur when the sensor
reading falls below the low level value. Type in the value or
drag the blue lower slider.
1-800-LOGGERS
5
www.onsetcomp.com
HOBO Temp/RH 3.5% Data Logger (UX100-003) Manual
and burst logging began at 9:06. Burst logging then
continued until 9:12 when the sensor reading fell back
below the high level. Now back in normal mode, the next
logging interval will be 10 minutes from the last burst
logging point, or 9:22 in this case. If burst logging had not
occurred, the next data point would have been at 9:15.
• A New Interval event will appear on the plot (if you select
events for plotting in the Plot Setup window) each time
the logger enters or exits burst logging mode.
Statistics
3. Set the sampling interval, which must be less than and a
factor of the logging interval. Choose either a preset
sampling interval or select Custom and enter your own
sampling interval. Keep in mind that the more frequent the
sampling rate, the greater the impact on battery life.
Statistics is a logging mode in which the logger calculates
maximum, minimum, average, and standard deviation statistics
during logging, recording the results at each logging interval
based on samples taken at a rate you specify. This will result in
up to four additional series per sensor that record the following
information at each logging interval:
4. Click OK when done. This will return you to the Launch
Logger window. Click the Edit button next to Logging Mode
in the Launch Logger window to make additional changes.
• The maximum, or highest, sampled value,
• The minimum, or lowest, sampled value,
Once logging begins, click the Alarm/Stats button on the logger
to cycle through the current maximum, minimum, average, and
standard deviation data on the LCD screen. You can plot the
statistics series once you read out the logger.
• An average of all sampled values, and
• The standard deviation from the average for all sampled
values.
For example, let’s say both the temperature and RH sensors
have been enabled, the logging interval is set to 5 minutes and
the sampling interval is set to 30 seconds (with maximum,
minimum, average, and standard deviation all enabled). Once
logging begins, the logger will measure and record the actual
temperature and RH sensor values every 5 minutes. In addition,
the logger will take a temperature and RH sample every 30
seconds and temporarily store them in memory. The logger will
then calculate the maximum, minimum, average, and standard
deviation using the samples gathered over the previous 5minute period and log the resulting values. When reading out
the logger, this would result in 10 data series (not including any
derived series, such as dew point): two sensor series (with
temperature and RH data logged every 5 minutes) plus eight
maximum, minimum, average, and standard deviation series
(four for temperature and four for RH with values calculated
and logged every 5 minutes based on the 30-second sampling).
Reading Out the Logger
There are two options for reading out the logger: connect it to
the computer with a USB cable and read out it with HOBOware,
or connect it to a HOBO U-Shuttle (U-DT-1, firmware version
1.18m030 or higher) and then offload the data files from the
U-Shuttle to HOBOware. Refer to the HOBOware Help for more
details.
Recording Internal Logger Events
The logger records the following internal events to track logger
operation and status. You can plot these events in HOBOware
after reading out the logger and opening the data file.
Internal Event Name
Definition
Host Connected
The logger was connected to the computer.
Started
The Start/Stop button was pressed to begin
logging.
1. Select Statistics for Logging Mode in the Launch Logger
window. If Statistics has already been configured for this
logger, click the Edit button in the Launch Logger window.
Stopped
The logger received a command to stop
recording data (from HOBOware or by
pushing the Start/Stop button).
2. Click the Maximum, Minimum, Average, and Standard
Deviation checkboxes for each of the statistics you want to
calculate during logging. Note that Average is automatically
enabled when selecting Standard Deviation. Important:
Statistics apply to all enabled sensors; every selected
statistic will be calculated for all sensors (except battery
voltage). For example, if both the temperature and RH
sensors have been selected in the Launch Logger window
and you select Average, then the average will be calculated
for both temperature and RH. In addition, the more
statistics you record, the shorter the logger duration and
the more memory is required.
Button Up/Button
Down
The Start/Stop button was pressed for
1 second.
Chan <#> Alarm
Tripped
A sensor alarm has tripped; # is the channel
or sensor number as shown in the Launch
Logger window in HOBOware.
Chan <#> Alarm
Cleared
A sensor alarm has cleared; # is the channel
or sensor number as shown in the Launch
Logger window in HOBOware. This event also
contains the value that was furthest out of
range for the sensor before the alarm
cleared.
New Interval
The logger has entered or exited burst
logging mode.
Safe Shutdown
The battery level dropped below 2.5 V; the
logger performs a safe shutdown.
To set up statistics:
1-800-LOGGERS
6
www.onsetcomp.com
HOBO Temp/RH 3.5% Data Logger (UX100-003) Manual
Mounting the Logger
There are several ways to mount the logger using the materials
included:
RH sensor with two
pins inserted in board
• Use the four built-in magnets on the back of the logger to
mount it to a magnetic surface.
• Attach the Command strip to the back of the logger to
mount it a wall or other flat surface.
• Use the double-sided tape to affix the logger to a surface.
• Insert the hook-and-loop strap through the mounting
loops on both sides of the logger to mount it to a curved
surface, such as a pipe or tubing.
4. Snap the louvered door back into place in the logger.
Protecting the Logger
5. Check logger status in HOBOware to verify the RH reading.
The logger is designed for indoor use and can be permanently
damaged by corrosion if it gets wet. Protect it from
condensation. If the message FAIL CLK appears on the LCD
screen, there was a failure with the internal logger clock
possibly due to condensation. Remove the battery immediately
and dry the circuit board.
Battery Information
The logger contains a 3V CR2032 battery (HRB-TEMP). Expected
battery life varies based on the ambient temperature where
the logger is deployed, the logging or sampling interval,
frequency of offloading to the computer, number of channels
that are active, if burst or statistics logging modes are active,
and battery performance. A new battery typically lasts 1 year
with logging intervals greater than 1 minute. Deployments in
extremely cold or hot temperatures, a logging interval faster
than 1 minute, or a sampling interval faster than 15 seconds
can impact battery life. Estimates are not guaranteed due to
uncertainties in initial battery conditions and operating
environment.
Note: Static electricity may cause the logger to stop logging.
The logger has been tested to 8 KV, but avoid electrostatic
discharge by grounding yourself to protect the logger. For more
information, search for “static discharge” in the FAQ section on
onsetcomp.com.
Replacing the RH Sensor
The internal RH sensor may require replacement if it is
damaged mechanically or by exposure to condensation or
chemicals. The replacement sensor is available from Onset
(HUM-UPS-500). To replace the sensor:
The logger can also be powered by the USB cable when the
remaining battery voltage is too low for it to continue logging.
Connect the logger to the computer, click the Readout button
on the toolbar, and save the data as prompted. Replace the
battery before launching the logger again.
1. Use a screwdriver to pop out the louvered door in the
logger case.
To replace the battery:
1. Open the battery door on the top of the logger.
2. Use the tab on the built-in battery removal tool inside the
compartment to remove the battery.
RH Sensor
3. Place the circular battery removal tool around the negative
side of the new battery with the tab up. Insert the new
battery with the positive side facing out. The LCD should
display “HOBO” briefly after correctly installing the battery.
Tab on battery-removal tool
2. Use needle-nose pliers to remove the RH sensor from the
board inside the logger case and discard it.
CR2032 battery; positive
side facing out
Battery door
3. Insert the new sensor so that the pins are in the two holes
on the board (shown here enlarged and without the logger
case for illustrative purposes).
Mounting
magnets
Mounting
magnets
1-800-LOGGERS
7
www.onsetcomp.com
HOBO Temp/RH 3.5% Data Logger (UX100-003) Manual
WARNING: Do not cut open, incinerate, heat above 85°C
(185°F), or recharge the lithium battery. The battery may
explode if the logger is exposed to extreme heat or conditions
that could damage or destroy the battery case. Do not dispose
of the logger or battery in fire. Do not expose the contents of
the battery to water. Dispose of the battery according to local
regulations for lithium batteries.
HOBOware provides the option of recording the current battery
voltage at each logging interval, which is disabled by default.
Recording battery life at each logging interval takes up memory
and therefore reduces logging duration. It is recommended you
only record battery voltage for diagnostic purposes.
1-800-LOGGERS (564-4377) • 508-759-9500
www.onsetcomp.com • [email protected]
© 2013 Onset Computer Corporation. All rights reserved. Onset, HOBO, and HOBOware are
trademarks or registered trademarks of Onset Computer Corporation. All other trademarks are the
property of their respective companies.
16209-E