1
HOBO Temp Data Logger (UX100-001) Manual
logging interval will be 10 minutes from the last burst
logging point, or 9:22 in this case. If burst logging had not
occurred, the next data point would have been at 9:15.
• A New Interval event will appear on the plot (if you select
events for plotting in the Plot Setup window) each time
the logger enters or exits burst logging mode.
Statistics
Statistics is a logging mode in which the logger calculates
maximum, minimum, average, and standard deviation statistics
during logging, recording the results at each logging interval
based on samples taken at a rate you specify. This will result in
up to four additional series per sensor that record the following
information at each logging interval:
• The maximum, or highest, sampled value,
• The minimum, or lowest, sampled value,
• An average of all sampled values, and
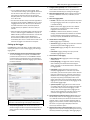
3. Select the Low Level checkbox if you want to set up a
condition in which burst logging will occur when the sensor
reading falls below the low limit value. Type in the value or
drag the blue lower slider.
• The standard deviation from the average for all sampled
values.
For example, let’s say the logging interval is set to 5 minutes
and the sampling interval is set to 30 seconds (with maximum,
minimum, average, and standard deviation all enabled). Once
logging begins, the logger will measure and record the actual
temperature sensor values every 5 minutes. In addition, the
logger will take a temperature sample every 30 seconds and
temporarily store it in memory. The logger will then calculate
the maximum, minimum, average, and standard deviation using
the samples gathered over the previous 5-minute period and
log the resulting value(s). When reading out the logger, this
would result in 5 data series: one temperature series (with data
logged every 5 minutes) plus four maximum, minimum,
average, and standard deviation series (with values calculated
and logged every 5 minutes based on the 30-second sampling).
4. Set the burst logging interval, which must be less than the
logging interval. Select either a preset burst logging interval
or select Custom and enter your own interval. Keep in mind
that the more frequent the burst logging rate, the greater
the impact on battery life and the shorter the logging
duration.
5. Click OK when done. This will return you to the Launch
Logger window. Click the Edit button next to Logging Mode
in the Launch Logger window to make additional changes.
Notes:
• Once the logger is launched, the high and low burst
logging levels are only checked when the logger's
LCD screen refreshes once every 15 seconds. Therefore,
if you set the logging interval to less than 15 seconds and
the sensor reading falls outside the levels, the burst
logging will not begin until the next 15-second refresh
cycle.
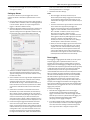
To set up statistics:
1. Select Statistics for Logging Mode in the Launch Logger
window. If Statistics has already been configured for this
logger, click the Edit button in the Launch Logger window.
2. Click the Maximum, Minimum, Average, and Standard
Deviation checkboxes for each of the statistics you want to
calculate during logging. Note that Average is automatically
enabled when selecting Standard Deviation. In addition, the
more statistics you record, the shorter the logger duration
and the more memory is required.
• The actual values for the burst logging levels are set to
the closest value supported by the logger. For example,
the closest value to 85°F that the logger can record is
84.990°F and the closest value to 32°F is 32.043°F.
• Burst logging mode can begin or end when the sensor
reading is within the logger specifications of 0.02°C
resolution. This means the value that triggers burst
logging may differ slightly than the value entered. For
example, if the High Level for a temperature alarm is set
to 75.999°F, burst logging can start when the sensor
reading is 75.994°F (which is within the 0.02°C
resolution).
• Once the high or low condition clears, the logging
interval time will be calculated using the last recorded
data point in burst logging mode, not the last data point
recorded in “normal mode.” For example, let’s assume
the logger has a 10-minute logging interval and logged a
data point at 9:05. Then, the high level was surpassed
and burst logging began at 9:06. Burst logging then
continued until 9:12 when the sensor reading fell back
below the high level. Now back in normal mode, the next
1-800-LOGGERS
3. Set the sampling interval, which must be less than and a
factor of the logging interval. Choose either a preset
sampling interval or select Custom and enter your own
sampling interval. Keep in mind that the more frequent the
sampling rate, the greater the impact on battery life.
5
www.onsetcomp.com