1
Debugging
Real Time
Embedded Systems
www.atomicrhubarb.com/embedded
Lecture 1 – January 17, 2012
Topic
Section Topic
• Where in the books
– Catsoulis chapter/page
– Simon chapter/page
– Zilog UM197 (ZNEO Z16F Series Flash Microcontroller Contest Kit User Manual)
– Zilog UM171 (ZiLOG Developer Studio II—ZNEO User Manual)
– Zilog PS220 (ZNEO Z16F Series Product Specification)
– Zilog UM188 (ZNEO CPU Core User Manual)
– Assorted datasheets
My Program
doesn't work!
What do I
do now?
Look for bugs ...
bug: An elusive creature living in a
program that makes it incorrect. The
activity of "debugging", or removing
bugs from a program, ends when
people get tired of doing it, not when
the bugs are removed.
-- "Datamation", January 15, 1984
Debugging
Embedded systems present special
problems for a programmer, because
they usually lack keyboards, screens,
disk-drives and other helpful user
interfaces and storage devices that are
present on business computers.
Debugging
In Software
Emulator/Simulator
Debug routines
In Hardware
ICE - in-circuit emulator.
OCD - On-circuit debugger.
BDM - background debug module
Simulator
Emulator
Inspect variables, memory, clock, call
stack, disassemble code.
Very useful for debugging software
(algorithms and logic)
Often not helpful for debugging
hardware drivers.
On-Chip Debugger
On-Chip Debugger
Inspect variables, memory, clock, call
stack, disassemble code.
Useful for debugging some types of
hardware drivers (accessing SFRs)
Not always helpful for timing
dependent things or external
hardware.
Software Techniques
Using an LED to indicate position in
code.
Using LED array to display internal
values
16-bit HEX
7x 16-bit binary
4x 32-bit binary
Using printf to send data to serial port
Use of OCD
If timing issues are suspected
Save intermediate variables
Step OVER that part of function.
Examine variables after the fact in
watch/local window.
Use In-Circuit Emulator
In Circuit Emulator
Often called an ICE, is an invaluable
software developers tool in embedded
design.
The processor or microcontroller of the
target hardware will be replaced by the
ICE. Often a smaller part of the emulator,
the pod, is put into the hardware, while
the main emulator functionality resides in
a box which is connected to the pod with
cables.
ICE ...
An ICE can emulate the replaced
processor or uC in real time. The
developer loads the program into the
emulator and can then run, step and
trace into it, much like it is done on PC's.
Many emulators have more advanced
features like performance analysis,
coverage analysis, a trace buffer and
advanced trigger and breakpoint
possibilities.
ICE
The Z8 ICE
($3,000)
No Z16
version yet!
ICE ...
Inside the ICE, or usually on the pod, is a
processor of the kind the emulator
replaces, or a special bond-out version of
the same chip.
Bond-out chips have normally internal
signals and/or busses bonded out to its
connector. This iwill allow the ICE and the
developer get a more complete picture of
the status of the chip.
Often emulators that use bond-out chips
have more features then those that don't.
Write for test and debug
Build a hardware abstraction
layer.
Fix hardware bugs once
Allows for rapid porting
to another platform
Isolates hardware/software
problems.
Allows for off-platform
debugging of logic/algorithms
Application
Abstraction
Hardware
Write for test
Build a test scaffold
Build reusable and repeatable
tests for verifying the
Test
hardware function through
Application
the abstraction layer.
Abstraction
Allows you to isolate the
Hardware
problems (in your application
or with the abstraction layer).
Separates debugging the application
from debugging the hardware drivers.
Another Platform
Many times logic and
algorithms can be
developed on another
platform. One that supports
better debugging (gdb) or
less fooling around with
hardware.
Replace hardware functions
with simulated hardware
functions.
Application
Abstraction
Simulated
Hardware
Debugging is twice as hard as writing
the code in the first place.
Therefore, if you write the code as
cleverly as possible, you are, by
definition, not smart enough to debug it.
-- Brian W. Kernighan
Code for Debug
Write clear programs
Cleverness is not usually clear.
Comment your code.
And often hard to figure out weeks/months
later.
Particularly the hardware dependent parts.
Watch compiler warnings
Fill allocated memory with value, so you
can see it in the debugger.
Code for Debug
Fill malloc'd space with some value
before you free it, so you can see it and
to invalidate the data so you will get an
error early in your development cycle if
you attempt to use it after it has been
freed.
Check array bounds. Check string limits.
Check return types for validity before
using.
Check pointers for validity before using.
Code for debug
Refactor regularly.
Quick-and-dirty works for simple proofof-concept code. It will cause you
nothing but grief if it gets into your
production (professional) code.
Assert
The Z16 API includes the assert macro
#include <assert.h>
assert()
#define assert(e) if (!(e)) {\
printf("Assertion failure: %s, file: %s, line %d\n",\
#e,__FILE__,__LINE__);\
exit(1);\
}
Learn C
Read. Practice. Examine compiler output
(dissassembly). Read some more.
Pay attention to data types and what the
compiler is doing with them (automatic
promotion, casting, etc).
C is complex enough on any system. Now
consider that with a bad compiler on a
limited resource system, with additional
features for hardware access, and limited
debugging capability.
More Hardware
Learn to use basic functions of an
oscilloscope and logic analyzer.
Use them to check your output signals
to verify your are generating what you
intended.
Use them to check your input signals to
verify that you are receiving what you
think your are receiving.
Whats the difference bewteen
a Logic Analyzer and an
Oscilloscope?
Logic Analyzer VS
Oscilloscope
Oscilloscopes are most useful in the
domain of analog signals, including
analyzing analog problems such as noise,
ringing (even when applied to digital
signals). They generally have a limited
number of input channels (1,2,4).
Logic analyzers capture the state of
digital signals. They can have a wide
number of input channels (8,16,32). And
frequently include timing and data
analysis.
How do I use that
Oscilloscope thingy?
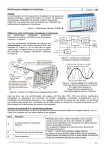
Oscilloscope
Volts
Time
Volts/Div
Time/Div
~3V 0.01 sec
Don't forget the ground clip
TDS220
Dual Trace (2 V-T plots)
Triggering
Determine when to start plotting V-T
Triggering
No hardcopy
No. We don't have the optional module that
captures/prints a copy of the display.
They are old and only support HP ink jet
printers with Centronix connectors (~1995).
Oscilloscope
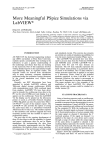
Oscilloscope Tutorial
https://www.cs.tcd.ie/courses/baict
/bac/jf/labs/scope/
XYZ's of Oscilloscopes
http://www.tek.com/Measurement/c
gibin/framed.pl?Document=/Measurem
ent/App_Notes/XYZs/index.html&Fra
meSet=oscilloscopes
So what can we really do with
an oscilloscope to help with
debugging software?
Use an oscilloscope to ...
1.Verify input signals (is the clock signal
really a clock?)
2.Use Timer output pins to verify timers
are actually working like you want (see
the clock and measure the time).
3.Use GPIO to indicate function calls or
function execution.
1. Verify input signals
PS/2 keyboard clock and data lines for an “a” keypress
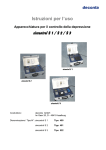
2. Timer output pins
50 ms
Verify timer is correct
Example
DebugVoltDivider
3. Function calls
Using an
oscilloscope to
indicate where
we are in the
code execution.
PA3
PA2
PA0
PA1
Your Debug Methodology
Find a Development and Debug
methodology that works for you.
The Ten Secrets of Embedded
Debugging
http://www.embedded.com//showAr
ticle.jhtml?articleID=47208538
Embedded Debugging
Know your tools
Find memory problems early
Optimize through understanding
Don't put needles in your haystack
Reproduce and isolate the problem
Know where you've been
Make sure your tests are complete
Pursue quality to save time
See, understand, then make it work
Harness the beginner's mind
Know Your Tools
“Good programmers need to be proficient
with a variety of tools. Each has a place,
... each has power.”
Source Debugger
Emulator/Simulator
Simple printf
In-Circuit Emulator
Profilers
Compiler/Assembler (yes, that's part of the
debug cycle)
Find Memory Problems Early
“Memory problems are insidious. They fall
into three main types: leaks,
fragmentation, and corruption. The best
way to combat them is to find them
early.”
malloc/free
Use of mallc'd memory after free
Not completely writing to flash (or being
interrupted), means we need to verify.
Optimize through
understanding
Real time is more about reliability than
speed. That said, efficient code is critical
for many embedded systems. Knowing
how to make your code zing is a
fundamental skill that every embedded
programmer must master.
The hard part is knowing which code to
make run fast.
Know how your CPU is executing your
code. It's the only path to efficiency.
Don't put needles in your
haystack
“Follow your good coding and design
guidelines, check your assumptions,
rethink your algorithms. If nothing
else, put an easily found tag in a
comment that this code is suspect.”
In other words, follow good
programming practices.
Reproduce and isolate the
problem
“... the critical first step is to reliably
duplicate the problem: recreate it
then defeat it. Get a sequence, any
sequence, that reliably shows the
problem and you're halfway there”
Reduce your program to the minimum
that reproduces the bug/problem.
Know where you've been
Version Control - “A backwards-traceable
record is a great way to make sure you
understand future problems.”
“When you get your application or
module working in any significant
capacity, checkpoint it. Later, when it
stops working, even though "nothing has
changed," you will have a baseline to
check your assumptions.”
Make sure your tests are
complete
“Coverage testing should be part of
every quality assurance process. How
many revisions and rewrites has your
code gone through over the years and
releases? Has your test suite grown
with the changes? Or do the tests only
exercise the features that existed in
version 1.0?”
Pursue quality to save time
“... it costs 10 to 200 times more to fix
a bug at the end of the cycle than at
the beginning. The cost of a small bug
that makes it to the field can be
astronomical. Even if the bug doesn't
have a significant impact on
performance, it can significantly affect
perceived quality.”
Why is this?
Why?
Programs grow more complex.
Fixing later requires more thought to
figure out why things are …
Documentation needs to be updated
Other code depends on this
bug/feature
Testing is now more complex
See, understand, make it work
“real-time systems interact with a
dynamic world, ... traditional debuggers
can't reveal dynamic behavior ....
Questions like:
How noisy is my sensor?
How fast is the queue growing?
When did the valve close?
There simply cannot be answered by any
tool that stops the execution. These
questions deal directly with the dynamic
behavior of the real-world system.”
Harness the beginner's mind
“Most debugging is the process of
learning more and more about your
application.
The "beginner's mind" is a Zen concept
of emptying your mind so it can be
open to new solutions.”
Last Words
Verify the easy/obvious first.
Power, wires, proper timing, signals
as expected, examine data in
registers, calculations for size
overflow, improper castsing.
Unfortunately the Z16 tools do not
contain some important tools. Like
Version control
Execution profiler/tracer
Last words (2)
If developing embedded systems
professionally, pick your processor
after considering the quality of the
available tools (not just the instruction
set, cost of the processor, etc)
How do I use that
multi-meter thingy?
Use the alligator clip.
Use it carefully.
Use protoboard to get to hard to reach wires
When Done ...
Turn off
Retract the probe
tip
Put back in case
Don't loose the
pieces!
Debugging Summary
Simulator
On chip debugger
Status LEDs
printf
Use output pins and oscilloscope
Verify input signals with oscilloscope
Verify output signals
Debugging summary ...
Examine compiler output
Turn off optimization
Use online forums for Q&A
Think
Assume nothing, verify everything