1
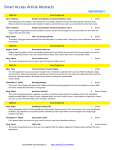
Systems biology HGPEC: a Cytoscape plugin for prediction of novel disease-gene and disease-disease associations and evidence collection based on a random walk on heterogeneous network Duc-Hau Le1,* 1 School of Computer Science and Engineering, Water Resources University, 175 Tay Son, Dong Da, Hanoi, Vietnam. whom correspondence should be addressed. *To User Manual I. Setup............................................................................................................................................. 2 II. Overview of HGPEC ................................................................................................................... 3 III. Case study: Prediction of novel breast cancer-associated genes and diseases ............................. 4 III.1. Step 1: Construct a heterogeneous network ............................................................................ 4 III.2. Step 2: Select a disease of interest .......................................................................................... 4 III.3. Step 3: Select candidate sets ................................................................................................... 5 III.4. Step 4: Prioritize candidate genes and diseases in the heterogeneous network ...................... 5 III.5. Step 5: Examine ranked genes and diseases ........................................................................... 5 III.5.1. Visualization .................................................................................................................... 5 Topological relationships between highly ranked candidate genes and the disease of interest .................................................................................................................................................. 6 Topological relationships between highly ranked candidate diseases and the disease of interest ...................................................................................................................................... 8 III.5.2. Annotation & Evidence Search ........................................................................................ 9 Annotation and evidence collection for associations between highly ranked candidate genes and the disease of interest ...................................................................................................... 10 Annotation and evidence collection for relevance between highly ranked candidate diseases and the disease of interest ...................................................................................................... 13 IV. Reference ................................................................................................................................... 16 1 I. Setup - HGPEC can only run on Cytoscape 2.x platform, therefore user should download Cytoscape version 2.x (from 2.7 to 2.8.3) at http://cytoscape.org/download_old_versions.html Cytoscape need JRE to run, therefore download JRE version 7.x or later from http://www.oracle.com/technetwork/java/index.html and install it. Install Cytoscape to the root folder (e.g., C:\Program Files\Cytoscape_v2.8.3\). Download HGPEC.jar file from http://hgpec.sourceforge.net/ and store in plugins folder (e.g., C:\Program Files\Cytoscape_v2.8.3\plugins). Create folders Data in the root folder of Cytoscape (e.g., C:\Program Files\Cytoscape_v2.8.3\). Download GO annotation and GeneRIF data at ftp.ncbi.nlm.nih.gov/gene/DATA/gene2go.gz and ftp://ftp.ncbi.nih.gov/gene/GeneRIF/generifs_basic.gz, respectively, then extract and store in the Data folder (e.g., C:\Program Files\Cytoscape_v2.8.3\Data). Set the maximum heap size to at least 1000MB by opening the file Cytoscape.vmoptions (which is located in the Cytoscape root folder) and change corresponding line to -Xmx1000m. (Demonstration on next pages was done on Windows 7/8 and Cytoscape 2.8.3) 2 II. Overview of HGPEC Run Cytoscape, HGPEC will be automatically loaded in the Plugins menu of Cytoscape HGPEC has the following menu items: - Prediction & Evidence Collection: This contains main functions of HGPEC - Databases: This shows pre-installed data in HGPEC. It also contains links to GO annotation and GeneRIF data sources. - Help…, About…, and Exit Plugin: To show user manual, additional information of HGPEC, and to close HPGEC panels from Cytoscape. Run HGPEC by clicking menu item Prediction & Evidence Collection. HGPEC loads pre-installed data at the beginning. HGPEC is organized into two main panels (Network & Training Data and Prediction & Evidence Collection). The main tasks (Prediction of Genes and Diseases, and Evidence Collection) of HGPEC are completed after five steps: - Step 1: Define a Heterogeneous network - Step 2: Select Diseases of interest - Step 3: Provide Candidate Gene Set - Step 4: Prioritize (candidate genes and diseases) - Step 5: Examine Ranked Genes and Diseases 3 III. Case study: Prediction of novel breast cancer-associated genes and diseases In the following section, we show the ability of HPEC in identifying novel breast cancer-associated genes and diseases. III.1. Step 1: Construct a heterogeneous network To this end, we select a phenotypic disease similarity network containing 5,080 diseases and 19,729 interactions (i.e., Disease_Similarity_Network_5) and a human protein interaction network containing 10,486 genes and 50,791 interactions (i.e., Default_Human_PPI_Network). Then, we connect them by known disease-gene associations to construct a heterogeneous network of diseases and genes by clicking To construct a heterogeneous network: 1. Select a disease similarity network. 2. Select a network of genes/proteins (e.g., the preinstalled one or one imported from Cytoscape). 3. Click to connect these two networks by known diseasegene associations. Note that: - For disease similarity network: We pre-installed 3 networks corresponding to 5, 10 or 15 nearest neighbors, which were extracted from a phenotypic disease similarity matrix data collected from (van Driel, et al., 2006) - For gene/protein interaction network: o We pre-installed a human physical protein interaction network collected from ftp://ftp.ncbi.nlm.nih.gov/gene/GeneRIF/interactions.gz. o However, user can use other protein/gene interaction networks by importing them to Cytoscape (File Import Network from table (Text/MS Excel)…). Genes/Proteins in the network must be identified by Gene Entrez ID. After that, click to load the imported network to network list. III.2. Step 2: Select a disease of interest We select breast cancer (OMIM ID: 114480), then create training list by click . Note that: - To quickly select a disease of interest, user should type a keyword then check Auto filter As a result, the training list includes the disease of interest (OMIM ID: 114480) and its 21 known associated genes. A total of 21 known associated genes The disease of interest (OMIM ID: 114480) 4 III.3. Step 3: Select candidate sets For candidate diseases, all remaining diseases are specified as candidate diseases by default. Therefore, there are 5,079 diseases in this set. For candidate genes, we select option All remaining genes in Gene Network. As a result, a total of 10,465 remaining genes were selected as candidate genes. Five ways to construct a candidate gene set: - Neighbors of Training Genes in Gene Network o User must define distance of neighbors to training genes - Neighbors Of Training Genes in Chromosome (also known as Artificial Linkage Interval) o User must define number of neighbors of each training gene in the same chromosome. - All remaining genes in Gene Network - Susceptible Chromosome Regions/Bands o User selects candidate genes from susceptible chromosome regions/bands. - User-defined o User manually provides a set of candidate genes by Entrez Gene ID or Gene Symbol. III.4. Step 4: Prioritize candidate genes and diseases in the heterogeneous network We set three parameters (i.e., back-probability ( 𝛾 ), jumping probability ( ) and subnetwork (Disease/Gene) importance ()) of RWRH algorithm to 0.5, 0.6 and 0.7, respectively. Please refer to (Li and Patra, 2010) for best parameter setting. Then click to rank all candidate genes and diseases in the heterogeneous network III.5. Step 5: Examine ranked genes and diseases Ranked genes and diseases are shown in two data tables From this interface, user can visualize, annotate and search evidences for novel promising associations between highly ranked candidate genes/ diseases and the disease of interest. III.5.1. Visualization Note that, not only candidate genes and diseases are ranked, but all genes and diseases in the heterogeneous network are also ranked. Therefore, user can visualize them in one view to exploit their topologically relationships. HGPEC provides two options of visualization (Gene/Protein interaction network and Heterogeneous network) 5 - Option Gene/Protein interaction network: Only relationships among selected genes in the gene/protein interaction network are visualized. Option Heterogeneous network: Relationships between selected genes and diseases in the heterogeneous network are visualized. Topological relationships between highly ranked candidate genes and the disease of interest - If we only focus on topological relationships between highly ranked candidate genes and known genes of disease of interest, we should select option Gene/Protein interaction network. For example, we selected 20 highly ranked candidate genes and 21 training genes of breast cancer for visualization 1. Select 21 training and 20 highly ranked candidate 2. genes. Then click Select option Gene/Protein interaction network. Then click 3. Group Attributes layout (default mode of HGPEC) 4. Switch to Force-directed Layout (Layout Cytoscape Layouts Force-directed Layout) Nodes in triangle shape are training genes, remaining ones are candidates. Nodes with high rankings are in red, relative high are in pink, medium are in white and light green, low are in green. We found that the sub-network are mostly connected. In other words, highly ranked genes are directly connected to known/training genes 6 - If we focus on topological relationships between highly ranked candidate genes and disease of interest and its associated genes, we should select option Heterogeneous network. For example, we selected top 20 ranked candidate genes, 21 training genes as above and the training disease (i.e., OMIM ID: 114480) for visualization 1. Select top 20 ranked candidate genes and 21 training genes. 2. Select the training disease (i.e., the disease of interest, OMIM ID: 114480) 4. Group Attributes Layout with “Type” attribute (default mode of HGPEC) 3. Select option Heterogeneous interaction network. Then click 5. Switch to Group attribute layout with “Role” attribute (Layout Cytoscape Layouts Group Attributes Layout Role) Node in rhombus shape is the disease of interest. Nodes with high rankings are in red, relative high are in pink, medium are in white and light green, low are in green. 7 Topological relationships between highly ranked candidate diseases and the disease of interest In this case, we selected top 20 ranked candidate diseases, 21 training genes and the disease of interest (i.e., OMIM ID: 114480) for visualization. 1. Select 21 training genes. 2. Select top 20 ranked candidate diseases and the training disease. 4. Group Attributes Layout with “Type” attribute (default mode of HGPEC) 3. Select option Heterogeneous interaction network. Then click 5. Switch to Group attribute layout with “Role” attribute (Layout Cytoscape Layouts Group Attributes Layout Role) Node in rhombus shape is the disease of interest. Nodes in rectangle shape are candidate diseases. Nodes with high rankings are in red, relative high are in pink, medium are in white and light green, low are in green. Similarly, we found that the sub-network are connected. In other words, highly ranked candidate diseases are directly connected to either known/training genes or the disease of interest. This means that candidate diseases which have connections to the disease of interest or associated with training genes are highly ranked. 8 III.5.2. Annotation & Evidence Search This function is to collect evidences and annotations for associations between highly ranked candidate genes/diseases and the disease of interest. Ranked genes and diseases are organized in two tabs Ranked genes Ranked diseases These two tabs are organized as follows: - Above panel includes a table data of ranked genes/diseases and functional buttons - Below panel includes tables of annotation and evidence data 9 Annotation and evidence collection for associations between highly ranked candidate genes and the disease of interest We selected top 20 ranked candidate genes for evidence collection. For annotation, this set can be easily annotated with pathways, protein complexes, disease ontology and gene ontology terms by click and Select GO sub-ontology and whether or not IEA evidence is included. Then click Note that: - GO Annotation data must be downloaded from ftp.ncbi.nlm.nih.gov/gene/DATA/gene2go.gz, then extracted and stored in Data folder in Cytoscape folder (e.g., C:\Program Files\Cytoscape_v2.8.3\Data). As a result, the top 20 ranked candidate genes are annotated with pathways, protein complexes, disease ontology and gene ontology 10 For association evidence search, promising associations between these selected candidate genes and the disease of interest can be collected from GeneRIF (Mitchell, et al., 2003; Osborne, et al., 2007), PubMed (Chang, et al., 2006) and OMIM (Amberger, et al., 2009; Hamosh, et al., 2005). Enter a keyword for disease of interest or select a corresponding MeSH term by clicking . After that, select a data source among the three ones (i.e., GeneRIF, PubMed and OMIM), then click Please wait while HPGEC is updating detail information about found PubMed and OMIM records. . Note that: - For GeneRIF, GeneRIF data must be downloaded from ftp://ftp.ncbi.nih.gov/gene/GeneRIF/generifs_basic.gz, then extracted and stored in Data folder in Cytoscape folder (e.g., C:\Program Files\Cytoscape_v2.8.3\Data). - For PubMed and OMIM, HGPEC automatically search the association between the keyword and the disease of interest from PubMed and OMIM using NCBI web services. Here are the result after repeating the above procedure three times for the three data sources. 11 Detail information of annotations (pathway, protein complex, disease ontology and gene ontology) and evidences (PubMed articles, GeneRIF text and OMIM title) can be viewed in lower panels by selecting each gene. For example: GO – Cellular component for gene RB1 There are six GO cellular component terms annotating to RB1 gene Evidences from GeneRIF data source for associations between gene RB1 and breast cancer There are 20 PubMed articles whose abstracts contain information about associations between RB1 gene and breast cancer. GeneRIF text are sentences in the abstracts, which contains such the associations. User can also export the selected candidate genes with their annotation and evidence information by clicking . See the exported file in Table S1 in Supplementary Materials 12 Annotation and evidence collection for relevance between highly ranked candidate diseases and the disease of interest We selected top 20 ranked candidate diseases for annotation and evidence collection. Similarly, this set can be easily annotated with pathways, protein complexes, disease ontologies and gene ontology (GO) terms by clicking 13 Note that, a number of studies have defined associations between diseases based on their shared associated genes (Goh, et al., 2007), shared protein complexes (Wang, et al., 2012), shared pathway (Li and Agarwal, 2009) and shared disease ontology (Li, et al., 2011). Therefore, in addition to annotate each disease in the top ranked candidate diseases with pathways, protein complexes and disease ontology terms, we provided a function to check whether or not these selected candidate diseases share genes, pathways, protein complexes and disease ontology terms with the disease of interest by clicking Further analyzing the above result, we found that - Twelve of 20 selected candidate diseases (Ranks: 1, 2, 6, 10, 11, 12, 13, 14, 15, 16, 19 and 20) have at least one gene, pathway, protein complex and disease ontology term shared with the disease of interest. - Five of 20 selected candidate diseases (Ranks: 3, 4, 8, 17 and 18) have at least one pathway, protein complex and disease ontology term shared with the disease of interest. However, they do not have any shared genes with the diseases of interest. This means that if we only based on the shared genes to associate these diseases with the disease of interest, we could not find any association. However, other biomedical data such as pathway, protein complex and disease ontology can provide evidences for their associations. - The three remaining of 20 selected candidate diseases (Ranks: 5, 7 and 9) do not have any shared gene, shared pathway, shared protein complex and shared disease ontology term with the disease of interest. However, they still have high rankings, which indicates that they highly are associated with the disease of interest. Further investigating their topological relationships with the disease of interest, we found an interesting result that like others in the top 20 selected candidate diseases, these diseases directly connected to the disease of interest (breast cancer (OMIM ID: 114480)) in the phenotypic disease similarity network. 14 Similarly, information about associations between selected candidate diseases and the disease of interest can be collected from GeneRIF, PubMed and OMIM based on the associations between their known associated genes and the disease of interest. In a similar way, detail information of annotations (pathways, protein complex and disease ontology) and sharing (genes, pathways, protein complexes and disease ontology terms) can be viewed in lower panels by selecting each disease. For example, here is the result for Prostate cancer (OMIM ID: 176807) There are 19 common pathways between Prostate cancer (OMIM ID: 176807) and Breast cancer (OMIM ID: 114480) Similarly, user can also export the selected candidate diseases with their annotation and evidence information by clicking . See the exported file in Table S2 in Supplementary Materials. 15 IV. Reference Amberger, J., et al. (2009) McKusick's Online Mendelian Inheritance in Man (OMIM®), Nucleic Acids Research, 37, D793-D796. Chang, A.A., Heskett, K.M. and Davidson, T.M. (2006) Searching the Literature Using Medical Subject Headings versus Text Word with PubMed, The Laryngoscope, 116, 336-340. Chen, X., Liu, M.-X. and Yan, G.-Y. (2012) Drug-target interaction prediction by random walk on the heterogeneous network, Molecular BioSystems, 8, 1970-1978. Goh, K.-I., et al. (2007) The human disease network, Proceedings of the National Academy of Sciences, 104, 8685-8690. Hamosh, A., et al. (2005) Online Mendelian Inheritance in Man (OMIM), a knowledgebase of human genes and genetic disorders, Nucleic Acids Research, 33, D514-517. Jiang, R., Gan, M. and He, P. (2011) Constructing a gene semantic similarity network for the inference of disease genes, BMC Systems Biology, 5, S2. Kohler, S., et al. (2008) Walking the Interactome for Prioritization of Candidate Disease Genes, The American Journal of Human Genetics, 82, 949-958. Le, D.-H. and Kwon, Y.-K. (2012) GPEC: A Cytoscape plug-in for random walk-based gene prioritization and biomedical evidence collection, Computational Biology and Chemistry, 37, 17-23. Li, J., et al. (2011) DOSim: An R package for similarity between diseases based on Disease Ontology, BMC Bioinformatics, 12, 266. Li, Y. and Agarwal, P. (2009) A Pathway-Based View of Human Diseases and Disease Relationships, PLoS ONE, 4, e4346. Li, Y. and Patra, J.C. (2010) Genome-wide inferring gene-phenotype relationship by walking on the heterogeneous network, Bioinformatics, 26, 1219-1224. Mitchell, J.A., et al. (2003) Gene Indexing: Characterization and Analysis of NLM's GeneRIFs. In, Proceedings of AMIA 2003 Symposium. American Medical Informatics Association. Osborne, J., et al. (2007) GeneRIF is a more comprehensive, current and computationally tractable source of genedisease relationships than OMIM, Bioinformatics Core, Northwestern University, Technical Report. van Driel, M.A., et al. (2006) A text-mining analysis of the human phenome, Eur J Hum Genet, 14, 535-542. Wang, Q., et al. (2012) Community of protein complexes impacts disease association, Eur J Hum Genet, 20, 1162-1167. 16