1
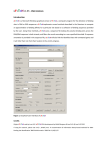
JFitom v Alpha – USER MANUAL Introduction JFITOM is a portable and extended version of xFITOM, a computer program for the detection of binding sites in DNA sequences. JFITOM implements several methods described in the literature to compute an approximation of binding affinity for a particular transcription factor binding site based on a collection of binding sequences provided by the user. Using these methods, JFITOM scans a sequence file looking for putative binding sites across the DNA sequence in both strands, and filters the results according to a user‐specified threshold. JFITOM will also link the identified sites with annotated genes and it will infer their roles from their location in the vicinity of genes. Figure 1. Graphical User Interface of JFITOM Credits Original FITOM and xFITOM code by Ivan Erill. JFITOM development by Omar Shehab and Ivan Erill. @ Ivan Erill 2010 If using for research, please cite: Erill, I; O’Neill, M.C. ‘A reexamination of information theory-based methods for DNA-binding site identification’ BMC Bioinformatics. 2009 Feb 11;10(1):57. 1 How to Get JFITOM Visit http://userpages.umbc.edu/~erill/7399/ and select JFITOM project. This opens the home page of JFITOM project. The executable file is available on the page for download. System requirements Software - biojava.jar - jFitom-core.jar - bytecode.jar - commons-cli.jar - commons-collections-<latest-version>.jar - commons-dbcp-<latest-version>.jar - commons-pool-<latest-version>.jar - jgrapht-jdk1.5.jar - log4j-<latest-version>.jar - JDK/JRE 1.5 or above Operating system - All operating systems supported by JDK/JRE 1.5 or above Hardware - All hardware configurations supported by JDK/JRE 1.5 or above All required libraries except JDK/JRE are shipped with JFITOM. They are archived in the JFITOM executable file. Getting started JFITOM’s distant predecessor, FITOM, is a command‐line argument based program, meaning that it is run from a DOS prompt. Its more immediate predecessor, xFITOM, includes a Graphical User Interface (GUI) to select the required files and to set all the necessary options. JFITOM provides new functionality, like platform independency and the ability to create a list of regulated genes for each site. JFITOM can be launched from the command line, from a script file or using the GUI. To run JFITOM from the command line, the user has to use java with JFITOM-run.jar as the main argument. JFITOM-run.jar takes three command line arguments, which are as follows: the options file, the genome file and the site collection file. A sample command to run JFITOM would be as follows: java –jar JFITOM-run.jar –g (genome.file) –s (site.file) –o (options.OPT) To run JFITOM from script files the same commands can be used. JFITOM GUI facilitates saving or customizing options in an interactive way. If the JFITOM command is not provided with any argument or if JFITOM-run.jar is double clicked, JFITOM will launch the graphical user interface. 2 Main operation files in JFITOM JFITOM operates with three main files: a file containing the genome sequence to be searched (genome file), a file containing a list of binding sites (collection file) and a file specifying the program options (options file). The sequence file: (Genome file) The sequence file (Sequence_file.ext) is the file containing the sequence or sequences the user wants to scan. The sequence file can only be in GenBank format, (.GB, .GBK or .Genbank). The collection file: (Site/Collection file) The collection file (Collection_file.ext) is the file containing the collection of known binding sites that the user provides the program with in order to construct its model of binding site, or motif. Collection files can be either bare site files (plain text with aligned sites on consecutive lines) or FASTA files, in which each site line is preceded by an identification line beginning with ‘>’. Accepted extensions are: FAS/FNA for FASTA files and TXT for bare site files. The options file: (Options file) The options file (.OPT) stores different operational strategies and information. If no such file is specified in the command line argument, the software operates with factory defaults. Main functionalities JFITOM provides the following functionalities dealing with different aspects of program operation. The GUI The graphical user interface is very simple and intuitive. All the operations are done on a single window (Figure 1). The window contains a form for user input which is divided into six sections. The first section is Input and output files. This section takes the genome file and the sites file as user input. If the user wants to specify that the sites are palindromic, she can click the check box. The user can also specify the name for the output file where the result will be stored. Figure 2. Input and output files 3 The second section, Default path, allows the user to set the default path for present session. After setting the default path, all other file browsing controls of JFITOM sets their current directory to this path. After setting the default path, if the directory does not contain any .OPT file it requests the user to give a file name (*.OPT) where the options will be save. Instead of creating a new file, a user may also select an old .OPT file. In that case, JFITOM GUI controls are set to the values stored in the options file. If the user chooses not to select the options file at that time, she is asked again for the file name during computing and storing options and result. Figure 3. Default path The third section, Scoring methods, allows the user to choose scoring method. There are four options. By default JFITOM scores using the Ri method. Figure 4. Scoring methods The fourth section, Annotation strategy, allows the user to set the annotation strategy. While JFITOM scans a genome it needs to know the hysteresis limit (the maximum number of base pairs JFITOM scans to determine the first gene with appropriate orientation), intergenic (the maximum number of base pairs between genes of same orientation regulated by the same binding site), operator (the maximum number of base pairs within which the regulating site is located before a gene sequence starts) and intragenic distances (the maximum number of base pairs within which the regulating site is located after a gene sequence starts). The user can specify the values in terms of base pairs. The GUI validates the inputs before using them. 4 Figure 5. Annotation strategy The fifth section, Filtering strategy, allows the user to set the strategy to filter the result. If the user sets the maximum size of the list as Return top N sites, JFITOM returns N number of sites at most. If the user sets the maximum size of the list as Return top N% of the genes, the number of sites JFITOM returns is N% of the total number of genes. If the user sets a normalized threshold, JFITOM computes the maximum and minimum score of the given binding sites. Then this maximum to minimum range is converted to a normalized range of 1.0 to 0.0. Finally, JFITOM converts the user given threshold back to the original scale. If the user sets the threshold as standard deviation JFITOM computes the mean and standard deviation of the scores of the given collection of sites. Then the standard deviation is multiplied by the user input and used as the threshold score. Figure 6. Filtering strategy The last section, Generate results, allows the user to store the options and launch the analysis. The user can also decide if she wants to generate log files or view the result immediately. Figure 7. Generate result Input and output file processing 5 • • • Loading genome file The main JFITOM program loads the genome file first. The file can be only in GenBank format. After loading the file, JFITOM uses BioJava library to parse that file and extract the genes along with annotations. For annotation, the following parameters are stored – name, location, strand, locus tag, protein id, product and note. Loading sequence file After the genome file, JFITOM loads the file containing a list of known binding sites which are used to constructor model of binding site or motif. The file can be in two formats - FAS or TXT files. Loading options file If run from the command line with an options file as parameter, JFITOM functions according to the options set in the options file. If no options file is specified as the command line parameter, it looks for an options file in the default folder (<JFITOM home directory>\config\ options.conf). If the options file is not available in the default location, it runs with factory settings. If the options file is missing any parameter, the value of the parameter is used from factory settings. When the user is running the GUI, the options are saved in the default path before generating the result. The following options are defined in the file. - latestGenomeFile: file path in standard format - latestSitesFile: file path in standard format - isPalindrome: Y if the binding sites are palindromic, else N - latestOutputFile: file path in standard format - scoreMethod: 0 for Ri, 1 for Ri x RSeq, 2 for ISeq and 3 for ISeq x RE (more details in following sections) - maxHysteresisLimit: maximum number of base pairs to be scanned looking for a gene (upstream or downstream located binding site) maxIntergenicDistance: maximum number of base pairs between genes to be reported as part of an operon - maxOperatorDistanceOut: number of base pairs upstream of a gene translational start site for a site to be considered “operator”. If maxed, the site will be labeled “intergenic”. - maxOperatorDistanceIn: maximum number of base pairs downstream of a gene translational start site for the site to be considered “operator”. IF maxed, the site will be labeled “intragenic” - resultSizeMethod: 0 if the absolute size or 1 if relative size is specified - resultSizeMethodValue: the size of the list - thresholdScoreMethod: 0 if the threshold is an SD band and 1 if the threshold is normalized - thresholdScoreValue: the threshold score - saveOptions: Y if the user wants to save the options to the file before generating result, else N - generateLog: Y if the user wants to generate log messages, else N 6 - • viewResult: Y if the user wants to view the result immediately, else N (applicable only if Microsoft Excel is installed) Set output path The user can specify the path where the output file should be generated. Main operation Here we describe the main modus operandi of the program. As mentioned above, JFITOM loads the sequence and site files before start processing. Parsing the genome After loading the genome file, JFITOM parses it and extracts the genes. The genes are stored in an annotated list in the memory. Position specific weight matrix and information content The site file is then used to compute the motif position-specific frequency matrix (PSFM). This is a matrix of the relative frequencies of each nucleotide at each position in the motif. If the user specifies that the sites are palindromic then JFITOM reverse complements the sequences of all sites and appends them to the site collection before generating the PSFM. The following is a demonstration of consensus computed from the frequency of nucleotide: A C G T Consensus 1 0.031 0.928 0.007 0.031 C 2 0.055 0.015 0.206 0.722 T 3 0.650 0.015 0.166 0.166 A 4 0.349 0.071 0.031 0.547 T 5 0.309 0.158 0.079 0.452 T 6 0.007 0.007 0.976 0.007 G From the PSFM, the information content of the motif can be computed according to the following formula: L L L RSequence = ∑ I (l ) = ∑ ( H before (l ) − H after (l )) = ∑ − ∑ ( f ( S ).(log 2 ( f ( S )))) − − ∑ ( p ( S l ). log 2 ( p( S l )) ) l =1 l =1 l =1 S∈Ω Sl ∈Ω - f (S ) – frequency of base S in the genome p (S ) – frequency of base S in the motif PSFM - H before – a priori entropy - H after – entropy after observing binding - 7 as described by Schneider et al. (Schneider, Stormo et al. 1986) and based on the assumption of positional independency among the different positions of a binding site. The information content of a motif tells us about the reduction in uncertainty we experience once we know that a protein (or other element) binds to a sequence (Schneider, Stormo et al. 1986; Erill and O’Neill 2009). Prior to binding, our uncertainty about what bases occupy the different positions of a sequence is maximal, and dictated by the base composition of the genome. Once we know that the protein associated with the provided motif binds that sequence, however, we have much less uncertainty about what bases occupy the different positions. We still have uncertainty, because protein binding is a noisy issue, but we have decreased our uncertainty and, thus, we can say we have gained information. Conversely, seen from the point of view of a genome, the information content can also be seen as the loss of entropy at certain regions in the genome, from an initial random state to a state of fixation of conserved binding sites. Thus, motif information content can also be as an index of the level of redundancy (RI) in the different positions of the motif (O’Neill 1998). Even though without a complete theoretical justification, a different index termed relative entropy (RE) has been proposed to substitute the RI in cases of heavily skewed genome: p(S l ) RE (l ) = ∑ p ( S l ). log 2 S∈Ω f (S ) Relative entropy (Schneider, Stormo et al. 1986; Erill and O’Neill 2009) is also computed by JFITOM and can be used in different ranking methods. Ranking methods Rsequence tells us how much information our motif conveys, but it does not provide answers to how well a particular sequence fits in the motif profile, which is what is required to scan for and rank putative binding sites. Several ranking methods have been proposed with diverse degrees of theoretical justification. JFITOM provides a basic scoring method that can be used to rank putative binding sites. The sequence information content (Ri) (Schneider 1997) is a method derived from the information content (Rsequence) formula that scores each position of a particular site (j) based on ratio of frequency in the motif with respect to genomic frequency for the particular base observed in the site: 8 Ri (l ) = − ∑ [ f ( S ). log 2 ( f ( S ))] − [− log 2 ( p ( S i ,l ) )] S∈Ω This ranking method discards information from other motif base frequencies. As explained in (O’Neill 2003), this can lead to erroneous scoring, where the same score may be given to little or heavily conserved positions since information about the redundancy of each position (the information from the rest of bases at that position discard by this method) is not used. To correct this, O’Neill proposed averaging this kind of methods with the known redundancy index of the collection (O’Neill 1989), so that the final score was given by: L Ri .Rsequence = ∑ Ri j (l ).Rsequence (l ) l =1 Another ranking method can also be: L I Sequence .RE = ∑ I iSequence (l ).RE (l ) , based on the RE formula. l =1 Figure 3 demonstrates how to choose different methods from the GUI. The user can also specify the ranking method in the options file. Filtering the search results JFITOM allows the user to generate a selective list of results. To limit the list by size, the user can set the maximum size by a number, like N sites, or a percentage of the number of genes, for example N% of the total number of genes in the genome (please refer to Figure 5). JFITOM allows the user to specify the threshold score in two different ways. If the user specifies a normalized threshold JFITOM computes the maximum and minimum score of the given collection of binding sites. Then this maximum to minimum range is converted to a range of 1.0 to 0.0. Finally, from the user given threshold, the effective threshold is calculated back in the original scale. If the user specifies the threshold as standard deviation from mean, JFITOM computes the standard deviation of the scores of the binding sites from the user given collection. Then this value is multiplied by the user input and used as the threshold value (please refer to Figure 5). Annotating the genes After building the list of site, JFITOM annotates each site with the following information. - category (whether the site is ‘intergenic’, ‘intragenic’, ‘operator’, ‘isolated’ or none of these) - relative position (distance from the first Gene) 9 - genes (a LinkedList of co-regulated Genes) JFITOM allows the user to set following parameters for annotation, - Gene search hysteresis: JFITOM uses this value as the highest limit up to which it will scan for the first forward Gene for downstream search or the first reverse Gene for upstream search around a site. If no gene is found within the hysteresis in either direction, the site will be marked as ‘isolated’. - Intergenic distance: On upstream or downstream region, when JFITOM finds the first gene it looks for the co-regulated genes in an operon configuration. These genes may be separated at most by this distance. If no gene found, JFITOM stops searching for the site for that region. - Operator distance: When a site is found in an intergenic region, JFITOM further checks if it is within the operator distance from the start of the closest gene. If it is, the site is an ‘operator’ site; otherwise, it is an ‘intergenic’ site. - Maximum intragenic distance: When a site is found inside a gene, JFITOM further checks if it is within the maximum intragenic distance from the start of the gene. If it is, the site is an ‘operator’ site; otherwise, it is an ‘intragenic’ site. Annotation information is determined both for the upstream and downstream area of the site. A site can be one of the following categories, - Operator: if the site is within the maximum operator distance of a gene on either side. The user can set this limit for the intergenic and intragenic sites individually. - Intergenic: if the site is between two genes and beyond their operator limit. - Intragenic: if the site is inside a gene but after the maximum operator distance. - None: if no gene is found during a search. - Isolated: if the category of the site is None for both up and downstream. Intragenic Reverse Operator (Intragenic) Operator Forward Intergenic Forward Figure 7. Binding site categories based on relative distance to genes. The relative position for a site is determined as the distance between starting position of the site and the annotated starting position of the closest regulated gene. 10 Special cases of annotation Maximum hysteresis limit Reverse Correct Genes but beyond hysteresis limit x Forward x Forward x Figure 8. For this site, JFITOM found no genes during downstream search. Maximum intergenic distance Forward √ Forward √ Forward √ Forward √ Forward x Figure 9. For this site, JFITOM ignores correct genes beyond maximum intergenic distance. Generating output After running from the command line or from a script, JFITOM saves the scored and annotated binding sites as a CSV file in the <JFITOM home directory>\output directory and terminates. If the user is running the GUI, JFITOM will save the options before starting the main operation. If the user wants to see the details in a log file she has to select the Generate log files check box. To view the result instantly she can select View the result file before clicking the Generate result button. The user can also use the default options by clicking the Restore default options button. In the GUI the user can also specify the output file destination. The first column of the CSV file contains ‘@’ symbol to distinguish each result site. For each of them, the columns are as follows: - Position – the position of the site in the Genome - Score – the score of the site - Strand – on which strand does the site resides 11 - Site – the sequence - Up category – upstream category - Down category – downstream category - Up relative position – relative position regarding the first upstream gene - Down relative position – relative position regarding the first downstream gene - Genes – annotated list of upstream and downstream genes ordered according to their position 12