1
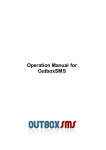
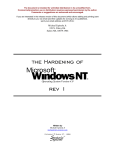
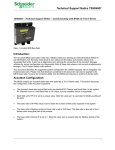
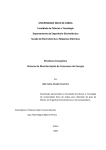
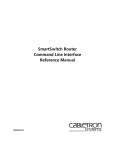
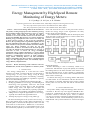
National Conference on Emerging Trends in Computer, Electrical & Electronics (ETCEE-2015) International Journal of Advance Engineering and Research Development (IJAERD) e-ISSN: 2348 - 4470 , print-ISSN:2348-6406,Impact Factor:3.134 Energy Management by High Speed Remote Monitoring of Energy Meters P. L. Upadhyay1 , K. M. Vyas2 , A. K. Vibhakar3 1 Department of Electronics & Communication, AITS, Ra jkot, Gujarat Technological University 2 Asst. Prof. Department of Electronics & Communication, DIET, Rajkot Asst. Prof. Department of Electronics & Communication, AITS, Rajkot Abstract— How Can We Manage What We Do Not Measure? meter and stored at the server. So the person who wants to The primary working of high speed remote monitoring of energy monitor the energy usages of the organisation can easily meters includes fetching of data from energy meters i.e. voltages, monitor at his personal computer. currents, power, power factor etc. and send that data to Also GSM Module is interfaced with the developed system controller or server. The interface between server & meters will which can able to send text mes sages as a form of alarm fro m be based on MODBUS RTU protocol over TCP/IP via Ethernet. database to the concern people. 3 Reducing energy consumption as well as waste is now widely seen as being good for economy, as well as good for environment. However, the top management of organization typically does not have the information about their energy consumptions, so they make informed to take proactive decisions about their facility's energy use. Energy initiatives too often are one time improvements if that are not monitored & measured properly over time the benefits of these improvements are soon lost to avoid this we have to observe the energy consumption continuously. Energy Remote Monitoring is a perfect solution that delivers a visible impact to the base line. Using Web-based technology, Communication protocols & GS M technology, energy remote monitoring delivers real time information, analysis, and guidance that allow executives to understand their energy use, take appropriate action, and continually improve energy efficiency and performance. Fig. 1 Basic block diagram of the system Keywords— Remote monitoring, Serial to Ethernet converter, MODBUS RTU, TCP/IP, GUI (Graphical User Interface), GS M. I. INT RODUCTION The "Energy management" is a term that has various mean ings, but mainly concerned with the one that relates to ―saving energy‖ in every sector. Energy saving & energy management includes the process of monitoring, controlling, and conserving energy in a building or o rganizat ion. Typically this involves the follo wing steps: 1. Metering energy consumption and collecting the data. 2. Finding opportunities to save energy, and estimating how much energy each opportunity could save. One would typically analyze its meter data to find and quantify routine energy waste, and might also investigate the energy savings that could make by rep lacing equip ment (e.g. lighting) or by upgrading your building's insulation. 3. Taking action to target the opportunities to save energy . Typically start with the best opportunities first. 4. Tracking the progress of energy-saving efforts [1]. The basic block diagram of the system is shown in fig. 1. Here at the industry there are many plants and the load of a particular p lant is connected to the respective meter. The data of the meter is in serial fo rm i.e. RS485 & it is converted to Ethernet & send to the server. A GUI installed in the server that continuously updated by the data which is given by the Remote Monitoring: Remote Monitoring is same as telemetry. Define as to perform the measurements of physical quantity and sending the readings (data) to the main controller at the distance. For this the measuring device is must capable to commun icate with other devices & must contain some co mmunication link either wired o r wireless [2]. To measure the energy we use Energy Meters that meters are smart meters. It can communicate with the other devices like co mputer or controller. Electronic energy meters contains memo ry that can store the data and able to send that data serially. II. SYST EM A RCHITECT URE The system is mainly co mposed of Energy meters wh ich are connected in RS 485 loop and supports MODBUS RTU protocol for communication & used to measure the various parameters related to Electrical power, Serial to Ethernet converter to convert the serial data to Ethernet packets & viceversa, Router for LAN, Central Monitoring system server & GSM Module. The system architecture is shown in the figure 2 [3]. National Conference on Emerging Trends in Computer, Electrical & Electronics (ETCEE-2015) International Journal of Advance Engineering and Research Development (IJAERD) e-ISSN: 2348 - 4470 , print-ISSN:2348-6406,Impact Factor:3.134 Features of energy meter are as below: All electrical and electronics quantity like current, power, voltage, apparent power, real power, frequency etc. Consumption/production of old load and o ld energy on hours features available. Primary and secondary CT/PT ratio is programmab le for both. RS-485 Co mmunication, RS-485 Modbus RTU protocol. 4 dig it password setting is available. DIN Standard 96X96 mm is co mpatible for outside dimension. Class of accuracy is 1.0(0.2, 0.5 accuracy on request). High-brightness LEDs display (Red-for value, alpha numeric green-for parameters). IEC 62052-11 IEC 62053-22 IEC 62053-23 –standard. B. RS 422/485 to Ethernet converter: Fig. 2 System Architecture The main functions of the system are; 1. To measure the electrical quantities like voltages of individual phase w.r.t. neutral as well as phase to phase voltages, Phase currents as well as total current, Active Power, Energy etc. & sends data via RS 485 interface when queried by server [4]. 2. To transmit the data and set point values of various parameters over LAN by help of RS 485 to Ethernet converter [5]. 3. To display current value of various parameters on to the GUI & it is installed at central mon itoring system server using local area network. 4. To store & create the database at server so the data can be accessed when it is required in future. 5. To transmit the current value of given parameter if it crosses the set point values by help of GSM module to the concern people via SM S [6]. III. HARDWARE & DESCRIPTION The Monitoring system main ly consists of Electronic Energy Meters & a Serial to Ethernet Converter. The selection of energy meters depends upon application here the energy meters selected on the co mmun ication basics with serial (RS 485) co mmunication and supports MODBUS RTU protocol. The energy meter used in this project is EM FIS -VIFPE made by SOCOMA C, GERMANY. The serial to Ethernet converter used in the pro ject is WIZ108SR. It has lo w power consumption and robust to use in industrial environ ment [5]. A. Energy Meter This serial to Ethernet converter is gateway module that converts RS-485/422 protocol into TCP/IP p rotocol. This converter enables remote management and control of a device through the TCP/ IP network by connecting to the existing equipment with RS-422/ 485 serial interface. Means similarly WIZ108SR is a protocol converter that transmits the data sent by serial equip ment as TCP/IP data type and converts back the TCP/ IP data received through the network into serial data to transmit back to the equipment. WIZ108SR configuration: Fig. 3 is configuration tool version 1.4.4.0 wh ich is open licence software used to configure the WIZ108SR module. First turn on the power supply to configure the module and required connections of LAN cable to exiting LA N. After this start the configuration tool. The window shows various options [5]. National Conference on Emerging Trends in Computer, Electrical & Electronics (ETCEE-2015) International Journal of Advance Engineering and Research Development (IJAERD) e-ISSN: 2348 - 4470 , print-ISSN:2348-6406,Impact Factor:3.134 Fig. 3 Configuration tool version 1.4.4.0 [5] IV. SYST EM SOFTWARE There are two type of software is used one is visual studio 11, and it is used to do programing for collecting data fro m the meter and the programming fo r the notification service via GSM module as well. And second is M YSQL 5 it is used to maintain database in the central mon itoring system serv er and display that data on the GUI (Graphical user interface).The following flow chart for remote monitoring system is shown in fig. 4. The notification modu le is activated when entered condition is satisfied, as a result the SMS of alert fro m the system is sent to the concern mobile nu mber. The auto generated SMS fro m the system is shown in fig. 6. START Get Data from the meters using MODBUSRTU Protocol Update the timestamp for the data No New updated Data? Yes Update the Data in Database Fig. 5 GUI shows real time data Data value > or < the defined value for notification? No Yes Add to Notification Module Fetch latest Data from Database & Show in a Webpage START Again Fig. 4 Flowchart of the Monitoring System The comp lete GUI is has been developed using visual studio 11. Visual studio is specialized software fo r designing graphical user interface as per requirement. The designed GUI is also able to create database of the previous measured values of various parameters of electrical power. Developed GUI is access to monitor real time data over LAN on to the PC or laptop to monitor the data remotely. Also the user can set the values for the notification & notification timeout as well which is compared with the real t ime values. V. RESULT S As a result of experiment, it can be said that concern people are able to monitor the real time data of their energy usage. Fig. 5 shows the GUI which shows real time data. The data measured by meter is updated continuously and it can be monitor fro m the remote place. Fig. 6 Auto generated SMS from the system VI. CONCLUSIONS National Conference on Emerging Trends in Computer, Electrical & Electronics (ETCEE-2015) International Journal of Advance Engineering and Research Development (IJAERD) e-ISSN: 2348 - 4470 , print-ISSN:2348-6406,Impact Factor:3.134 Remote monitoring is the first step towards control a system remotely if we have data on the real t ime bases then we can control the critical applicat ions & also it can provide alerts by simp ly interfacing another commun ication technology like GSM or Internet and can communicate with concern people. This project is taken as a part of IDP (Industrial Define Project) and thankful to Depart ment of Electronics & Co mmunicat ion Engineering, AITS, Rajkot & Darshan Institute of Engg. & Tech., Rajkot, India for their kind supp ort. GSM Module interface makes this system worthy because alert as well as total report on the end of the day will be available on the mobile which is very handy. This concept is further used in smart grid, can be used to monitor the load pattern of the part icular area. This system can be used in BEMS (Bu ild ing Energy Management System). A smart system can communicate with any other systems which make this system applicable in nu mber of fields. [1] [2] [3] A CKNOWLEDGMENT [4] [5] [6] [7] REFERENCES http://www.energylens.com/articles/energy-management http://en.wikipedia.org/wiki/Telemetry Nicholas McLauchlan, Nik Bessis, Towards Remote Monitoring of Power Use: A Case for Smart Meters. 2011 Sixth International Symposium on Parallel Computing in Electrical Engineering. Technical Note on MDBUS by Schneider Electric 70022-0119-04 12/2007. WIZ108SR user manual version 1.0 by WIZNET. GSM AT Commands specifications. Emfis-vifpe data sheet, operation & instruction manual, by HPL Electric & Power Pvt. Ltd.