1
Java Card Secure Information flow tool
JCSI Version 1.2, April 2012
User Manual
Marco Avvenuti
Cinzia Bernardeschi
Nicoletta De Francesco
Paolo Masci
Department of Information Engineering
University of Pisa, Italy
1
Contents
1 Introduction
3
2 JCSI
2.1 GUI description . . . . . . . . . . . . . . .
2.2 Loading the CAP file and the Export files
2.3 Setting the parameters for the analysis . .
2.4 Performing the analysis . . . . . . . . . .
2.5 Viewing the details of the analysis . . . .
3 The
3.1
3.2
3.3
.
.
.
.
.
.
.
.
.
.
.
.
.
.
.
.
.
.
.
.
.
.
.
.
.
.
.
.
.
.
.
.
.
.
.
.
.
.
.
.
.
.
.
.
.
.
.
.
.
.
.
.
.
.
.
.
.
.
.
.
.
.
.
.
.
3
3
3
6
8
14
DeCAP tool
15
Menu . . . . . . . . . . . . . . . . . . . . . . . . . . . . . . . . . 15
The component browser . . . . . . . . . . . . . . . . . . . . . . . 16
The description window . . . . . . . . . . . . . . . . . . . . . . . 17
2
1
Introduction
A Java Card applet is a smart card application written in the Java programming
language, according to a set of conventions (ISO 7816) that regulate programs
running in small footprint devices. Java Card applets are compiled by the
standard Java compiler [1]. An off-card component, the Converter, takes the
compiler’s output and performs checking, optimization, name resolution and
linking. A compact representation of the applet code is saved in the CAP
(Converted APplet) file.
CAP files are the loading units in Java Card. They include the necessary
information to install and execute applets in the Java Card Runtime Environment (JCRE) [2]. CAP files are very similar to class files. Nevertheless, while a
large number of tools to analyze class files is available, the software community
still lacks of similar tools for CAP files.
The JCSI tool performs a static analysis of CAP files in order to study the
information flow generated by the code.
Included in JCSI, the DeCAP tool enables the analysis by converting a CAP
file into a structure conforming to the Java Card Virtual Machine Language
(JCVML) specification.
2
JCSI
2.1
GUI description
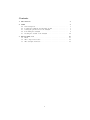
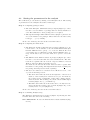
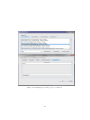
The JCSI’s graphical user interface (Figure 1) includes a status window (1),
three function buttons (2, 3, 4), one tool button (5) and one help button (6).
The analysis of a CAP file is carried out through the following steps:
1. Load the CAP file and the necessary Export files (Subsection 2.2)
2. Set the parameters for the analysis (Subsection 2.3)
3. Perform the analysis (Subsection 2.4)
4. View the log file (Subsection 2.5)
2.2
Loading the CAP file and the Export files
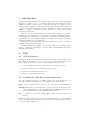
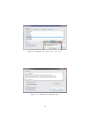
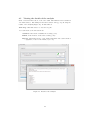
To load a CAP file and the needed Export files, click on the Open button. A
new window Open Files will pop-up, showing the following buttons:
Open: a file browser window is opened to choose the desired CAP (Figure 2).
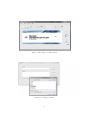
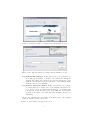
Add/Remove: a file browser window is opened to add/remove the Export files
of the package (Figure 3). To automatically load JCRE API Export Files,
select Automatically Load JCRE API Export Files.
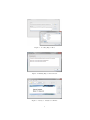
Ok: to confirm the chosen files. Missing Export files, if any, are listed as in
Figure 4.
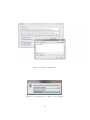
When the CAP file and all the necessary Export files have been successfully
loaded, the main GUI is shown telling the user that the analysis of the information flow can start (Figure 5).
3
Figure 1: The JCSI tool main window.
Figure 2: Loading a CAP file.
4
Figure 3: Loading Export files.
Figure 4: Missing Export files window.
Figure 5: Ready to analyze a CAP file.
5
2.3
Setting the parameters for the analysis
The verification process starts by clicking on the Analyze button. The setting
of parameters for the analysis follows three main steps:
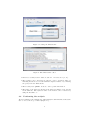
Step 1. Configuring packages’ names
1. The JCSI Analysis Wizard window is prompted (Figure 6) to allow
the user to set the number of packages that are already installed on
card. The CAP files for these packages are not required.
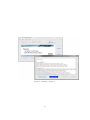
2. Through the Package Names Editor window (Figure 7) the user can
choose the names for the packages. These names are used as security
levels (p0 , · · · , pn , by default).
At the end of this step the user clicks on the Next button.
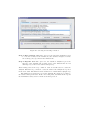
Step 2. Configuring the Ambient file
1. The Analysis Setup Loader window is prompted (Figure 8) to allow the user to choose whether to use the default Ambient file (Use
Default Ambient File option), or to load the Ambient file from
a previously saved configuration (Load Custom Ambient File option). In the latter case, a browser window is opened to select the
file.
2. The Ambient File Editor window is prompted (Figure 9) to allow
the user to view and customize the selected Ambient file. The Ambient file is organized in four sections: Imported Methods, Internal
Methods, Exported Methods and Heap Section.
For methods, the window shows the method’s name together with
information on the package that implements the method ( name) and
the package that imports the method (∧name).
3. The user can either select a method from a Method section, or an
object from the Heap Section:
• The View Selected button shows the signature of the selected
method, or the security level of the selected object. For methods,
the security levels of arguments, return value, calling environment are shown. The security policy is also shown within angled
brackets (Figure 10, e.g. h airfrance i).
• The Edit Selected button allows the user to modify the security levels and the security policy of methods (Figure 11), or the
security levels of objects (Figure 12).
At the end of this step the user clicks on the Next button.
Step 3. Confirming Analysis Setup
The Analysis Setup window is prompted (Figure 13) showing the Ambient file. The user can set the following:
Save Ambient file: To save the Ambient file for future utilization (Figure 14)
6
Figure 6: Setting the number of packages already installed on card.
Figure 7: Choosing the names for packages already installed on card.
Log Ambient File Changes: If this option is selected, a text file is created that logs all changes occurring to the ambient file during the
analysis. By default, the text file is stored in the same folder of the
CAP file, and its name is given by the name of the CAP file under
analysis followed by a timestamp.
Log Abstract Interpreter States: If this option is selected, a text file
is created that logs a complete trace of the analysis performed by the
tool. As for option ”Log Ambient File Changes”, by default, such
text file is stored in the same folder of the CAP file, and its name
is given by the name of the CAP file under analysis followed by a
timestamp.
At the end of this step the user clicks on the Next button. The analysis
starts as described in the next section.
In the tool, the following conventions are used:
7
Figure 8: Loading the Ambient file.
Figure 9: The Ambient file editor.
• Given two security levels a and b, notation a + b is used for { a, b }.
• The security policy ”all levels are allowed” can be expressed either by
including the whole set of levels within the angled brackets or by omitting
the policy from the Ambient file.
• The security level .public. is used to denote public information.
• The name of the method is shown as the method’s number, as it appears
in the CAP file. The symbolic name of the method can be retrieved by
using the DeCAP tool.
2.4
Performing the analysis
At the beginning of the analysis, the JCSI Analysis Wizard window allows the
user to choose the stop condition (Figure 15):
8
Figure 10: Selecting and viewing a method.
Stop at first violation: With this option set, the data-flow analysis stops as
soon as the security levels calculated by the abstract interpreter violate
the security policy specified in the Ambient file.
Stop at fixpoint: With this option set, the data-flow analysis stops at the
fixpoint of the analysis (the security levels of the Ambient file are left
unchanged by a run of the abstract interpreter).
After having selected the stop condition, click on the OK button to start the
analysis. When the stop condition occurs, the result of the analysis are reported
in the Java Card Information Flow Verifier 1.2 main window (Figure 16).
The Analysis Log window reports the Ambient file updated according to
the abstract interpreter rules. At the end of this phase, the Ambient file reports
the maximum security level for methods and heap section.
9
Figure 11: Changing the security policy of a method.
10
Figure 12: Changing the security level of an object.
Figure 13: Confirming the Analysis Setup.
11
Figure 14: Saving the Ambient file.
Figure 15: Choosing the stop condition for the analysis.
12
Figure 16: Analysis completion.
13
2.5
Viewing the details of the analysis
Click on the Details button of the Java Card Information Flow Verifier
1.2 main window. The Analysis Details window will pop up, showing the
results of the analysis (Figure 17). In this window:
View Log: Click this button to view the Log file.
For each method, the window shows:
Verified, if the method satisfies the security policy.
Failed, if the method violates the security policy.
Report: Click this button to view detailed information about the method
(signature, reason of the failure, bytecode).
Figure 17: Details of the analysis.
14
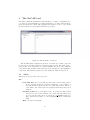
3
The DeCAP tool
DeCAP is a CAP file disassembler and visualizer tool. The tool simplifies bytecode inspection and analysis by resolving information coded in tokens and showing it in a mnemonic format. The graphical user interface of the tool reports all
the information stored in binary CAP and export files.
Figure 18: The DeCAP tool window.
The DeCAP window (Figure 18) is made of a menu (1), a CAP component
browser (2), a description window (3) and a status bar (4). The CAP component browser is an expandable tree which simplifies the view of the CAP file
components. The description window shows a text description of the highlighted
component. The status bar guides the user during the CAP file inspection.
3.1
Menu
Functions are grouped into four categories:
File :
Load CAP File: To load a CAP file and begin a new working session.
In the description window a message signals the correct loading of
the CAP file and requests the user to load the Export files. The root
of the CAP component browser tree has the same name as the loaded
CAP file.
Add Export File: To load an Export file. Note that the Export files
associated to the chosen CAP file are loaded automatically if they
are stored in the same directory and if the JC HOME setting (see
Edit – Preferences) refers to a correctly installed version of Java Card
SDK.
Exit: To exit from DeCAP.
15
Edit :
Preferences: To set program options. In the General tab (Figure 19
(1)) the Show Method’s Name checkbox enables the name lookup,
within the Export files of methods invoked, when displaying bytecode informations. The Verbose debug option enables debug messages relative to this tool development. The Environment tab (Figure 19 (2)) lets the user choose a Java Card SDK, a Java Runtime
Environment and the filename of the cref EEPROM image file.
Tools :
System log: To show the application log.
Cap file analysis: A set of functions to gather information on CAP file
structure.
Help: Program version and license information, and this help document.
Figure 19: Preference dialogs: General tab (1), Environment tab (2).
3.2
The component browser
The CAP file and the Export files are represented in an expandable tree structure that allows the user to select nodes and view leaf values. After a CAP file
has been loaded, the root of the tree automatically takes the name of the loaded
CAP file.
An example is shown in Figure 20. Component airfrance.cap is expanded
into the following subcomponents: header component, directory component,
applet component, import component, constant pool component, class component,
method component, static field component, reference location component,
export component and descriptor component.
The header component is split into various subcomponents. Among them,
the subcomponent this package contains the AID of the Cap file.
16
Figure 20: The component browser.
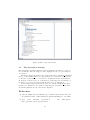
3.3
The description window
The description window displays general, multi-line information on the selected CAP file. The following procedure displays the bytecode representation
of a method.
Referring to Figure 20, with a double click expand the node method component,
then go to the Method info node and expand it. For each method, a node will
be shown to represent the root of a subtree containing the method’s information.
To show the complete bytecode of the method, expand the bytecode attribute of
the method, i.e. the node labeled with the first bytecode instruction.
As an example, Figure 21 shows the bytecode of method method 254, whose
length is 38. Instruction are numbered following the program counter value.
For Invoke instructions, the token is also displayed.
References
[1] Chen, Z. (2000) Java Card Technology for Smart Cards: Architecture and
Programmer’s Guide. Addison-Wesley Longman Publishing Co., Inc, 2000.
[2] Java
Card
Platform
Specification.
http://java.sun.com/products/javacard
17
Sun
Microsystem.
Figure 21: The bytecode representation in the description window.
18