1
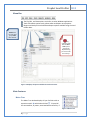
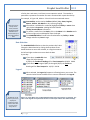
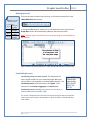
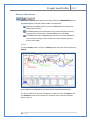
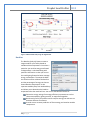
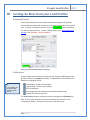
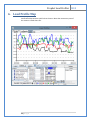
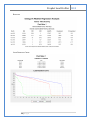
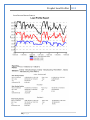
Automated Energy, Inc. Prophet Load Profiler User Manual Prophet Load Profiler 2013 1|Page Prophet Load Profiler 2013 Table of Contents I. About the Load Profiler .................................................................................................................. 4 Menu Bar ....................................................................................................................................... 5 Main Features ................................................................................................................................ 5 Meter Tree ............................................................................................................................. 5 Date Selection ........................................................................................................................ 6 Legend ................................................................................................................................... 6 Binning Intervals .................................................................................................................... 7 Contributing Factors .............................................................................................................. 7 History & Chain Feature ........................................................................................................ 8 Zoom ...................................................................................................................................... 9 Forecasting ............................................................................................................................ 9 Analysis Features ......................................................................................................................... 10 Normalized Daily Usage ....................................................................................................... 10 Baseline................................................................................................................................ 11 Load Duration Curve ............................................................................................................ 12 II. Using the Load Profiler .................................................................................................................13 Compare Mode ............................................................................................................................ 13 Single Facility- ...................................................................................................................... 13 Multiple Facilities................................................................................................................. 14 Aggregate Mode .......................................................................................................................... 15 Slider Bar.............................................................................................................................. 15 Statistics ....................................................................................................................................... 16 Detail Mode ................................................................................................................................. 17 III. Getting the Most from your Load Profiler ....................................................................................18 Automated Reports ..................................................................................................................... 18 Notifications................................................................................................................................. 18 2|Page Prophet Load Profiler 2013 Reports......................................................................................................................................... 19 IV. Load Profile Map ...........................................................................................................................22 APPENDIX – REPORT SAMPLES ............................................................................................................23 USAGE COMPARISON ...................................................................................................................... 23 BASELINE ........................................................................................................................................ 24 LOAD DURATION CURVE .................................................................................................................. 24 NOTIFICATION SAMPLES ................................................................................................................... 25 LOAD PROFILE REPORT SAMPLE ........................................................................................................ 26 CSV (COMMA SEPARATED V ALUE) REPORT ....................................................................................... 27 COINCIDENT KW REPORT ................................................................................................................ 28 3|Page Prophet Load Profiler 2013 I. About the Load Profiler The LOAD PROFILER begins in Compare mode, but many features are available while the Profiler is in Compare, Aggregate, or Detail Mode. The Legend and Statistics features, when selected, will reflect the commodities/meters in the Graph and Data tables. The Slider Bar, which can show potential cost savings, is only available while the Load Profiler is in the Aggregate Mode. Figure I-1The initial default view of the LOAD PROFILER. The Meter Tree (#4) will be populated with all facilities associated with your login. The LOAD PROFILER begins in Compare Mode The default Binning selection is ¼ hour. The Initial Date is the previous day. All Facilities are shown with the number of meters in parenthesis 4|Page Prophet Load Profiler 2013 Menu Bar The File, Edit, and View options are similar to other Windows applications. Tools offer Admin options such as Rate editor and Report set-up options. Reports and Analysis lists the different Report options available using the Load Profiler data. Buttons will turn from light grey to dark when selected. Any selections made with the Edit or View options changes the default settings for all users with the same login. Figure I-2 Displays all options available for each menu item. Main Features Meter Tree The Meter Tree window displays all your Facilities with an expansion switch , which when clicked will reveal all the commodities, by meter, associated with that facility. If Figure I-3 Meter Tree 5|Page Prophet Load Profiler 2013 a facility has a sub-meter, it will have its own expansion switch. The number in parenthesis represents the number of meters associated with a particular facility. For example, in Figure 1-3, Indiana – Schools has three associated meters. Commodities can be view by Facilities (default), City, States, Regions, Meters, Utilities, Sub-Meters or by a custom grouping. Information is available for a selected (highlighted) Facility or meter when right-clicked→ Properties →dialog box with selected Facility/Account/Meter information. To remove a meter from the Graph, click on the Meter in the Databox and it will turn a light color and disappear from the Graph. The LOAD PROFILER will need to be refreshed after any Facility or Mode change and after any Date change. When you select a Facility and its meters, both the aggregate and the individual meter data will show up in the graph and data table. Date Selection The LOAD PROFILER defaults to show the previous day’s data. Change the date selection by clicking the drop down arrow beside the date to access the calendar, or using the arrows to the left and right to advance or move back the date by one day. If you select a LoadProfile date range of 9/14/12 through 9/18/12, the last Meter Reading will be Time Stamped as 9/19/12 00:00. If you select a date range of 9/01/12 through 9/30/12, the last Meter Reading will be Time Stamped as 10/1/12 00:00. Legend When selected, the Legend will appear as a floating box on your screen. The selection below shows the difference in contents reflected in the Legend. The Data Bar at the bottom of the screen displays the coordinating colors and the meter data as cursor moves along the bar. Figure I-4 In the Meter Tree, Indiana-Manufacturing and its two meters are selected. The colors in the legend correspond with the lines on the Graph and the Data Table headings. 6|Page Prophet Load Profiler 2013 Binning Intervals Intervals are for the PAST 15 minutes. For example, st 1 15 min 00;15 of usage nd 2 15 min 00:30 of usage rd 3 15 min 00:45 of usage th 4 15 min 01:00 of usage There are 96-meter reads per day occurring, in 15-minute intervals which is the LOAD PROFILER default setting. . To change the Bin selection, simply click on the desired interval to select and the Graph/data screens will automatically update to reflect interval choice. Note: The date range on the date bar must be large enough to accommodate the Bin selection. Figure I-5 Shows the Binning selection as "week" but the date selection is only one day. Contributing Factors Contributing Factors are meter specific. This is data that can have a significant effect on your commodity usage. When you select a Factor, its data appears in the data table and Graph. The Contributing Factor will also be listed in the Legend. This is consistent in the Compare, Aggregate, and Detail modes. Contributing Factor knowledge may give the user the ability to control (reduce) the commodity usage. The current Temperature and Forecasts for the upcoming five days are imported several times each day from AccuWeather, and the forecast is recalculated after each update. 7|Page Prophet Load Profiler 2013 History & Chain Feature Selecting the History button (button turns dark) allows the LOAD PROFILER to view any time length in the Graph and data table to compare data. Selecting the History button activates the Chain button and reveals the History date selection. The History button places the data from the chosen date from the same selected meters/commodity in the Data Table and on the Graph. The Chain button links the History date and the current selected date for synchronized scrolling for direct comparison of data between past and present date ranges. History To use the History feature, click on the History button and select the Past date and Refresh. Figure I-6 Returned Load Profile for two selected meters and History button active The historic data for each meter will appear as a separate line on the Graph and in the Data Box for each meter selected. Ex. the North meter is black and Historic North is red, etc. 8|Page Prophet Load Profiler 2013 Chain To use the Chain feature the History button must be active. Click the Chain button (when selected Graphic will change from to and linking the current dates with the History date Use the back and advance arrows to scroll dates in synchrony. Zoom The Zoom feature expands a selected time frame within the Graph. To use the Zoom, Place the cursor at the desired starting point along the bottom of the Graph. While holding the left mouse button, drag the cursor to the desired end point and release. The Graph view changes to reveal the profile of the expanded time frame. Clicking anywhere in the Graph returns the display to the original setting Figure I-7 The second screen is the expanded view of the highlighted area.. Forecasting This feature allows you to set the “through” date up to five days (including today) into the future. The graph will predict what the load may be for tomorrow and the next several days. In Figure I-8 both the meter read and NORM graph lines merge and become lighter in color. Only the Temperature Line does not separate the Forecast Data from the Real Data. 9|Page Prophet Load Profiler 2013 Figure I-8 Returned Load Profile for Future dates Analysis Features Normalized Daily Usage From the Analysis Menu Tab, select Normalized Daily Usage to access this feature. With this report you can quickly see how each day differs from other days of the week. In Figure I8, each day’s kWh is “normalized” as compared to its weekly average. For example, if the average weekly usage is 200 kWh and a given day’s usage is 1,000 kWh then the normalized daily usage is +1,000 kWh. When looking at the chart in Figure I-8 you may expect all Mondays to be the same, all Tuesdays to be the same, etc. barring any unusual circumstances such as holidays that occur on a particular day. If some days exhibit a pattern that is higher or lower than the same days in other weeks, then you should investigate the reasons. Looking at the above example, we can make the following observations: Some of the weekend days are higher than the other days even though they may be near or below the weekly average, so you may want to address this and try and keep it from happening. These readings are more reasonable and close to those expected. It appears that some equipment is running late into the evening hours and in this case all night long. There may be other circumstances that create unusually low readings compared to other weeks during the month and you should take this into account when interpreting the Normalized Daily Usage. 10 | P a g e Prophet Load Profiler 2013 Figure I-9 Normalized Daily Usage for High School Baseline The Baseline (Analysis) Feature creates a usage model for your facility based on outside ambient temperature. You select a particular year and the energy used based on degree-days is calculated along with pertinent information so that you can use the model going forward to better manage energy consumption. The output includes the formula used to calculate the baseline and the percentage of energy use that can be attributed to temperature. It also separates weekday days from weekend days and allows you to determine the baseline temperature that the model will use. You can use the Baseline Feature to: Determine energy savings from energy efficiency improvements such as thermostat setbacks, lighting retrofits, or equipment upgrades. Benchmark a facility for weather and to compare energy use and costs on between different time frames. Provide a more accurate prediction of future energy use based on outside temperature. 11 | P a g e Prophet Load Profiler 2013 Insure your facility’s mechanical systems are performing as originally commissioned with Constant Commissioning. To see example, go to Baseline in the APPENDIX – REPORT SAMPLES. Load Duration Curve The Load Duration Curve is a quick look at your demand usage for both weekday days, weekend days and combined weekend and weekday days. It clearly shows how much your peak demand is and the percentage of time that it occurs – the goal being to minimize the peak as much as possible. To see an example, go to Load Duration in the APPENDIX – REPORT SAMPLES. 12 | P a g e Prophet Load Profiler 2013 II. Using the Load Profiler Compare Mode Figure IIII-1Returned Load Profile for Indiana-Manufacturing. The Facility is selected in the Meter Tree but deselected in the Data Table so it is not represented in the Graph Single Facility- When selected, IndianaManufacturing displays the Aggregate of its two meters. Make Facility/Meter selection (Use the Control/left-click option to make multiple selections) and Refresh. Select Date Range –In this case, the range is one day. Select Binning Options – In this example, the choice is the default of ¼ h. (If Day, Week, Quarterly, etc. is selected the date range must be large enough to reflect the bin selection.) Refresh (Refresh can be accomplished three different ways: 1. On Menu Bar View→Refresh; 2. Refresh Button; 3. Right-click Facility selection-Refresh). The Graph and Data windows now display the selected data. Use the Legend to identify Graph lines or place the cursor on a line for approximately 3 seconds and the name will appear. The colors of the lines will coincide with the colors of the meter name in the Legend, the Data box, and the Data Bar at the bottom of the screen. 13 | P a g e Prophet Load Profiler 2013 Multiple Facilities Compare two or more Facilities. When displayed, the Statistics for each Facility are the combined total for their meters. See Statistics for more information. Compare for two or more items displays the Aggregate* of each Figure II-2 Returned Load Profile for both Indiana Facilities in the Meter Tree Select the first Facility. Hold Ctrl, select second (or more) Facility. In the above example, the contributing Factor of Weather Temp is also selected and displayed as the red line on Graph 14 | P a g e Prophet Load Profiler 2013 Aggregate Mode Shows the total of the selected commodities selected. Using the same example as above, but with Aggregate active, the IndianaManufacturing and Indiana-Schools meter data are combined in the ELECTRIC (kWh) column. Statistics for selected Facilities are the combined total of both. See Statistics-Aggregate for more information. While the LOAD PROFILER is in Aggregate mode, the Slider Bar is active. Figure II-3 - Returned Load Profile in Aggregate mode Slider Bar The information displayed on the Slider Bar Line is an Above/Below Display showing: Percentage of kilowatt (kWh) demand reduction. Dollar amount of potential savings for percentage of kWh reduction. kWh reduction associated with the displayed percentage. Amount of time control required to achieve the reduction for the displayed percentage. Note: Monetary Value is based on rates in Rate Editor. If more than one rate is loaded into the Rate Editor, rate must be selected. 15 | P a g e Prophet Load Profiler 2013 Figure III-4 Returned Load Profile in Aggregate mode with Slider Bar active. Statistics Clicking the button will display the Consumption Statistics box with the associated meters. Select Commodity (Gas, Electric, or Water, depending upon the Facility) to display data. Consumption Statistics will also change with the selection of any of these Buttons: If the kilowatt demand (kW) is displayed by either the d = day; w = week, m = month, q = quarter, or y = year, then the kW in the Statistics and the kW listed in the Data Table will be shown as the average hourly demand for the time period. 1/4 h = 1 / 4 hour(15 minutes); 1/2 h = 1 / 2 hour(30 minutes); h = hour(60 minutes) d = day; w = week m = month; q = quarter; y = year From – Through Date Range Zoom Feature For Electric, the previous example is for the Total usg = Total Usage: for the Period (From-Date thru Through-Date). Avg usg = Average Usage: (based on all intervals). Peak day = Peak Usage day at date. Min day: = Minimum Usage day at date. MCF = 1,000 Cubic Feet. Energy 16 | P a g e Prophet Load Profiler 2013 Detail Mode When in Detail mode, the Load Profiler displays all the related aggregate statistics in the Data table, and the ELECTRIC (kWh) in the Graph area. To view larger amounts of data, click to switch the Graph and Data tables between the two display areas. Your screen will look similar to the example in Figure II-5. Figure II-5 Returned Load Profiler in Detail Mode with Graph and Data Table areas switched. 17 | P a g e Prophet Load Profiler 2013 III. Getting the Most from your Load Profiler Automated Reports These reports allow you to receive daily demand and usage data for selected Facilities/Meters and provide comparison to the same time period of the previous year. To create a new Report, simply click on the button and follow the step-by-step instructions. To view a sample report, go to Automated Report Sample in the APPENDIX – REPORT SAMPLES. Figure III-1 Initial Automated Report dialog box Notifications These are daily reports where you create your own settings establishing warning guards and alerts for a specific Commodity. The Notification results (failures) are based on the following criteria: Consumption can be electric kWh, gas MCF, water Gal, etc. Low Reading – based on Consumption High Reading – based on Consumption Zero Consumption Percentage either for the Above or Below Normal kWh usage. Number of consecutive periods The Load Profiler processes notifications every morning from the previous day’s data. If one or more tests fail, your chosen recipients will receive an e-mail containing the failures. If all four tests pass, no e-mail will be sent. 18 | P a g e Prophet Load Profiler 2013 Figure III-2Automated Report Dialog Box To create a Notification for a selected Commodity: To view the Normal kWh on the MenuView Normal; temperature is included in the algorithm Click on New, which will create an Untitled_1 for a New Customer Notification and default the Bin size to the lowest setting. Establish your Recipients. Select your Facilities and/or Meters for this Customer Notification. Note: This is an Aggregate of your selected Facilities/Meters. Adjust the Bin size to the desired interval. Select your desired tests the Notification is to perform. At least one is required. Reading <establishes a Low Reading threshold with your consecutive periods setting. Reading >establishes a High Reading threshold with your consecutive periods setting. Reading is Zero for your consecutive period setting. Reading differs from Norm based upon your desired percentage of the Normal kWh Usage and for your specified consecutive intervals. Note: An Error Message will display if Facility and/or Meter selections do not have kWh readings. Select your recipients from those displayed. Click Save. Enter a meaningful name for the new Notification up to 30 characters (ex. High School 50-15, based on the selections above.)To view a sample Notification, go to Notification sample in APPENDIX – REPORT SAMPLES. Reports 19 | P a g e Prophet Load Profiler 2013 The information on the Reports is directly related to the display selections on the LOAD PROFILER screen. Select to access menu: Figure III-3 Displays LOAD PROFILER Report options. 1. Load Profile Report: This report provides a Load Profile Chart and Statistics. 2. Load Profile CSV Report: Save table in CSV file (comma separated values); which can be Opened or Saved into a spreadsheet. All items that are in the Load Profile Data Table will be displayed to either include or exclude from the CSV file. The data is based on the “From– Through” Date Range or “the first – last of” data if the Zoom has been performed. The button moves all selections to the Include side. To move an item from either side, click on the item and use the appropriate arrow. Figure III-4Displays the initial (kWh) CSV selection dialog box. 3. Load Profile Gas CSV Report: The Gas CSV Report shows gas usage based on the standard Henry Hub time zone. This screen works like the above CSV Report. Note: The “From – Through” calendar dates are always used. The Zoom feature has no effect on this Gas CSV report. 20 | P a g e Prophet Load Profiler 2013 Figure III-5Displays the dialog box for Gas CSV selection. Note: The Reading time is at top of box. 4. Coincident KW - Summary Report: Provides a Coincident KW Summary for the selected time period. See Coincident KW - Summary Report: Provides a Coincident KW Summary for the selected time period. 5. Cost Comparison Report: Provides a comparison of costs using selected rates (Please see the Rate Schedule Entry Doc.) If one rate is selected it will be printed on the Report. If two or more are selected a Cost Comparison Report (Chart) is displayed. By clicking the headings, the Rate Names will give a variety of choices or reports. To go back use the X (close) in the upper right corner. Please see APPENDIX – REPORT SAMPLES to view all Report Samples. 21 | P a g e Prophet Load Profiler 2013 IV. Load Profile Map Load Profile Map contains quick links to the text. Move the mouse over parts of the screen to reveal short cuts. 22 | P a g e Prophet Load Profiler 2013 APPENDIX – REPORT SAMPLES USAGE COMPARISON 23 | P a g e Prophet Load Profiler 2013 BASELINE LOAD DURATION CURVE 24 | P a g e Prophet Load Profiler 2013 NOTIFICATION SAMPLES 25 | P a g e Prophet Load Profiler 2013 LOAD PROFILE REPORT S AMPLE 26 | P a g e Prophet Load Profiler 2013 CSV (COMMA SEPARATED VALUE) REPORT The report is exported and saved in an Excel spreadsheet which can be used for your use. 27 | P a g e Prophet Load Profiler 2013 COINCIDENT KW REPORT Click 28 | P a g e for Plant Meter 1 gives you