1
User’s Manual
R32C/100 E30A Emulator Debugger V.1.02
User’s Manual
Supported Devices:
R32C/100 Series
All information contained in these materials, including products and product specifications,
represents information on the product at the time of publication and is subject to change by
Renesas Electronics Corporation without notice. Please review the latest information published
by Renesas Electronics Corporation through various means, including the Renesas Electronics
Corporation website (http://www.renesas.com).
www.renesas.com
Rev.1.00 Dec 2010
Notice
1.
2.
3.
4.
5.
6.
7.
All information included in this document is current as of the date this document is issued. Such information, however, is
subject to change without any prior notice. Before purchasing or using any Renesas Electronics products listed herein, please
confirm the latest product information with a Renesas Electronics sales office. Also, please pay regular and careful attention to
additional and different information to be disclosed by Renesas Electronics such as that disclosed through our website.
Renesas Electronics does not assume any liability for infringement of patents, copyrights, or other intellectual property rights
of third parties by or arising from the use of Renesas Electronics products or technical information described in this document.
No license, express, implied or otherwise, is granted hereby under any patents, copyrights or other intellectual property rights
of Renesas Electronics or others.
You should not alter, modify, copy, or otherwise misappropriate any Renesas Electronics product, whether in whole or in part.
Descriptions of circuits, software and other related information in this document are provided only to illustrate the operation of
semiconductor products and application examples. You are fully responsible for the incorporation of these circuits, software,
and information in the design of your equipment. Renesas Electronics assumes no responsibility for any losses incurred by
you or third parties arising from the use of these circuits, software, or information.
When exporting the products or technology described in this document, you should comply with the applicable export control
laws and regulations and follow the procedures required by such laws and regulations. You should not use Renesas
Electronics products or the technology described in this document for any purpose relating to military applications or use by
the military, including but not limited to the development of weapons of mass destruction. Renesas Electronics products and
technology may not be used for or incorporated into any products or systems whose manufacture, use, or sale is prohibited
under any applicable domestic or foreign laws or regulations.
Renesas Electronics has used reasonable care in preparing the information included in this document, but Renesas Electronics
does not warrant that such information is error free. Renesas Electronics assumes no liability whatsoever for any damages
incurred by you resulting from errors in or omissions from the information included herein.
Renesas Electronics products are classified according to the following three quality grades: “Standard”, “High Quality”, and
“Specific”. The recommended applications for each Renesas Electronics product depends on the product’s quality grade, as
indicated below. You must check the quality grade of each Renesas Electronics product before using it in a particular
application. You may not use any Renesas Electronics product for any application categorized as “Specific” without the prior
written consent of Renesas Electronics. Further, you may not use any Renesas Electronics product for any application for
which it is not intended without the prior written consent of Renesas Electronics. Renesas Electronics shall not be in any way
liable for any damages or losses incurred by you or third parties arising from the use of any Renesas Electronics product for an
application categorized as “Specific” or for which the product is not intended where you have failed to obtain the prior written
consent of Renesas Electronics. The quality grade of each Renesas Electronics product is “Standard” unless otherwise
expressly specified in a Renesas Electronics data sheets or data books, etc.
“Standard”:
8.
9.
10.
11.
12.
Computers; office equipment; communications equipment; test and measurement equipment; audio and visual
equipment; home electronic appliances; machine tools; personal electronic equipment; and industrial robots.
“High Quality”: Transportation equipment (automobiles, trains, ships, etc.); traffic control systems; anti-disaster systems; anticrime systems; safety equipment; and medical equipment not specifically designed for life support.
“Specific”:
Aircraft; aerospace equipment; submersible repeaters; nuclear reactor control systems; medical equipment or
systems for life support (e.g. artificial life support devices or systems), surgical implantations, or healthcare
intervention (e.g. excision, etc.), and any other applications or purposes that pose a direct threat to human life.
You should use the Renesas Electronics products described in this document within the range specified by Renesas Electronics,
especially with respect to the maximum rating, operating supply voltage range, movement power voltage range, heat radiation
characteristics, installation and other product characteristics. Renesas Electronics shall have no liability for malfunctions or
damages arising out of the use of Renesas Electronics products beyond such specified ranges.
Although Renesas Electronics endeavors to improve the quality and reliability of its products, semiconductor products have
specific characteristics such as the occurrence of failure at a certain rate and malfunctions under certain use conditions. Further,
Renesas Electronics products are not subject to radiation resistance design. Please be sure to implement safety measures to
guard them against the possibility of physical injury, and injury or damage caused by fire in the event of the failure of a
Renesas Electronics product, such as safety design for hardware and software including but not limited to redundancy, fire
control and malfunction prevention, appropriate treatment for aging degradation or any other appropriate measures. Because
the evaluation of microcomputer software alone is very difficult, please evaluate the safety of the final products or system
manufactured by you.
Please contact a Renesas Electronics sales office for details as to environmental matters such as the environmental
compatibility of each Renesas Electronics product. Please use Renesas Electronics products in compliance with all applicable
laws and regulations that regulate the inclusion or use of controlled substances, including without limitation, the EU RoHS
Directive. Renesas Electronics assumes no liability for damages or losses occurring as a result of your noncompliance with
applicable laws and regulations.
This document may not be reproduced or duplicated, in any form, in whole or in part, without prior written consent of Renesas
Electronics.
Please contact a Renesas Electronics sales office if you have any questions regarding the information contained in this
document or Renesas Electronics products, or if you have any other inquiries.
(Note 1) “Renesas Electronics” as used in this document means Renesas Electronics Corporation and also includes its majorityowned subsidiaries.
(Note 2) “Renesas Electronics product(s)” means any product developed or manufactured by or for Renesas Electronics.
Overview
The High-performance Embedded Workshop is a Graphical User Interface intended to ease the
development and debugging of applications written in C/C++ programming language and assembly
language for Renesas microcomputers. Its aim is to provide a powerful yet intuitive way of accessing,
observing and modifying the debugging platform in which the application is running.
This help explains the function as a "debugger" of High-performance Embedded Workshop.
Target System
The Debugger operates on the emulator E30A system.
Supported CPU
This help explains the debugging function corresponding to the following CPUs.
•
R32C/100 Series
Note: In this help, the information which depends on this CPU is described as "for R32C".
Setup of Debugger
1
1. Features
3
1.1 RAM Monitor Function ................................................................................................................ 3
1.1.1 RAM Monitor Area............................................................................................................ 3
1.1.2 Sampling Period................................................................................................................ 3
1.1.3 Related Windows .............................................................................................................. 3
1.2 Break Functions ........................................................................................................................... 4
1.2.1 Software Breaks Function ................................................................................................ 4
1.2.2 Hardware Break ............................................................................................................... 4
1.3 Real-Time Trace Function ........................................................................................................... 5
1.3.1 Trace Area ......................................................................................................................... 5
1.3.2 Trace Condition Setting.................................................................................................... 6
1.4 Time Measurement Function ...................................................................................................... 6
1.4.1 The Measurement Condition............................................................................................ 6
1.5 Real-Time OS Debugging Function ............................................................................................. 6
1.6 GUI Input/Output Function ........................................................................................................ 6
2. About the Emulator E30A
7
2.1 Communication method ............................................................................................................... 7
2.2 Function table............................................................................................................................... 7
3. Before starting the debugger
8
3.1 Communication method by emulator .......................................................................................... 8
3.1.1 USB Interface.................................................................................................................... 8
3.2 Download of Firmware................................................................................................................. 8
3.3 Setting before emulator starts..................................................................................................... 9
3.3.1 USB communication ......................................................................................................... 9
4. Preparation before Use
10
4.1 Workspaces, Projects, and Files ................................................................................................ 10
4.2 Starting the High-performance Embedded Workshop ............................................................. 11
4.2.1 Creating a New Workspace (Toolchain Used) ............................................................... 12
4.2.2 Creating a New Workspace (Toolchain Not Used) ........................................................ 17
4.3 Starting the Debugger................................................................................................................ 22
4.3.1 Connecting the Emulator ............................................................................................... 22
4.3.2 Ending the Emulator ...................................................................................................... 22
5. Setup the Debugger
23
5.1 Init Dialog................................................................................................................................... 23
5.1.1 MCU Tab ......................................................................................................................... 24
5.1.2 Debugging Information Tab ........................................................................................... 26
5.1.3 Emulator Tab .................................................................................................................. 28
5.1.4 Script Tab........................................................................................................................ 30
5.1.5 Debugging Mode Tab ...................................................................................................... 31
5.2 Setting of the Communication Interface ................................................................................... 33
5.2.1 Setting of the USB Interface .......................................................................................... 33
5.3 Setup the Debugger for R32C .................................................................................................... 34
5.3.1 Emem Dialog................................................................................................................... 34
Tutorial
39
i
6. Tutorial
41
6.1 Introduction ................................................................................................................................ 41
6.2 Usage .......................................................................................................................................... 42
6.2.1 Step1 : Starting the Debugger........................................................................................ 42
6.2.2 Step2 : Checking the Operation of RAM........................................................................ 43
6.2.3 Step3 : Downloading the Tutorial Program................................................................... 44
6.2.4 Step4 : Setting a Breakpoint .......................................................................................... 46
6.2.5 Step5 : Executing the Program ...................................................................................... 47
6.2.6 Step6 : Reviewing Breakpoints ...................................................................................... 49
6.2.7 Step7 : Viewing Register ................................................................................................ 50
6.2.8 Step8 : Viewing Memory................................................................................................. 51
6.2.9 Step9 : Watching Variables ............................................................................................ 52
6.2.10 Step10 : Stepping Through a Program ........................................................................ 54
6.2.11 Step11 : Forced Breaking of Program Executions....................................................... 57
6.2.12 Step12 : Displaying Local Variables ............................................................................ 58
6.2.13 Step13 : Stack Trace Function ..................................................................................... 59
6.2.14 What Next?.................................................................................................................... 60
Reference
61
7. Windows/Dialogs
63
7.1 RAM Monitor Window ............................................................................................................... 64
7.1.1 Extended Menus ............................................................................................................. 65
7.1.2 Setting the RAM monitor area ....................................................................................... 66
7.2 ASM Watch Window .................................................................................................................. 68
7.2.1 Extended Menus ............................................................................................................. 69
7.3 C Watch Window ........................................................................................................................ 70
7.3.1 Extended Menus ............................................................................................................. 72
7.4 Script Window ............................................................................................................................ 73
7.4.1 Extended Menus ............................................................................................................. 74
7.5 S/W Break Point Setting Window.............................................................................................. 75
7.5.1 Command Button............................................................................................................ 76
7.5.2 Setting and Deleting a Break Points from Editor(Source) Window ............................. 77
7.6 Event Setting Window ............................................................................................................... 78
7.6.1 Specify the Event ............................................................................................................ 79
7.6.2 Select the action condition by which an event is assumed to have occurred ............... 81
7.6.3 Select the Combinatorial Condition ............................................................................... 82
7.6.4 Setting the RAM monitor event ..................................................................................... 83
7.6.5 Select the Trace Range ................................................................................................... 83
7.6.6 Select the Trace Mode..................................................................................................... 84
7.6.7 Setting the execution time measurement ...................................................................... 84
7.6.8 Command Button............................................................................................................ 85
7.6.9 Setting and Deleting a Break Points from Editor(Source) Window ............................. 86
7.6.10 Specify the Break Events ............................................................................................. 87
7.6.11 Specify the Event Combination Condition................................................................... 91
7.6.12 Specify the Trace Events .............................................................................................. 92
7.6.13 Specify the Time Measurement Events ......................................................................101
7.7 Time Measurement Window .....................................................................................................104
7.7.1 Specify the Time Measurement Event..........................................................................105
7.7.2 Time Measurement Condition.......................................................................................105
7.7.3 Command Button...........................................................................................................105
7.7.4 Set the Measurement Condition ...................................................................................106
7.7.5 Reference the time measurement results .....................................................................108
ii
7.8 Trace Window ............................................................................................................................109
7.8.1 Configuration of Bus Mode............................................................................................109
7.8.2 Configuration of Disassemble Mode..............................................................................111
7.8.3 Configuration of Data Access Mode ..............................................................................112
7.8.4 Configuration of Source Mode .......................................................................................113
7.8.5 Extended Menus ............................................................................................................114
7.8.6 Display of bus information on the R32C Debugger ......................................................115
7.9 GUI I/O Window........................................................................................................................116
7.9.1 Extended Menus ............................................................................................................117
7.10 MR Window .............................................................................................................................118
7.10.1 Extended Menus ..........................................................................................................119
7.10.2 Display the Task Status ..............................................................................................120
7.10.3 Display the Ready Queue Status ................................................................................124
7.10.4 Display the Timeout Queue Status.............................................................................125
7.10.5 Display the Event Flag Status ....................................................................................127
7.10.6 Display the Semaphore Status....................................................................................129
7.10.7 Display the Mailbox Status .........................................................................................131
7.10.8 Display the Data Queue Status...................................................................................133
7.10.9 Display the Cycle Handler Status...............................................................................135
7.10.10 Display the Alarm Handler Status ...........................................................................137
7.10.11 Display the Memory Pool Status...............................................................................138
7.10.12 Display the Task Context ..........................................................................................140
7.11 MR Trace Window ...................................................................................................................142
7.11.1 Extended Menus ..........................................................................................................144
7.11.2 Refer the Execution History of Task(MRxx Window) ................................................145
7.12 MR Analyze Window ...............................................................................................................151
7.12.1 Configuration of CPU Occupancy Status Display Mode ............................................151
7.12.2 Configuration of Ready State Duration Display Mode...............................................152
7.12.3 Configuration of System Call History Display Mode .................................................152
7.12.4 Extended Menus ..........................................................................................................153
7.12.5 Analyze the Execution History of Task.......................................................................153
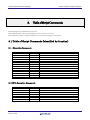
8. Table of Script Commands
156
8.1 Table of Script Commands (classified by function)..................................................................156
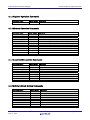
8.1.1 Execution Commands ....................................................................................................156
8.1.2 File Operation Commands.............................................................................................156
8.1.3 Register Operation Commands .....................................................................................157
8.1.4 Memory Operation Commands .....................................................................................157
8.1.5 Assemble/Disassemble Commands ...............................................................................157
8.1.6 Software Break Setting Commands..............................................................................157
8.1.7 Real-time Trace Commands ..........................................................................................158
8.1.8 Event Setting Commands..............................................................................................158
8.1.9 Script/Log File Commands ............................................................................................158
8.1.10 Program Display Commands.......................................................................................158
8.1.11 Clock Command ...........................................................................................................158
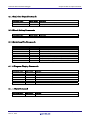
8.1.12 C Language Debugging Commands ............................................................................159
8.1.13 Real-time OS Command ..............................................................................................159
8.1.14 Utility Commands........................................................................................................159
8.2 Table of Script Commands (alphabetical order) ......................................................................160
9. Writing Script Files
162
9.1 Structural Elements of a Script File ........................................................................................162
9.1.1 Script Command ............................................................................................................163
9.1.2 Assign Statement...........................................................................................................163
9.1.3 Conditional Statement...................................................................................................163
9.1.4 Loop Statement(while,endw) and Break Statement ....................................................164
9.1.5 Comment statements.....................................................................................................164
iii
9.2 Writing Expressions..................................................................................................................165
9.2.1 Constants .......................................................................................................................165
9.2.2 Symbols and labels ........................................................................................................166
9.2.3 Macro Variables .............................................................................................................167
9.2.4 Register variables ..........................................................................................................167
9.2.5 Memory variables ..........................................................................................................167
9.2.6 Line Nos. ........................................................................................................................168
9.2.7 Character constants.......................................................................................................168
9.2.8 Operators........................................................................................................................168
10.
C/C++ Expressions
169
10.1 Writing C/C++ Expressions ....................................................................................................169
10.1.1 Immediate Values ........................................................................................................169
10.1.2 Scope Resolution ..........................................................................................................170
10.1.3 Mathematical Operators..............................................................................................170
10.1.4 Pointers ........................................................................................................................170
10.1.5 Reference ......................................................................................................................170
10.1.6 Sign Inversion ..............................................................................................................171
10.1.7 Member Reference Using Dot Operator......................................................................171
10.1.8 Member Reference Using Arrow .................................................................................171
10.1.9 Pointers to Members....................................................................................................172
10.1.10 Parentheses................................................................................................................172
10.1.11 Arrays .........................................................................................................................172
10.1.12 Casting to Basic Types...............................................................................................172
10.1.13 Casting to typedef Types ...........................................................................................173
10.1.14 Variable Name ...........................................................................................................173
10.1.15 Function Name...........................................................................................................173
10.1.16 Character Constants..................................................................................................173
10.1.17 Character String Literals ..........................................................................................173
10.2 Display Format of C/C++ Expressions ...................................................................................174
10.2.1 Enumeration Types .....................................................................................................174
10.2.2 Basic Types...................................................................................................................174
10.2.3 Pointer Types ...............................................................................................................175
10.2.4 Array Types..................................................................................................................176
10.2.5 Function Types.............................................................................................................176
10.2.6 Reference Types ...........................................................................................................176
10.2.7 Bit Field Types.............................................................................................................176
10.2.8 When No C Symbol is Found.......................................................................................177
10.2.9 Syntax Errors...............................................................................................................177
10.2.10 Structure and Union Types .......................................................................................177
11.
Display the Cause of the Program Stoppage
178
12.
Attention
179
12.1 Common Attention ..................................................................................................................179
12.1.1 File operation on Windows ..........................................................................................179
12.1.2 Area where software breakpoint can be set................................................................179
12.1.3 Get or set C variables ..................................................................................................180
12.1.4 Function name in C++ .................................................................................................180
12.1.5 Option settings for download modules........................................................................180
12.1.6 Debugging multi modules............................................................................................180
12.1.7 Synchronized debugging..............................................................................................181
12.1.8 Down-load of Firmware ...............................................................................................181
12.1.9 Check of ID Code..........................................................................................................181
12.1.10 ID code write to flash memory ..................................................................................181
12.1.11 The start procedure of debugger. ..............................................................................181
12.1.12 Use of Watch dog timer .............................................................................................181
iv
12.1.13 Debugging Resource on MCU....................................................................................181
12.1.14 Setting of break point on MCU's internal RAM area...............................................181
12.2 Attention of the R32C Debugger ............................................................................................182
12.2.1 Stack area used by the emulator.................................................................................182
12.2.2 Interrupt stack pointer when resetting the target program......................................182
12.2.3 RAM area used by the data compare break function .................................................182
12.2.4 Option of C Compiler/Assembler/Linker.....................................................................182
12.2.5 Downloading a program to external flash memory ....................................................183
12.3 Option of C Compiler/Assembler/Linker ................................................................................184
12.3.1 When Using NCxx .......................................................................................................184
12.3.2 When Using the IAR EC++ Compiler (EW)................................................................184
12.3.3 When Using the IAR C Compiler (EW).......................................................................185
12.3.4 When Using the IAR C Compiler (ICC) ......................................................................186
v
Setup of Debugger
1
(Blank Page)
2
R32C/100 E30A Emulator Debugger
Chapter 1 Features
1.
Features
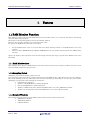
1.1 RAM Monitor Function
This debugger supports the real time RAM monitor function which allows you to reference the memory data during
execution of the target program.
The memory contents being displayed can be periodically updated.
However, the real time capability of program execution is lost.
To operate the RAM monitor function, set as follows.
•
•
Set the RAM monitor event to the event E5 in the Event Setting window or the RAM monitor area setup
window.
Select the menu ([RAM Monitor]->[Enable RAM Monitor]) of each window which supports the RAM monitor
function.
Specify the memory data acquisition interval time during executing the target program in the Emulator tab of the
Init dialog.
1.1.1 RAM Monitor Area
This debugger has 1 Kbytes of RAM monitor area which can be located in any contiguous address location or in 64
separate blocks comprised of 16 bytes each.
1.1.2 Sampling Period
Sampling cycle means the display update interval.
You can specify this function in any window which supports the RAM monitor. (The interval of 1s is set by default.)
The actual sampling cycle may take longer time than the specified cycle depending on the operating environment.
(Sampling cycle depends on the following environments.)
Communication interface
•
•
Number of the RAM Monitor windows displayed
•
Size of the RAM Monitor window displayed
•
Number of ASM watch points within the RAM monitor area of the ASM Watch window
•
Number of C watch points within the RAM monitor area of the C Watch window
1.1.3 Related Windows
The window where the function of the RAM monitor function can be used is shown below.
•
RAM Monitor Window
•
ASM Watch Window
•
C Watch Window
REJ10J2120-0100 Rev. 1.00
Dec. 01, 2010
Page 3 of 193
R32C/100 E30A Emulator Debugger
Chapter 1 Features
1.2 Break Functions
1.2.1 Software Breaks Function
Software Break breaks the target program before execution of the command at the specified address. This break
point is called software breakpoint.
The software breakpoint is set/reset in the Editor (Source) window or in the S/W Breakpoint Setting window. You
can also disable/enable a software breakpoint temporarily.
You can specify up to 256 software breakpoints. When specifying two or more software breakpoints, the breakpoint
combination is based on the OR logic. (Arrival to any one of breakpoints breaks the target program.)
1.2.1.1 Setting of software breakpoint
The software breakpoint can be set by the following windows.
•
Editor (Source) Window
•
S/W Break Point Setting Window
You can double-click the mouse to set/reset the software breakpoint in the Editor (Source) window.
You can also switch to temporarily disable/enable the software breakpoint in the S/W Breakpoint Setting window.
1.2.1.2 Area where software breakpoint can be set
The area which can be set for software breakpoint varies depending on the product.
For the areas available for software breakpoint, see the following:
"12.1.2 Area where software breakpoint can be set"
1.2.2 Hardware Break
This function causes the target program to stop upon detecting a data read/write to memory and instruction
execution.
Event breaks come in two types of breaks as shown below.
•
•
Instruction Execution Break
The instruction execution break is used to detect instruction execution, and the target program is made to
stop immediately before executing the instruction at a specified address.
Memory Access Break
A data write/read to or from memory is detected when a specified address is accessed for data, upon which
the target program is made to stop (post-execution break).
A total of 8 events comprised of break events, trace events, and time measurement events in combination can be
specified. Instruction execution allows you to specify the function name.
For the address designation method, memory access allow the range designation, in addition to the normal
one-address designation. Moreover, memory access allows you to specify the comparison data to read/write data
related to the specified address in the same manner as when setting the breakpoint. It also allows mask
designation to the comparison data. Note, however, that comparison data can be specified for only one event. You
cannot specify an address range.
Specified hardware break events can be used in one of the following combinations:
Break when any one of the specified break points is effected. (Or)
•
•
Events occur in a specified order. (Sequential)
REJ10J2120-0100 Rev. 1.00
Dec. 01, 2010
Page 4 of 193
R32C/100 E30A Emulator Debugger
Chapter 1 Features
1.3 Real-Time Trace Function
This function records a target program execution history.
Up to 8M cycles of execution history can be recorded. This record allows inspecting the bus information, executed
instructions, and source program execution path for each cycle.
The real-time trace function records the execution history of the target program.
The execution history is referred to in the tracing window.
The execution history can be referred to in the following mode.
•
BUS mode
This mode allows you to inspect cycle-by-cycle bus information. The display content depends on the
MCU and emulator system used. In addition to bus information, this mode allows disassemble,
source line or data access information to be displayed in combination.
•
Disassemble mode
This mode allows you to inspect the executed instructions. In addition to disassemble information,
this mode allows source line or data access information to be displayed in combination.
•
Data access mode
This mode allows you to inspect the data read/write cycles. In addition to data access information,
this mode allows source line information to be displayed in combination.
Source mode
•
This mode allows you to inspect the program execution path in the source program.
1.3.1 Trace Area
The 8M cycles execution history can be referred to with this debugger.
The trace area of the following 4 mode is being supported.
•
Break
8M cycles before target program stops
Before
•
8M cycles before trace point
After
•
8M cycles after trace point
Full
•
Until 8M cycles are written in the trace memory
To perform a trace measurement, you need to set a trace range and a trace event.
By default, Break is set for the trace range, and an event for measuring jump address information in the entire
address range is set as the trace event.
REJ10J2120-0100 Rev. 1.00
Dec. 01, 2010
Page 5 of 193
R32C/100 E30A Emulator Debugger
Chapter 1 Features
1.3.2 Trace Condition Setting
The following designations are available as trace events:
•
Branch trace
•
Data trace
•
Condition branch trace
A mixed trace of branch and data traces can be performed.
A total of 8 events comprised of break events, trace events, and time measurement events in combination can be
specified.
Trace events can be combined as below:
•
Trace when one of the valid events is established (OR condition)
1.4 Time Measurement Function
Execution time measurement
This function measures all execution times.
Interval time measurement
This function measures the minimum, maximum, and average execution time and the number of executions
performed in a specified interval.
Measurements can be taken in up to three intervals at the same time.
1.4.1 The Measurement Condition
Execution time measurement
Measuring the program execution time from when the program started to when it stops.
Interval time measurement
The measurement condition of the zone time can specify the following.
•
Time between two events
•
Time of event occurrence period
1.5 Real-Time OS Debugging Function
This function debugs the realtime OS-dependent parts of the target program that uses the realtime OS.
This function helps to show the status of the realtime OS.
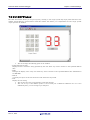
1.6 GUI Input/Output Function
This function simulates the user target system's key input panel (buttons) and output panel on a window.
Buttons can be used for the input panel, and labels (strings) and LEDs can be used for the output panel.
REJ10J2120-0100 Rev. 1.00
Dec. 01, 2010
Page 6 of 193
R32C/100 E30A Emulator Debugger
2.
Chapter 2 About the Emulator E30A
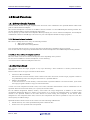
About the Emulator E30A
The E30AEmulator is an on-chip debugging emulator that makes use of the debugging circuit, or 1 Pin NSD (New
Single-wire Debugger), that is built in the R32C/100 series MCUs.
1 Pin NSD is Renesas original OCD (On-chip Debugger).
Using only the BYTE pin of the target MCU as a communication path, it permits the MCU operation and electrical
characteristics, etc. to be debugged under a condition close to that of the user's final product.
2.1 Communication method
The supported communication method is USB communication.
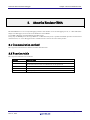
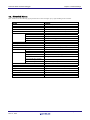
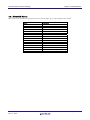
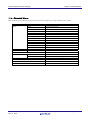
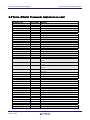
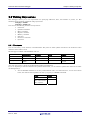
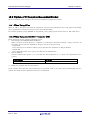
2.2 Function table
The supported functions are as follows.
Function
S/W Break
Event Break
Real-Time Trace
RAM monitor
Time Measurement
Emulator E30A
256 points
8 points (A total of 8 events comprised of break events, trace events, and
time measurement events in combination can be specified.)
8M cycles
1K bytes (16bytes x 64blocks) area
Go to Stop / 3 points interval
REJ10J2120-0100 Rev. 1.00
Dec. 01, 2010
Page 7 of 193
R32C/100 E30A Emulator Debugger
3.
Chapter 3 Before starting the debugger
Before starting the debugger
3.1 Communication method by emulator
The supported communication method is as follows.
•
USB
3.1.1 USB Interface
•
•
•
Compliant with USB Standard 2.0.
Connections via USB hub are not supported.
The necessary cable is included with the emulator.
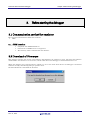
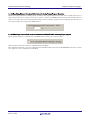
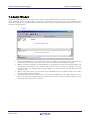
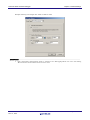
3.2 Download of Firmware
This debugger searches the version of the firmware downloaded to the emulator at start. Also when the firmware
downloaded to the emulator is of old version, a mode which drives this debugger to download firmware is set.
When this debugger gets started while the emulator is set in the mode which drives the debugger to download
firmware forcedly, the following dialog is opened at start.
Click the OK button to download the firmware.
REJ10J2120-0100 Rev. 1.00
Dec. 01, 2010
Page 8 of 193
R32C/100 E30A Emulator Debugger
Chapter 3 Before starting the debugger
3.3 Setting before emulator starts
3.3.1 USB communication
Connection of USB devices is detected by Windows' Plug & Play function. The device driver needed for the
connected USB device is automatically installed.
3.3.1.1 Install of USB device driver
The USB devices connected are detected by Windows' Plug & Play function. The installation wizard for USB device
drivers starts after the device had been detected. The following shows the procedure for installing the USB device
drivers.
1.
Connect the host computer and the emulator with USB cable.
2.
Then turn on the power to the emulator.
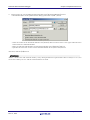
3.
When [Add New Hardware Wizard] is displayed, select [Install the software automatically].
ATTENTION
•
•
Before the USB device drivers can be installed, the debugger you use must already be installed.
Install this debugger first.
A user who install the USB device driver need administrator rights.
REJ10J2120-0100 Rev. 1.00
Dec. 01, 2010
Page 9 of 193
R32C/100 E30A Emulator Debugger
4.
Chapter 4 Preparation before Use
Preparation before Use
Please run the High-performance Embedded Workshop and connect the emulator .
In addition, in order to debug with this product, it is necessary to create a workspace.
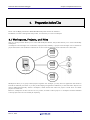
4.1 Workspaces, Projects, and Files
Just as a word processor allows you to create and modify documents, this product allows you to create and modify
workspaces.
A workspace can be thought of as a container of projects and, similarly, a project can be thought of as a container of
project files. Thus, each workspace contains one or more projects and each project contains one or more files.
Workspaces allow you to group related projects together. For example, you may have an application that needs to
be built for different processors or you may be developing an application and library at the same time. Projects can
also be linked hierarchically within a workspace, which means that when one project is built all of its "child"
projects are built first.
However, workspaces on their own are not very useful, we need to add a project to a workspace and then add files
to that project before we can actually do anything.
REJ10J2120-0100 Rev. 1.00
Dec. 01, 2010
Page 10 of 193
R32C/100 E30A Emulator Debugger
Chapter 4 Preparation before Use
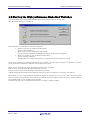
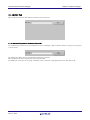
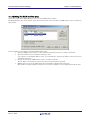
4.2 Starting the High-performance Embedded Workshop
Activate the High-performance Embedded Workshop from [Programs] in the [Start] menu.
The [Welcome!] dialog box is displayed.
In this dialog box, A workspace is created or displayed.
•
[Create a new project workspace] radio button:
Creates a new workspace.
[Open a recent project workspace] radio button:
•
Uses an existing workspace and displays the history of the opened workspace.
[Browse to another project workspace] radio button:
•
Uses an existing workspace;
this radio button is used when the history of the opened workspace does not remain.
In the case of Selecting an Existing Workspace, select [Open a recent project workspace] or [Browse to another
project workspace] radio button and select the workspace file (.hws).
Please refer to the following about the method to create a new workspace.
Refer to "4.2.1 Creating a New Workspace (Toolchain Used)"
Refer to "4.2.2 Creating a New Workspace (Toolchain Not Used)"
* When debugging the existing load module file with this product, a workspace is created by this method.
The method to create a new workspace depends on whether a toolchain is or is not in use. Note that this product
does not include a toolchain. Use of a toolchain is available in an environment where the C/C++ compiler package
for the CPU which you are using has been installed.
For details on this, refer to the manual attached to your C/C++ compiler package.
REJ10J2120-0100 Rev. 1.00
Dec. 01, 2010
Page 11 of 193
R32C/100 E30A Emulator Debugger
Chapter 4 Preparation before Use
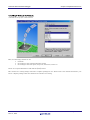
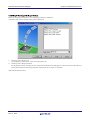
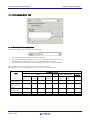
4.2.1 Creating a New Workspace (Toolchain Used)
4.2.1.1 Step1 : Creation of a new workspace
In the [Welcome!] dialog box that is displayed when the High-performance Embedded Workshop is activated, select
the [Create a new project workspace] radio button and click the [OK] button.
Creation of a new workspace is started.
The following dialog box is displayed.
1.
2.
3.
4.
Select the target CPU family
In the [CPU family] combo box, select the target CPU family.
Select the target toolchain
In the [Tool chain] combo box, select the target toolchain name when using the toolchain.
Select the project type
In the [Project type] list box, select the project type to be used.
In this case, select "Application" .
(Please refer to the manual attached to your C/C++ compiler package about the details of the project type
which can be chosen.)
Specify the workspace name and project name
- In the [Workspace Name] edit box, enter the new workspace name.
- In the [Project Name] edit box, enter the project name. When the project name is the same as the workspace
name, it needs not be entered.
- In the [Directory] edit box, enter the directory name in which the workspace will be created. Click the
[Browse...] button to select a directory.
After a setting, click the [OK] button.
REJ10J2120-0100 Rev. 1.00
Dec. 01, 2010
Page 12 of 193
R32C/100 E30A Emulator Debugger
Chapter 4 Preparation before Use
4.2.1.2 Step2 : Setting for the Toolchain
A wizard for the project creation starts.
Here, the following contents are set.
•
toolchain
•
the setting for the real-time OS (when using)
•
the setting for the startup file, heap area, stack area, and so on
Please set required information and click the [Next] button.
The contents of a setting change with C/C++ compiler packages of use. Please refer to the manual attached to your
C/C++ compiler package about the details of the contents of a setting.
REJ10J2120-0100 Rev. 1.00
Dec. 01, 2010
Page 13 of 193
R32C/100 E30A Emulator Debugger
Chapter 4 Preparation before Use
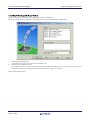
4.2.1.3 Step 3: Selecting of the Target Platform
Select the target system used for your debugging (emulator, simulator).
When the setting for the toolchain has been completed, the following dialog box is displayed.
1.
2.
Selecting of the Target type
In the [Target type] list box, select the target CPU type.
Selecting of the Target Platform
In the [Targets] area, the target for the session file used when this debugger is activated must be selected here.
Check the box against the target platform. (And choose other target as required.)
And click the [Next] button.
REJ10J2120-0100 Rev. 1.00
Dec. 01, 2010
Page 14 of 193
R32C/100 E30A Emulator Debugger
Chapter 4 Preparation before Use
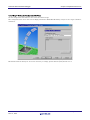
4.2.1.4 Step4 : Setting the Configuration File Name
Set the configuration file name for each of the all selected target.
The configuration file saves the state of High-performance Embedded Workshop except for the target (emulator,
simulator).
The default name is already set. If it is not necessary to change, please click the [next] button as it is.
REJ10J2120-0100 Rev. 1.00
Dec. 01, 2010
Page 15 of 193
R32C/100 E30A Emulator Debugger
Chapter 4 Preparation before Use
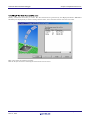
4.2.1.5 Step5 : The check of a created file name
Finally, confirm the file name you create. The files which will be generated by the High-performance Embedded
Workshop are displayed If you want to change the file name, select and click it then enter the new name.
This is the end of the emulator settings.
Exit the Project Generator following the instructions on the screen.
REJ10J2120-0100 Rev. 1.00
Dec. 01, 2010
Page 16 of 193
R32C/100 E30A Emulator Debugger
Chapter 4 Preparation before Use
4.2.2 Creating a New Workspace (Toolchain Not Used)
When debugging the existing load module file with this product, a workspace is created by this method. (It can
work even if the tool chain is not installed.)
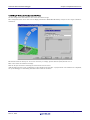
4.2.2.1 Step1 : Creation of a new workspace
In the [Welcome!] dialog box that is displayed when the High-performance Embedded Workshop is activated, select
the [Create a new project workspace] radio button and click the [OK] button.
Creation of a new workspace is started. The following dialog box is displayed.
1.
2.
3.
4.
Select the target CPU family
In the [CPU family] combo box, select the target CPU family.
Select the target toolchain
In the [Tool chain] combo box, select "None". In this case, toolchain is not used.
(When the toolchain has not been installed, the fixed information is displayed in this combo box.)
Select the project type
(When the toolchain is not used, it is displayed on a [Project Type] list box as "Debugger only - Target Name".
Select it. (When two or more project types are displayed, please select one of them.)
Specify the workspace name and project name
- In the [Workspace Name] edit box, enter the new workspace name.
- In the [Project Name] edit box, enter the project name. When the project name is the same as the workspace
name, it needs not be entered.
- In the [Directory] edit box, enter the directory name in which the workspace will be created. Click the
[Browse...] button to select a directory.
After a setting, click the [OK] button.
REJ10J2120-0100 Rev. 1.00
Dec. 01, 2010
Page 17 of 193
R32C/100 E30A Emulator Debugger
Chapter 4 Preparation before Use
4.2.2.2 Step 2: Selecting of the Target Platform
Select the target system used for your debugging (emulator, simulator).
A wizard starts and the following dialog box is displayed.
1.
2.
Selecting of the Target type
In the [Target type] list box, select the target CPU type.
Selecting of the Target Platform
In the [Targets] area, the target for the session file used when this debugger is activated must be selected here.
Check the box against the target platform. (And choose other target as required.)
And click the [Next] button.
REJ10J2120-0100 Rev. 1.00
Dec. 01, 2010
Page 18 of 193
R32C/100 E30A Emulator Debugger
Chapter 4 Preparation before Use
4.2.2.3 Step3 : Setting the Configuration File Name
Set the configuration file name for each of the all selected target.
The configuration file saves the state of High-performance Embedded Workshop except for the target (emulator,
simulator).
The default name is already set. If it is not necessary to change, please click the [next] button as it is.
This is the end of the emulator settings.
Exit the Project Generator following the instructions on the screen.
And the dialog for the setup of a debugger is also displayed at this time . If preparation of an emulator is completed,
set up the debugger in this dialog box and connect with an emulator.
REJ10J2120-0100 Rev. 1.00
Dec. 01, 2010
Page 19 of 193
R32C/100 E30A Emulator Debugger
Chapter 4 Preparation before Use
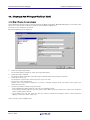
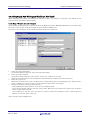
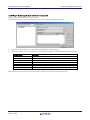
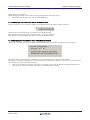
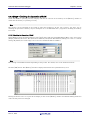
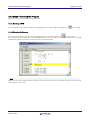
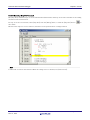
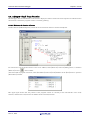
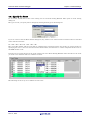
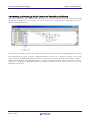
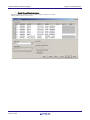
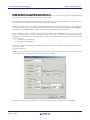
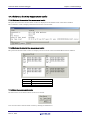
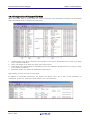
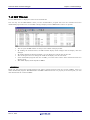
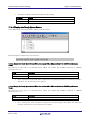
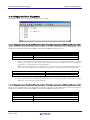
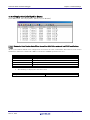
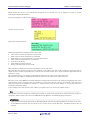
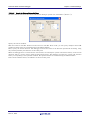
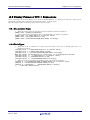
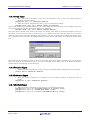
4.2.2.4 Step4 : Registering the Load modules to be downloaded
Finally, register the load module file to be used.
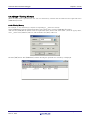
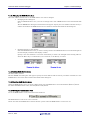
Select [Debug Settings...] from the [Debug] menu to open the [Debug Settings] dialog box.
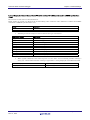
1.
2.
Select the product name to be connected in the [Target] drop-down list box.
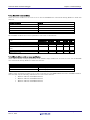
Select the format of the load module to be downloaded in the [Default Debug Format] drop-down list box.
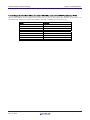
Format Name
Contents
IEEE695_RENESAS
IEEE695_IAR
IEEE695_TASKING
ELF/DWARF2
ELF/DWARF2_IAR
ELF/DWARF2_TASKING
ELF/DWARF2_KPIT
IEEE-695 format file (When Using Renesas toolchain)
IEEE-695 format file (When Using IAR toolchain)
IEEE-695 format file (When Using Tasking toolchain)
ELF/DWARF2 format file (When Using Renesas toolchain)
ELF/DWARF2 format file (When Using IAR toolchain)
ELF/DWARF2 format file (When Using Tasking toolchain)
ELF/DWARF2 format file (When Using KPIT toolchain)
This debugger does not support the object formats, which are not shown in the drop down list.
REJ10J2120-0100 Rev. 1.00
Dec. 01, 2010
Page 20 of 193
R32C/100 E30A Emulator Debugger
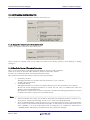
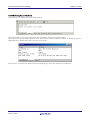
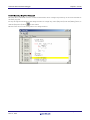
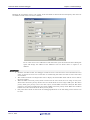
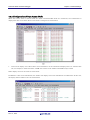
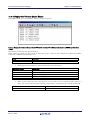
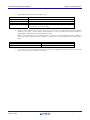
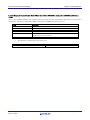
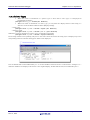
3.
Chapter 4 Preparation before Use
Then register the corresponding download module in the [Download Modules] list box.
A download module can be specified in the dialog opened with a [Add...] button.
- Select the format of the download module in the [Format] edit box. Please refer to the upper table about the
format name of a download module.
- Enter the full path and filename of the download module in the [Filename] edit box.
- Specifies the access size for the current download module in the [Access size] list box.
After that, click the [OK] button.
ATTENTION
"Offset", "Access size" and "Perform memory verify during download" is ignored. The offset is always set to 0, the
access size is always set to 1 and the verification does not work.
REJ10J2120-0100 Rev. 1.00
Dec. 01, 2010
Page 21 of 193
R32C/100 E30A Emulator Debugger
Chapter 4 Preparation before Use
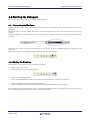
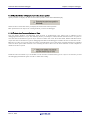
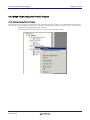
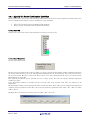
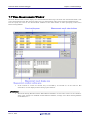
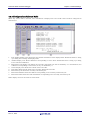
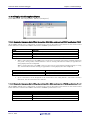
4.3 Starting the Debugger
The debugging can be started by connecting with an emulator.
4.3.1 Connecting the Emulator
Connect the emulator by simply switching the session file to one in which the setting for the emulator use has been
registered.
The session file is created by default. The session file has information about the target selected when a project was
created.
In the circled list box in the following tool bars, select the session name including the character string of the target
to connect.
After the session name is selected, the dialog box for setting the debugger is displayed and the emulator will be
connected.
When the dialog box is not displayed, select [Connect] from the [Debug] menu.
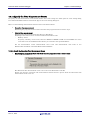
4.3.2 Ending the Emulator
The emulator can be exited by using the following methods:
1.
Selecting the “Disconnect”
Select [Disconnect] from the [Debug] menu.
2.
Selecting the "DefaultSession"
Select the "DefaultSession" in the list box that was used at the time of emulator connection.
3.
Exiting the High-performance Embedded Workshop
Select [Exit] from the [File] menu. High-performance Embedded Workshop will be ended.
The message box, that asks whether to save a session, will be displayed when an emulator is exited. If necessary to
save it, click the [Yes] button. If not necessary, click the [No] button.
REJ10J2120-0100 Rev. 1.00
Dec. 01, 2010
Page 22 of 193
R32C/100 E30A Emulator Debugger
Chapter 5 Setup the Debugger
5.
Setup the Debugger
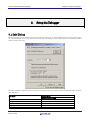
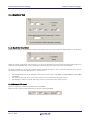
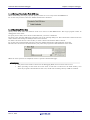
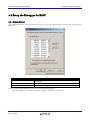
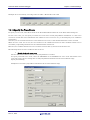
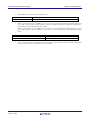
5.1 Init Dialog
The Init dialog box is provided for setting the items that need to be set when the debugger starts up. The contents
set from this dialog box are also effective the next time the debugger starts. The data set in this dialog remains
effective for the next start.
The tabs available on this dialog box vary with each product used. For details, click the desired tab name shown in
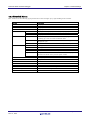
the table below.
Tab Name
MCU
Debugging Information
Emulator
Script
Debugging Mode
REJ10J2120-0100 Rev. 1.00
Dec. 01, 2010
Product Name
The debugger for R32C
exist
exist
exist
exist
exist
Page 23 of 193
R32C/100 E30A Emulator Debugger
Chapter 5 Setup the Debugger
You can open the Init dialog using either one of the following methods:
•
After the debugger gets started, select Menu - [Setup] -> [Emulator] -> [System...].
•
Start Debugger while holding down the Ctrl key.
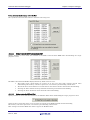
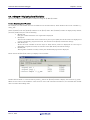
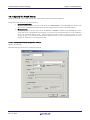
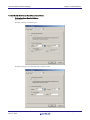
5.1.1 MCU Tab
The specified content becomes effective when the next being start.
5.1.1.1 Specifying the MCU file
Click the "Refer" button.
The File Selection dialog is opened. Specify the corresponding MCU file.
•
An MCU file contains the information specific to the target MCU.
•
The specified MCU file is displayed in the MCU area of the MCU tab.
5.1.1.2 Setting of the Communication Interface
The displayed data varies depending on the specified communication interface.
The available communication interface varies depending on the products.
The following shows the setting for each communication interface.
•
Refer to "5.2.1 Setting of the USB Interface"
5.1.1.3 Choosing to use or not to use CPU rewrite mode
Specify whether or not you want to use CPU rewrite mode. (By default, CPU rewrite mode is unused.)
Select the above check box when you are debugging the target system that uses CPU rewrite mode.
This specification can only be set or changed when you start the debugger.
REJ10J2120-0100 Rev. 1.00
Dec. 01, 2010
Page 24 of 193
R32C/100 E30A Emulator Debugger
Chapter 5 Setup the Debugger
Supplementary explanation
When debugging in CPU rewrite mode is enabled, the following limitations apply:
•
No software breaks can be set in the internal ROM area.
5.1.1.4 Choosing to use or not to use ECC in the E2 Data Flash
Specify whether or not you want to use ECC in the E2 Data Flash. (By default, ECC is unused.)
Select the above check box when you use ECC in the E2 Data Flash.
This specification can only be set or changed when you start the debugger.
This setting is invalid for MCU that doesn't support the E2 Data Flash.
5.1.1.5 Specifying the Start Address of the Debug Monitor Program
Specify the start address of the area (MCU's internal RAM area) to be used by the debug monitor program.
The debug monitor program will use 1.2K bytes of area beginning with the specified start address.
Although no particular considerations need to be taken for it because the memory contents are saved in advance,
the following precautions should be observed.
•
Only the start address consisting of 00xx00 (xx = arbitrary) can be set. By default, the address 002000 is set.
•
No areas that overlap the stack or the target area of DMA can be specified.
REJ10J2120-0100 Rev. 1.00
Dec. 01, 2010
Page 25 of 193
R32C/100 E30A Emulator Debugger
Chapter 5 Setup the Debugger
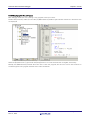
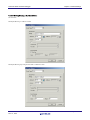
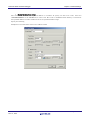
5.1.2 Debugging Information Tab
The specified content becomes effective when the next being start.
5.1.2.1 display the compiler used and its object format
Display the compiler used and its object file format.
Please specify the compiler used and its object file format in the dialog opened by menu [Debug] -> [Debug
Settings...].
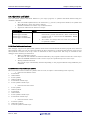
5.1.2.2 Specify the Storing of Debugging Information
There are two methods for storing debugging information: on-memory and on-demand.
Select one of these two methods. (The on-memory method is selected by default.)
To select the on-demand method, click the On Demand check box.
The specified content becomes effective when the next being download.
•
•
On-memory method
Debugging information is stored in the internal memory of your computer.
Usually, select this method.
On-demand method
Debugging information is stored in a reusable temporary file on the hard disk of your computer.
Because the stored debugging information is reused, the next time you download the same load
module it can be downloaded faster.
This method is suitable when it takes so long time to download the debugging information, because
the PC has less memory against the load module file size.
Notes
•
•
If the load module size is large, the on-memory method may be inefficient because it requires a very
large amount of time for downloading. In such a case, select the on-demand method.
In the on-demand method, a folder in which to store a reusable temporary file is created in the folder
that contains the downloaded load module. This folder is named after the load module name by the
word "~INDEX_" to it. If the load module name is "sample.abs", for example, the folder name is
"~INDEX_sample". This folder is not deleted even after quitting the debugger.
REJ10J2120-0100 Rev. 1.00
Dec. 01, 2010
Page 26 of 193
R32C/100 E30A Emulator Debugger
Chapter 5 Setup the Debugger
5.1.2.3 Specify whether to display the instruction format specifier
Specify whether to display the instruction format specifier in the disassembled display.
Select the above check box when you display the instruction format specifier.
This specification can only be set or changed when you start the debugger.
5.1.2.4 To treat size of enumeration type as 1 byte
You can specify whether your debugger treat all sizes of enumeration types whose size is unknown in the
debugging information as 1 byte. For reducing memory consumption, NC30, NC308 and NC100 have an option to
treat the sizes of enumerator types as 1 byte and not as same size of 'int'. Note that NC30, NC308 and NC100 don't
output the sizes of enumerator types in debugging information and debuggers consider the size as same size of 'int'.
Therefore you may not correctly refer the values of enumeration types in the target programs which were compiled
with the above option. This function is for resolving the above issue. See the users' manual of each compiler for
details of the above option
Check the above check box if you would like to treat all sizes of enumeration types as 1 byte. It is necessary to load
the debugging information again in order to reflect this setting.
REJ10J2120-0100 Rev. 1.00
Dec. 01, 2010
Page 27 of 193
R32C/100 E30A Emulator Debugger
Chapter 5 Setup the Debugger
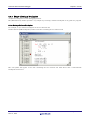
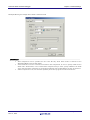
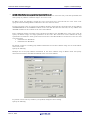
5.1.3 Emulator Tab
5.1.3.1 Specify the Target Clock
Change the setting by synchronizing with the clock used by the target microcomputer. (Generated is set by default.)
Select the option "Generated" if the frequency you have set should be set for the clock internally generated by the
emulator (user-defined clock), or select "Internal" if said frequency should be set for the internal clock.
No matter whether you set the user-defined clock or the internal clock, be sure to enter the frequency to be used in
the frequency input text box. (By default, no values are set.)
•
•
•
The user-defined clock in the debugger can be input in the range 1.0000 MHz to 99.9999 MHz in 0.0001 MHz
increments.
The value in the frequency input text box can only be set or altered at debugger startup.
The debugger cannot be started unless any value is set in the frequency input text box.
5.1.3.2 Setting of PLL circuit
Enter the frequency of the internal PLL of the target MCU.
Enter the value of the internal clock control register of the target MCU.
REJ10J2120-0100 Rev. 1.00
Dec. 01, 2010
Page 28 of 193
R32C/100 E30A Emulator Debugger
Chapter 5 Setup the Debugger
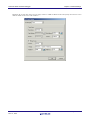
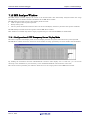
5.1.3.3 Specifying Memory Data Acquisition Intervals during Target Program Execution
While the target program is running, specify a memory data acquisition interval in ms units at which intervals you
want memory data to be acquired one byte or word at a time by the RAM monitor function. The default interval
time is 5 ms. The interval time specified here differs from the display update interval (sampling period) that you
set in each window that supports the RAM monitor.
5.1.3.4 Choosing to communicate or not to communicate with MCU while executing target program
Please specify whether to communicate with MCU while executing the target program.
Select the above check box when not communicating with MCU.
The communication fault occurs if it communicates with MCU while executing the WAIT/STOP instruction. In this
case, please set not to communicate with MCU.
REJ10J2120-0100 Rev. 1.00
Dec. 01, 2010
Page 29 of 193
R32C/100 E30A Emulator Debugger
Chapter 5 Setup the Debugger
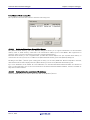
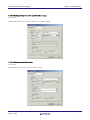
5.1.4 Script Tab
The specified content becomes effective when the next being start.
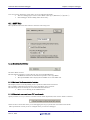
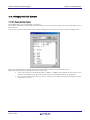
5.1.4.1 Automatically Execute the Script Commands
To automatically execute the script command at start of Debugger, click the "Refer" button to specify the script file
to be executed.
By clicking the "Refer" button, the File Selection dialog is opened.
The specified script file is displayed in the "Init File:" field.
To disable auto-execution of the script command, erase a character string displayed in the "Init File:" field.
REJ10J2120-0100 Rev. 1.00
Dec. 01, 2010
Page 30 of 193
R32C/100 E30A Emulator Debugger
Chapter 5 Setup the Debugger
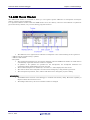
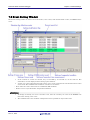
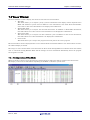
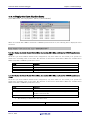
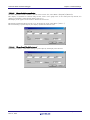
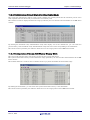
5.1.5 Debugging Mode Tab
5.1.5.1 Selecting of the Debugging Mode
Select the debugging mode of the emulator debugger.
•
•
•
•
The trace mode is the mode to use the trace function.
The time measurement mode is the mode to use the time measurement function.
The RAM monitor mode is the mode to use the RAM monitor function.
The writer mode is the mode to use the emulator as a writer of the flash ROM.
The function of the mode except for the chosen mode can't be used.
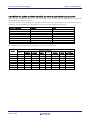
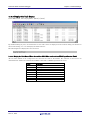
The following shows the debugging function that can be used in each mode.
Mode
Trace :
Trace priority
Trace :
MCU execution
priority
Time
measurement
RAM monitor
Writer
Debugging function
Trace
Break
Execution
PC
Yes
Data
access
Yes
Address
Area
No
Data
compare
No
Time measurement
RAM
monitor
Yes
Execution
time
No
Interval
time
No
No
Yes
Yes
No
Yes
Yes
No
No
No
Yes
Yes
No
No
No
Yes
Yes
No
Yes
No
Yes
No
Yes
No
No
No
No
No
No
No
No
No
Yes
No
REJ10J2120-0100 Rev. 1.00
Dec. 01, 2010
Page 31 of 193
R32C/100 E30A Emulator Debugger
Chapter 5 Setup the Debugger
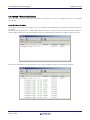
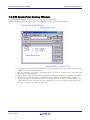
5.1.5.2 Setting of Download to Flash ROM Area
When downloading the target program, specify whether or not to verify in the flash ROM area.
To use the verify function, select the "Enable Verification" check box.
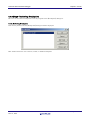
5.1.5.3 Specifying Writer Mode
Specify writer mode when the emulator needs to be used as a flash ROM writer. The target program cannot be
debugged in writer mode.
To specify writer mode, select the the load module file you want to download.
To select a file, click the Add button and select one in the ensuing dialog box. The selected file is listed in the file
name column of the dialog box. Multiple files can be selected.
To delete a file from the list, select the file you want to delete and click the Remove button.
To use the verify and checksum functions, select the "Enable Verification and Checksum" check box.
The ID code is written into the flash memory only when the program was downloaded in writer mode.
When the write operation is completed, restart or quit the emulator debugger.
ATTENTION
•
•
Only when writer mode is selected in the Debugging Mode, writer function can be used.
When operating in other than the writer mode, no ID code is written into the flash memory even
when the program is downloaded. In that case, an ID code consisting entirely of FFh is assumed.
REJ10J2120-0100 Rev. 1.00
Dec. 01, 2010
Page 32 of 193
R32C/100 E30A Emulator Debugger
Chapter 5 Setup the Debugger
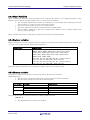
5.2 Setting of the Communication Interface
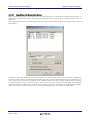
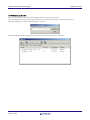
5.2.1 Setting of the USB Interface
USB communication uses the personal computer's USB interface. It is compliant with USB 2.0.
Before USB communication can be performed, the computer must have a dedicated device driver installed in it. For
details on how to install USB device drivers, see "3.3.1.1 Install of USB device driver."
The currently USB-connected emulators are listed in the Serial No. area. Select the serial No. of the emulator you
want to connect.
REJ10J2120-0100 Rev. 1.00
Dec. 01, 2010
Page 33 of 193
R32C/100 E30A Emulator Debugger
Chapter 5 Setup the Debugger
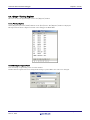
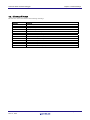
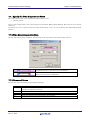
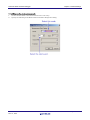
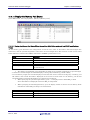
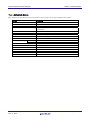
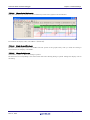
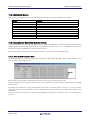
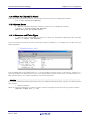
5.3 Setup the Debugger for R32C
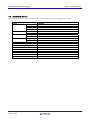
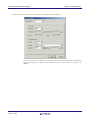
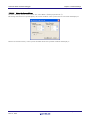
5.3.1 Emem Dialog
In the Emem dialog box, setting information on the user target. The Emem dialog box opens after closing the Init
dialog box.
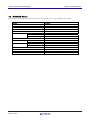
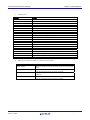
Tab Name
Internal flash memory overwrite
External flash memory
Ext Port
Contents
Specify whether or not to clear the contents of the MCU's internal
flash ROM.
Register the external flash memory information.
Specify whether or not to invalidate reset of the target.
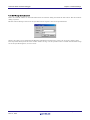
You can open the Emem dialog using either one of the following methods:
•
After the debugger gets started, select Menu - [Setup] -> [Emulator] -> [Target...].
REJ10J2120-0100 Rev. 1.00
Dec. 01, 2010
Page 34 of 193
R32C/100 E30A Emulator Debugger
Chapter 5 Setup the Debugger
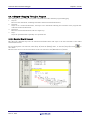
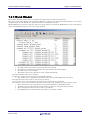
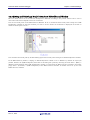
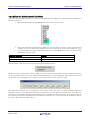
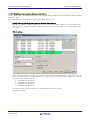
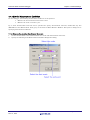
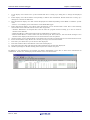
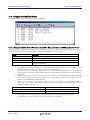
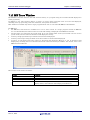
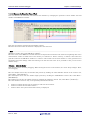
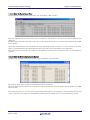
5.3.1.1 Internal flash memory overwrite Tab
The specified content becomes effective when the next being start.
5.3.1.1.1.
Setting to clear the MCU's internal flash ROM
Specify whether or not to clear the contents of the MCU's internal flash ROM when downloading the target
program or data.
The MCU's internal flash ROM is displayed block by block in the list view.
•
The blocks whose check marks are turned on do not have their flash contents cleared when
downloading. The memory contents in places not overwritten by downloading remain intact.
The blocks whose check marks are turned off have their flash contents cleared when downloading.
•
Pressing the Select All button keeps all blocks from being cleared when downloading.
•
•
Pressing the Clear All button clears all blocks when downloading.
5.3.1.1.2.
Setting to clear the E2 Data Flash
Specify whether or not to clear the contents of the E2 Data Flash when downloading the target program or data.
Select the above check box when you do not clear the content of the E2 Data Flash when downloading.
The memory contents in places not overwritten by downloading remain intact.
This setting is invalid for MCU that doesn't support the E2 Data Flash.
REJ10J2120-0100 Rev. 1.00
Dec. 01, 2010
Page 35 of 193
R32C/100 E30A Emulator Debugger
Chapter 5 Setup the Debugger
5.3.1.2 External flash memory Tab
The specified content becomes effective when the next being start.
5.3.1.2.1.
Registering Information on External Flash Memory
The [External flash memory] tab of the [Emem] dialog box allows you to register information on external flash
memory (that is, flash memory connected to the external-bus address space of the MCU). This registration is
necessary when you wish to download a program to external flash memory.
External flash memory is not recognized until its USD file (which defines how the external flash memory is
connected to the user system, etc.) is added to the [External flash memory] tab of the [Emem] dialog box.
Clicking on the [Add…] button opens a dialog box in which you can select USD files. When a USD file is selected,
information from the file is displayed in the [Flash memory] section of the [External flash memory] tab.
Up to four USD files can be added. To create USD files, use the External Flash Definition Editor. For details on
how to create USD files, refer to the user’s manual for the External Flash Definition Editor, which is available at
http://www.renesas.com/efe.
5.3.1.2.2.
Deleting Information on the External Flash Memory
Select the USD file that you wish to delete and click on the [Remove] button.
REJ10J2120-0100 Rev. 1.00
Dec. 01, 2010
Page 36 of 193
R32C/100 E30A Emulator Debugger
5.3.1.2.3.
Chapter 5 Setup the Debugger
Detail Setting of the External Flash Memory
Select external flash memory information from the flash memory list and click the [Detail Setting] button or
double-click external flash memory information. The [External flash memory detail setting] dialog box will be
displayed.
In the [External flash memory detail setting] dialog box, make detail settings for each sector (block) of the external
flash memory.
Settings for all sectors defined in the selected USD file are automatically shown in the list. When a checkbox is
selected, the sector will be overwritten (merged) when the user program is downloaded. To alter the setting for one
sector, enter the new first and last address in the [Address] edit box and click on [Set]. If [Overwrite] is selected,
the selected sector will be overwritten without erasure when the user program is downloaded. If the [Disable
download] checkbox is checked, the selected sector is neither erased nor downloaded at download time. If [Write
after all sectors are erased.] is selected, all sectors will be erased when the user program is downloaded.
REJ10J2120-0100 Rev. 1.00
Dec. 01, 2010
Page 37 of 193
R32C/100 E30A Emulator Debugger
Chapter 5 Setup the Debugger
5.3.1.3 Ext Port Tab
The specified content becomes effective when the next being start.
5.3.1.3.1.
Setting to extension port
Specify whether or not to invalidate reset of the target.
•
•
If you want to invalidate reset of the target, select the check box shown above. When the extension
port is not connected, this function cannot be set.
When the extension port is connected, this function can be changed even after debugger start.
REJ10J2120-0100 Rev. 1.00
Dec. 01, 2010
Page 38 of 193
Tutorial
39
(Blank Page)
40
R32C/100 E30A Emulator Debugger
Chapter 6 Tutorial
6.
Tutorial
6.1 Introduction
This section describes the main functions of this debugger by using a tutorial program. The tutorial programs are
installed to the directory ¥WorkSpace¥Tutorial of the drive you installed High-performance Embedded Workshop.
There are workspaces for each targets and each MCUs. Please select the corresponding one to your system, and
open the workspace file (*.hws) from the menu [Open Workspace...].
The tutorial program is based on the C program that sorts ten random data items in ascending or descending order.
The tutorial program performs the following actions:
•
The tutorial function generates random data to be sorted.
•
The sort function sorts the generated random data in ascending order.
•
The change function then sorts the data in descending order.
Note
After recompilation, the addresses may differ from those given in this section.
REJ10J2120-0100 Rev. 1.00
Dec. 01, 2010
Page 41 of 193
R32C/100 E30A Emulator Debugger
Chapter 6 Tutorial
6.2 Usage
Please follow these instructions:
6.2.1 Step1 : Starting the Debugger
6.2.1.1 Preparation before Use
To run the High-performance Embedded Workshop and connect the emulator, refer to "4 Preparation before Use ".
6.2.1.2 Setup the Debugger
If it connects with an emulator, the dialog box for setting up a debugger will be displayed. Please set up the
debugger in this dialog box.
To setup the debugger in this dialog box, refer to "5 Setup the Debugger ".
After the setup of a debugger, it will function as a debugger.
REJ10J2120-0100 Rev. 1.00
Dec. 01, 2010
Page 42 of 193
R32C/100 E30A Emulator Debugger
Chapter 6 Tutorial
6.2.2 Step2 : Checking the Operation of RAM
Check that RAM is operating correctly. Display and edit the contents of the memory in the [Memory] window to
check that the memory is operating correctly.
Note
The memory can be installed on the board in some microcomputers. In this case, however, the above way of
checking the operation of memory may be inadequate. It is recommended that a program for checking the memory
be created.
6.2.2.1 Checking the Operation of RAM
Select [Memory] from the [CPU] submenu of the [View] menu and enter the RAM address (Here, enter “400”) in the
[Display Address] edit boxes. The [Scroll Start Address] and [Scroll End Address] editing box is left to a default
setting. (By default, the scroll range is set to 0h to the maximum address of MCU.)
Note
The settings of the RAM area differ depending on the product. For details, refer to the hardware manual.
Click the [OK] button. The [Memory] window is displayed and shows the specified memory area.
Placing the mouse cursor on a point in the display of data in the [Memory] window and double-clicking allows the
values at that point to be changed.
REJ10J2120-0100 Rev. 1.00
Dec. 01, 2010
Page 43 of 193
R32C/100 E30A Emulator Debugger
Chapter 6 Tutorial
6.2.3 Step3 : Downloading the Tutorial Program
6.2.3.1 Downloading the Tutorial Program
Download the object program to be debugged. The download file and the address to be downloaded will depends on
the target mcu you uses. Please replace the screen image and addresses with corresponding one to your target mcu.
•
The Debugger for M16C/R8C, M32C or R32C
Select [Download module] from [Tutorial.x30] under [Download modules].
REJ10J2120-0100 Rev. 1.00
Dec. 01, 2010
Page 44 of 193
R32C/100 E30A Emulator Debugger
Chapter 6 Tutorial
6.2.3.2 Displaying the Source Program
This debugger allows the user to debug a user program at the source level.
Double-click [tutorial.c] under [C source file]. A [Editor(Source)] window opens and the contents of a "Tutorial.c" file
are displayed.
Select the [Format Views...] option from the [Setup] menu to set a font and size that are legible, if necessary.
Initially the [Editor(Source)] window shows the start of the user program, but the user can use the scroll bar to
scroll through the user program and look at the other statements.
REJ10J2120-0100 Rev. 1.00
Dec. 01, 2010
Page 45 of 193
R32C/100 E30A Emulator Debugger
Chapter 6 Tutorial
6.2.4 Step4 : Setting a Breakpoint
A software breakpoint is a basic debugging function.
The [Editor(Source)] window provides a very simple way of setting a software breakpoint at any point in a program.
6.2.4.1 Setting a Software Breakpoint
For example, to set a software breakpoint at the sort function call:
Double-click the [S/W breakpoints] column on the line containing the sort function call.
The red symbol will appear on the line containing the sort function call. This shows that a softwarebreak
breakpoint has been set.
REJ10J2120-0100 Rev. 1.00
Dec. 01, 2010
Page 46 of 193
R32C/100 E30A Emulator Debugger
Chapter 6 Tutorial
6.2.5 Step5 : Executing the Program
Execute the program as described in the following:
6.2.5.1 Resetting of CPU
To reset the CPU, select [Reset CPU] from the [Debug] menu, or click the [Reset CPU] button
on the toolbar.
6.2.5.2 Executing the Program
on the toolbar.
To execute the program, select [Go] from the [Debug] menu, or click the [Go] button
The program will be executed up to the breakpoint that has been set, and an arrow will be displayed in the [S/W
Breakpoints] column to show the position that the program has halted.
Note
When the source file is displayed after a break, a path of the source file may be inquired. In this case, please specify
the location of a source file.
REJ10J2120-0100 Rev. 1.00
Dec. 01, 2010
Page 47 of 193
R32C/100 E30A Emulator Debugger
Chapter 6 Tutorial
6.2.5.3 Reviewing Cause of the Break
The break factor is displayed in the [Output] window.
The user can also see the cause of the break that occurred last time in the [Status] window.
Select [Status] from the [CPU] submenu of the [View] menu. After the [Status] window is displayed, open the
[Platform] sheet, and check the Status of Cause of last break.
Please refer to "11 Display the Cause of the Program Stoppage " about the notation of a break factor.
REJ10J2120-0100 Rev. 1.00
Dec. 01, 2010
Page 48 of 193
R32C/100 E30A Emulator Debugger
Chapter 6 Tutorial
6.2.6 Step6 : Reviewing Breakpoints
The user can see all the breakpoints set in the program in the [Breakpoints] dialog box.
6.2.6.1 Reviewing Breakpoints
Push the key Ctrl+B, and the [Breakpoints] dialog box will be displayed.
This window allows the user to delete, enable, or disable breakpoints.
REJ10J2120-0100 Rev. 1.00
Dec. 01, 2010
Page 49 of 193
R32C/100 E30A Emulator Debugger
Chapter 6 Tutorial
6.2.7 Step7 : Viewing Register
The user can see all registers/flags value in the [Register] window.
6.2.7.1 Viewing Register
Select [Registers] from the [CPU] submenu of the [View] menu. The [Register] window is displayed.
The figure below shows a Register window of the debugger for M16C/R8C.
6.2.7.2 Setting the Register Value
You can change a register/flag value from this window.
Double-click the register line to be changed. The dialog is opened. Enter the value to be changed.
REJ10J2120-0100 Rev. 1.00
Dec. 01, 2010
Page 50 of 193
R32C/100 E30A Emulator Debugger
Chapter 6 Tutorial
6.2.8 Step8 : Viewing Memory
When the label name is specified, the user can view the memory contents that the label has been registered in the
[ASM Watch] window.
6.2.8.1 Viewing Memory
For example, to view the memory contents corresponding to __msize in word size:
Select [ASM Watch] from the [Symbol] submenu of the [View] menu, open the [ASM Watch] window.
And click the [ASM Watch] window with the right-hand mouse button and select [Add...] from the popup menu,
enter __msize in the [Address] edit box, and set Word in the [Size] combo box.
Click the [OK] button. The [ASM Watch] window showing the specified area of memory is displayed.
REJ10J2120-0100 Rev. 1.00
Dec. 01, 2010
Page 51 of 193
R32C/100 E30A Emulator Debugger
Chapter 6 Tutorial
6.2.9 Step9 : Watching Variables
As the user steps through a program, it is possible to watch that the values of variables used in the user program
are changed.
6.2.9.1 Watching Variables
For example, set a watch on the long-type array a declared at the beginning of the program, by using the following
procedure:
Click the left of displayed array a in the [Editor(Source)] window to position the cursor, and select [Add C Watch...]
with the right-hand mouse button. The [Watch] tab of [C watch] window in which the variable is displayed opens.
The user can click mark '+' at the left side of array a in the [C Watch] window to watch all the elements.
REJ10J2120-0100 Rev. 1.00
Dec. 01, 2010
Page 52 of 193
R32C/100 E30A Emulator Debugger
Chapter 6 Tutorial
6.2.9.2 Registering Variable
The user can also add a variable to the [C Watch] window by specifying its name.
Click the [C Watch] window with the right-hand mouse button and select [Add...] from the popup menu.
The following dialog box will be displayed. Enter variable i.
Click the [OK] button. The [C Watch] window will now also show the int-type variable i.
REJ10J2120-0100 Rev. 1.00
Dec. 01, 2010
Page 53 of 193
R32C/100 E30A Emulator Debugger
Chapter 6 Tutorial
6.2.10 Step10 : Stepping Through a Program
This debugger provides a range of step menu commands that allow efficient program debugging.
1.
Step In
Executes each statement, including statements within functions(subroutines).
2.
Step Out
Steps out of a function(subroutine), and stops at the statement following the statement in the program that
called the function(subroutine).
3.
Step Over
Executes a function(subroutine) call in a single step.
4.
Step...
Steps the specified times repeatedly at a specified rate.
6.2.10.1 Executing [Step In] Command
The [Step In] command steps into the called function(subroutine) and stops at the first statement of the called
function(subroutine).
To step through the sort function, select [Step In] from the [Debug] menu, or click the [Step In] button
the toolbar.
The PC cursor moves to the first statement of the sort function in the [Editor(Source)] window.
REJ10J2120-0100 Rev. 1.00
Dec. 01, 2010
on
Page 54 of 193
R32C/100 E30A Emulator Debugger
Chapter 6 Tutorial
6.2.10.2 Executing [Step Out] Command
The [Step Out] command steps out of the called function(subroutine) and stops at the next statement of the calling
statement in the main function.
To step out of the sort function, select [Step Out] from the [Debug] menu, or click the [Step Out] button
the toolbar.
The PC cursor slips out of a sort function, and moves to the position before a change function.
on
Note
It takes time to execute this function. When the calling source is clarified, use [Go To Cursor].
REJ10J2120-0100 Rev. 1.00
Dec. 01, 2010
Page 55 of 193
R32C/100 E30A Emulator Debugger
Chapter 6 Tutorial
6.2.10.3 Executing [Step Over] Command
The [Step Over] command executes a function (subroutine) call as a single step and stops at the next statement of
the main program.
To step through all statements in the change function at a single step, select [Step Over] from the [Debug] menu, or
on the toolbar.
click the [Step Over] button
The PC cursor moves to the next position of a change function.
REJ10J2120-0100 Rev. 1.00
Dec. 01, 2010
Page 56 of 193
R32C/100 E30A Emulator Debugger
Chapter 6 Tutorial
6.2.11 Step11 : Forced Breaking of Program Executions
This debugger can force a break in the execution of a program.
6.2.11.1 Forced Breaking of Program Executions
Cancel all breaks.
To execute the remaining sections of the main function, select [Go] from the [Debug] menu or the [Go] button
on the toolbar.
The program goes into an endless loop. To force a break in execution, select [Halt Program] from the [Debug] menu
or the [Halt] button
on the toolbar.
REJ10J2120-0100 Rev. 1.00
Dec. 01, 2010
Page 57 of 193
R32C/100 E30A Emulator Debugger
Chapter 6 Tutorial
6.2.12 Step12 : Displaying Local Variables
The user can display local variables in a function using the [C Watch] window.
6.2.12.1 Displaying Local Variables
For example, we will examine the local variables in the tutorial function, which declares three local variables: i, j,
and p_sam.
Select [C Watch] from the [Symbol] submenu of the [View] menu. The [C Watch] window is displayed. By default,
[C watch] window has four tabs as following:
•
[Watch] tab
Only the variable which the user registered is displayed.
[Local] tab
•
All the local variables that can be referred to by the scope in which the the PC exists are displayed. If
a scope is changed by program execution, the contents of the [Local] tab will also change.
[File Local] tab
•
All the file local variables of the file scope in which the PC exists are displayed. If a file scope is
changed by program execution, the contents of the [File Local] tab will also change.
[Global] tab
•
All the global variables currently used by the downloaded program are displayed.
Please choose the [Local] tab, when you display a local variable.
Double-click the mark '+' at the left side of pointer p_sam in the [Locals] window to display the structure *(p_sam).
When the user refers to the members of the structure at the end of the Tutorial function, it is clarified that random
data is sorted in descending order.
REJ10J2120-0100 Rev. 1.00
Dec. 01, 2010
Page 58 of 193
R32C/100 E30A Emulator Debugger
Chapter 6 Tutorial
6.2.13 Step13 : Stack Trace Function
The debugger uses the information on the stack to display the names of functions in the sequence of calls that led to
the function to which the program counter is currently pointing.
6.2.13.1 Reference the function call status
Double-click the [S/W Breakpoints] column in the sort function and set a software breakpoint.
To executes the user program from the reset vector address, select [Reset Go] from the [Debug] menu, or click the
on the toolbar.
[Reset Go] button
After the break in program execution, select [Stack Trace] from the [Code] submenu of the [View] menu to open the
[Stack Trace] window.
The upper figure shows that the position of the program counter is currently at the selected line of the sort()
function, and that the sort() function is called from the tutorial() function.
REJ10J2120-0100 Rev. 1.00
Dec. 01, 2010
Page 59 of 193
R32C/100 E30A Emulator Debugger
Chapter 6 Tutorial
6.2.14 What Next?
This tutorial has described the usage of this debugger.
Sophisticated debugging can be carried out by using the emulation functions that the emulator offers. This provides
for effective investigation of hardware and software problems by accurately isolating and identifying the conditions
under which such problems arise.
REJ10J2120-0100 Rev. 1.00
Dec. 01, 2010
Page 60 of 193
Reference
61
(Blank Page)
62
R32C/100 E30A Emulator Debugger
Chapter 7 Windows/Dialogs
7.
Windows/Dialogs
The window of this debugger is shown below.
Window Name
RAM Monitor Window
ASM Watch Window
C Watch Window
Script Window
S/W Break Point Setting Window
Event Setting Window
Time Measurement Window
Trace Window
GUI I/O Window
MR Window
MR Trace Window
MR Analyze Window
View Menu
[View]->[CPU]->[RamMonitor]
[View]->[Symbol]->[ASMWatch]
[View]->[Symbol]->[CWatch]
[View]->[Script]
[View]->[Break]->[S/W Break Points]
[View]->[Trace]->[Trace Points]
[View]->[Break]->[H/W Break Points]
[View]->[Trace]->[Time Measure]
[View]->[Trace]->[Trace]
[View]->[Graphic]->[GUI I/O]
[View]->[RTOS]->[MR]
[View]->[RTOS]->[MR Trace]
[View]->[RTOS]->[MR Analyze]
For the reference of the following windows, refer to the help attached to a High-performance Embedded Workshop
main part.
•
•
•
•
•
•
•
•
•
•
•
•
•
Differences Window
Map Window
Command Line Window
Workspace Window
Output Window
Disassembly Window
Memory Window
IO Window
Status Window
Register Window
Image Window
Waveform Window
Stack Trace Window
REJ10J2120-0100 Rev. 1.00
Dec. 01, 2010
Page 63 of 193
R32C/100 E30A Emulator Debugger
Chapter 7 Windows/Dialogs
7.1 RAM Monitor Window
The RAM monitor window is a window in which changes of memory contents are displayed while running the
target program.
The displayed contents are updated at given intervals while running the target program.
•
•
•
This system has 1 Kbytes of RAM monitor area which can be located in any contiguous address
location or in 64 separate blocks comprised of 16 bytes each.
The RAM monitor area can be changed to any desired address range.
Refer to "7.1.2 Setting the RAM monitor area" for details on how to change the RAM monitor area.
The display content updating interval can be set for each window individually.
The actual updating interval at which the display contents are actually updated while running the
target program is shown in the title field of the Address display area.
ATTENTION
•
The interval time at which intervals the display is updated may be longer than the specified interval
depending on the operating condition (shown below).
- Host machine performance/load condition
- Communication interface
- Window size (memory display range) or the number of windows displayed
REJ10J2120-0100 Rev. 1.00
Dec. 01, 2010
Page 64 of 193
R32C/100 E30A Emulator Debugger
Chapter 7 Windows/Dialogs
7.1.1 Extended Menus
This window has the following popup menus that can be brought up by right-clicking in the window.
Menu
RAM Monitor Area...
Sampling Period...
Clear
Up
Down
Address...
Scroll Area...
Data Length
Radix
Code
Layout
1byte
2bytes
4bytes
8bytes
Hex
Dec
Single Dec
Oct
Bin
ASCII
SJIS
JIS
UNICODE
EUC
Float
Double
Label
Register
Code
Column...
Split
Toolbar display
Customize toolbar...
Allow Docking
Hide
REJ10J2120-0100 Rev. 1.00
Dec. 01, 2010
Function
Set RAM monitor base address.
Set RAM monitor sampling period.
Clear access attribute.
Moves display position to the immediately preceding RAM
monitor area (smaller address)
Moves display position to the immediately following RAM
monitor area (larger address)
Display from specified address.
Specify scroll range.
Display in 1Byte unit.
Display in 2Byte unit.
Display in 4Byte unit.
Display in 8Byte unit.
Display in Hexadecimal.
Display in Decimal.
Display in Signed Decimal.
Display in Octdecimal.
Display in Binary.
Display as ASCII character.
Display as SJIS character.
Display as JIS character.
Display as UNICODE character.
Display as EUC character.
Display as Floating-point.
Display as Double Floating-point.
Switch display or non-display of Label area.
Switch display or non-display of Register area.
Switch display or non-display of Code area.
Set the number of columns displayed on one line.
Split window.
Display toolbar.
Open toolbar customize dialog box.
Allow window docking.
Hide window.
Page 65 of 193
R32C/100 E30A Emulator Debugger
Chapter 7 Windows/Dialogs
7.1.2 Setting the RAM monitor area
Choose the popup menu [RAM Monitor Area...] in the RAM monitor window.
The RAM monitor area setup window shown below will appear. The currently set RAM monitor areas are listed in
this window.
Use this window to add, delete or change RAM monitor areas.
•
Specify a RAM monitor area by its start address and size (the latter by a number of blocks.)
•
The start address can be specified in 0x10 byte units.
If you specify a non-aligned address value, it is rounded off to the nearest address value in 0x10 byte
units before being set.
•
Specify the size of the RAM monitor area by a number of blocks.
For the E30A, one block is 16 bytes in size. Up to 64 blocks can be specified.
RAM monitor areas can be added until the total number of blocks used reaches 64.
•
(The number of blocks (and the size) that are currently available to use are displayed below the list.)
REJ10J2120-0100 Rev. 1.00
Dec. 01, 2010
Page 66 of 193
R32C/100 E30A Emulator Debugger
Chapter 7 Windows/Dialogs
7.1.2.1 Changing the RAM Monitor Area
The start address and the size of the RAM monitor area can be changed.
•
Changing from a dialog box
Select the RAM monitor area you want to change from a list of RAM monitor areas and double-click
on it.
The Set RRAM Area dialog box shown below will appear. Specify the start address and the size (by a
number of blocks) of the RAM monitor area in the Start and the Size fields of this dialog box.
•
Changing directly in the window
Select the RAM monitor area you want to change from a list of RAM monitor areas and click again in
its Start display column or Size display column.
Specify a new start address or a new size with which you want to be changed in the ensuing edit box.
Press the Enter key to confirm what you've entered, or the Esc key to cancel.
7.1.2.2 Adding RAM Monitor Areas
Click the [Add...] button.
The Set RRAM Area dialog box will appear. Specify the start address and the size (by a number of blocks) of a new
RAM monitor area in the Start and the Size fields of this dialog box.
7.1.2.3 Deleting RAM Monitor Areas
Select the RAM monitor area you want to delete from a list of RAM monitor areas and click the [Remove] button.
To delete all RAM monitor areas, click the [Remove All] button.
7.1.2.4 Setting the RAM monitor event
To set the RAM monitor event, select the below check box.
The RAM monitor event is set to the event E5.
Please note that the RAM monitor function doesn't operate when the RAM monitor event is not set.
REJ10J2120-0100 Rev. 1.00
Dec. 01, 2010
Page 67 of 193
R32C/100 E30A Emulator Debugger
Chapter 7 Windows/Dialogs
7.2 ASM Watch Window
The ASM watch window is a window in which you can register specific addresses as watchpoints and inspect
memory contents at those addresses.
If a registered address resides within the RAM monitor area, the memory content at that address is updated at
given intervals (by default, every 100 ms) during program execution.
•
The addresses to be registered are called the "watchpoints." One of the following can be registered:
- Address (can be specified using a symbol)
- Address + Bit number
- Bit symbol
•
The registered watchpoints are saved in the debugger when the ASM watch window is closed and are
automatically registered when the window is reopened.
If symbols or bit symbols are specified for the watchpoints, the watchpoint addresses are
•
recalculated when downloading the target program.
The invalid watchpoints are marked by "-<not active>-" when displayed on the screen.
•
The order in which the watchpoints are listed can be changed by a drag-and-drop operation.
•
•
The watchpoint expressions, sizes, radixes and datas can be changed by in-place editing.
ATTENTION
•
•
The RAM monitor function of this debugger is realized with memory dump. Real-time capability is
impaired when this function is used.
The background color by the access attribute cannot be changed.
REJ10J2120-0100 Rev. 1.00
Dec. 01, 2010
Page 68 of 193
R32C/100 E30A Emulator Debugger
Chapter 7 Windows/Dialogs
7.2.1 Extended Menus
This window has the following popup menus that can be brought up by right-clicking in the window.
Menu
Add...
Add Bit...
Remove
Remove All
Set...
Radix
Refresh
Layout
RAM Monitor
Toolbar display
Customize toolbar...
Allow Docking
Hide
REJ10J2120-0100 Rev. 1.00
Dec. 01, 2010
Bin
Dec
Hex
Address Area
Size Area
Enable RAM Monitor
Sampling Period...
Function
Add watchpoint.
Add bit-lebel watchpoint.
Remove the selected watchpoint.
Remove all watchpoints.
Set new data to selected watchpoint.
Display in Binary.
Display in Decimal.
Display in Hexadecimal.
Refresh memory data.
Switch display or non-display of Address area.
Switch display or non-display of Size area.
Switch enable or disable RAM moniter function.
Set RAM monitor sampling period.
Display toolbar.
Open toolbar customize dialog box.
Allow window docking.
Hide window.
Page 69 of 193
R32C/100 E30A Emulator Debugger
Chapter 7 Windows/Dialogs
7.3 C Watch Window
The C Watch Window displays C/C++ expressions and their values (results of calculations).
The C/C++ expressions displayed in the C Watch Window are known as C watchpoints. The displays of the results
of calculating the C watchpoints are updated each time a command is executed.
When RAM monitor function is effective and the C watch points are within the RAM monitor area, the displayed
values are updated during execution of the target program.
-
•
Variables can be inspected by scope (local, file local or global).
•
The display is automatically updated at the same time the PC value changes.
•
Variable values can be changed.
•
The display radix can be changed for each variable individually.
The initial display radix can be changed.
Leading-zero suppression is selectable in hexadecimal display.
•
Any variable can be registered to the Watch tab, so that it will be displayed at all times:
The registered content is saved for each project separately.
If two or more of the C watch window are opened at the same time, the registered.
The reference scope of the variable is selectable from current scope, global scope and each file's scopes.
•
The C watchpoints can be registered to separate destinations by adding Watch tabs.
•
Variables can be registered from another window or editor by a drag-and-drop operation.
•
The C watchpoints can be sorted by name or by address.
•
The RAM monitor can be allocated to the address of specified variable
REJ10J2120-0100 Rev. 1.00
Dec. 01, 2010
Page 70 of 193
R32C/100 E30A Emulator Debugger
Chapter 7 Windows/Dialogs
ATTENTION
•
You cannot change the values of the C watch points listed below:
- Register variables
- C watch point which does not indicate an address(invalid C watch point)
If a C/C++ language expression cannot be calculated correctly (for example, when a C/C++ symbol
•
has not been defined), it is registered as invalid C watch point.
It is displayed as "--<not active>--". If that C/C++ language expression can be calculated correctly at
the second time, it becomes an effective C watch point.
•
The display settings of the Local, File Local and Global tabs are not saved. The contents of the Watch
tab and those of newly added tabs are saved.
The variables, which are changed in RAM monitor function, are global variables and file local
•
variables only.
The RAM monitor function of this debugger is realized with memory dump. Real-time capability is
•
impaired when this function is used.
The background color by the access attribute cannot be changed.
•
About more information for C variables, please refer to "12.1.3 Get or set C variables"
REJ10J2120-0100 Rev. 1.00
Dec. 01, 2010
Page 71 of 193
R32C/100 E30A Emulator Debugger
Chapter 7 Windows/Dialogs
7.3.1 Extended Menus
This window has the following popup menus that can be brought up by right-clicking in the window.
Menu
Add...
Remove
Remove All
Initialize
Set New Value...
Radix
Hex
Bin
Default
Toggle(All Variables)
Set initial...
Refresh
Hide type name
Show char* as string
Zero suppress in Hex display
Sort
Sort by Name
Sort by Address
RAM Monitor
Enable RAM Monitor
Sampling Period...
Arrange a RAM monitor
area around this variable
Start Recording...
Stop Recording
Add New Tab...
Remove Tab
Copy
Copy All
Toolbar display
Customize toolbar...
Allow Docking
Hide
REJ10J2120-0100 Rev. 1.00
Dec. 01, 2010
Function
Add C watchpoint.
Remove the selected C watchpoint.
Remove all C watchpoints.
Reevaluates the selected C watchpoint.
Set new data to selected C watchpoint.
Display in Hexadecimal.
Display in Binary.
Display in Default Radix.
Change radix (toggle).
Set initial radix.
Refresh memory data.
Hide type names from variables.
Selects whether to display char* type as a string.
Suppress zero in Hex display.
Sort variables by its name.
Sort variables by its address.
Switch enable or disable RAM monitor function.
Set RAM monitor sampling period.
Arrange a RAM monitor area around this variable.
Start to record the updated values.
Stop recording the updated values.
Add new tab.
Remove the selected tab.
Copy the selected item to the clipboard.
Copy the all items in the sheet to the clipboard.
Display toolbar.
Open toolbar customize dialog box.
Allow window docking.
Hide window.
Page 72 of 193
R32C/100 E30A Emulator Debugger
Chapter 7 Windows/Dialogs
7.4 Script Window
The Script Window displays the execution of text -format script commands and the results of that execution.
Script commands can be executed using a script file or interactively. You can also write script commands in the
script file so that they are automatically executed. The results of script command execution can also be stored in a
previously specified log file.
•
•
•
•
The Script Window has a view buffer that stores the results of executing the last 1000 lines. The
results of execution can therefore be stored in a file (view file) without specifying a log file.
When a script file is opened, the command history area changes to become the script file display area
and displays the contents of the script file. When script files are nested, the contents of the last
opened script file are displayed. The script file display area shows the line currently being executed
in inverse vide.
When a script file is open, you can invoke script commands from the command input area provided
the script file is not being executed.
The Script Window can record the history of the executed commands to a file. This function is not the
same as the log function. This function records not the result but only the executed commands, so the
saved files can be used as the script files.
REJ10J2120-0100 Rev. 1.00
Dec. 01, 2010
Page 73 of 193
R32C/100 E30A Emulator Debugger
Chapter 7 Windows/Dialogs
7.4.1 Extended Menus
This window has the following popup menus that can be brought up by right-clicking in the window.
Menu
Script
View
Log
Record
Open...
Run
Step
Close
Save...
Clear
On...
Off
On...
Off
Copy
Paste
Cut
Delete
Undo
Toolbar display
Customize toolbar...
Allow Docking
Hide
REJ10J2120-0100 Rev. 1.00
Dec. 01, 2010
Function
Open script file.
Run script file.
One step execution of script file.
Close script file.
Save view buffer to file.
Clear view buffer.
Open log file and start recording (start output to file).
Close log file and end recording (stop output to file).
Record the executed commands to a file.
Stop recording the executed commands.
Copy the selection and put it on the Clipboard.
Insert Clipboard contents.
Cut the selection and put it on the Clipboard.
Erase the selection.
Undo the last action.
Display toolbar.
Open toolbar customize dialog box.
Allow window docking.
Hide window.
Page 74 of 193
R32C/100 E30A Emulator Debugger
Chapter 7 Windows/Dialogs
7.5 S/W Break Point Setting Window
The S/W Break Point Setting window allows you to set software break points.
Software breaks stop the execution of instructions immediately before the specified break point.
•
•
•
•
If you have set multiple software breakpoints, program execution stops when any one software break
address is encountered (OR conditions).
You can continue to set software breakpoints until you click the "Close" button to close the S/W
Break Point Setting Window.
You can clear, enable or disable software breakpoints selected by clicking in the software breakpoint
display area. You can also enable and disable software breakpoints by double-clicking on them.
Click on the "Save" button to save the software break points in the file. To reload software break
point settings from the saved file, click the "Load" button. If you load software break points from a
file, they are added to any existing break points.
REJ10J2120-0100 Rev. 1.00
Dec. 01, 2010
Page 75 of 193
R32C/100 E30A Emulator Debugger
Chapter 7 Windows/Dialogs
7.5.1 Command Button
The buttons on this window has the following meanings.
Button
Load...
Save...
Help
Add
Refer...
Close
Delete
Delete All
Enable
All Enable
Disable
All Disable
View
Function
Load setting information from a file in which it was saved.
Save the contents set in the window to a file.
Display the help of this window.
Add the break point.
Open file selection dialog box.
Close the window.
Remove the selected break point.
Remove all break points.
Enable the selected break points.
Enable all break points.
Disable the selected break point.
Disable all break points.
Shows the selected breakpoint positions in the Editor(Source) window.
REJ10J2120-0100 Rev. 1.00
Dec. 01, 2010
Page 76 of 193
R32C/100 E30A Emulator Debugger
Chapter 7 Windows/Dialogs
7.5.2 Setting and Deleting a Break Points from Editor(Source) Window
The area which can be set in the software breakpoint is different according to the product. Please refer to "12.1.2
Area where software breakpoint can be set" for details.
You can set break points in the Editor(Source) Window. To do so, double-click the break point setting area ("S/W
breakpoints" column) for the line in which you want to set the break. (A red marker is displayed on the line to
which the break point was set.)
You can delete the break point by double-clicking again in the break point setting area ("S/W breakpoints" column).
In the Editor(Source) window, a display of "S/W breakpoints" column is set to "Enable" by default. To erase this
column, deselect the [S/W breakpoints] check box in the dialog box opened by choosing the main menu - [Edit] ->
[Define Column Format]. The "S/W breakpoints" column is erased from all Editor (Source) windows. And select
popup menu - [Columns] -> [S/W breakpoints] in the Editor (Source) window, A column can be set up for each
Editor (Source) windows.
REJ10J2120-0100 Rev. 1.00
Dec. 01, 2010
Page 77 of 193
R32C/100 E30A Emulator Debugger
Chapter 7 Windows/Dialogs
7.6 Event Setting Window
The Event Setting window is used to set break events, trace events, time measurement events, and RAM monitor
event.
•
If the contents of events are altered, they are marked by an asterisk (*) on the title bar. The
asterisks (*) are not displayed after setting up the emulator.
A total of 8 events comprised of break events, trace events, and interval time measurement events
•
can be used. The combinatorial conditions of events are as follows:
− Trace when one of the valid events is established. (OR condition)
− Events occur in a specified order. (Sequential condition)
ATTENTION
•
•
To change an already set event to another event, clear the currently set event in the EVENT area
first before setting a new event.
The combinatorial event condition of Sequential can be specified for only break events.
REJ10J2120-0100 Rev. 1.00
Dec. 01, 2010
Page 78 of 193
R32C/100 E30A Emulator Debugger
Chapter 7 Windows/Dialogs
7.6.1 Specify the Event
To set events, double-click in the event setting area of the Event Setting Window. This opens an event setting
dialog box.
The type of event you specify can be changed by altering Event Type in this dialog box.
If you set events in the Set Event Status dialog box, they will be set as unused events. Unused events are searched
in the order shown below.
E7 -> E6 -> E3 -> E2 -> E1 -> E5 -> E4 -> E0
The events E0 and E4 and the event E5 are assigned lower priorities because the former are special events for
specifying the trace or the start and end of time measurement, and the latter is a data comparison break event or
the RAM monitor event.
You also can set events directly in the event setting area of the Event Setting Window. Select the line for the event
you want to set and then click on a condition to select.
The following can be set up as a condition of each event.
REJ10J2120-0100 Rev. 1.00
Dec. 01, 2010
Page 79 of 193
R32C/100 E30A Emulator Debugger
Chapter 7 Windows/Dialogs
7.6.1.1 Select the access condition
Select the access condition for an event to occur. Use the ACCESS area of the Event Setting Window to make this
selection.
ACCESS Condition
EXECUTION
BRANCH
READ
WRITE
R/W
Content
Instruction Execution
Branch
Data Read
Data Write
Data Read or Data Write
The ACCESS conditions that can be specified for each event are listed below.
Event
ACCESS Condition
EXECUTION BRANCH
Break event
Yes
Trace event(Trace pickup event)
No
Trace event(Trace start event and Trace end Yes
event)
Interval time measurement event
No
RAM monitor event
No
READ
WRITE
R/W
No
Yes
No
Yes
Yes
Yes
Yes
Yes
Yes
Yes
Yes
Yes
No
No
Yes
No
Yes
No
Yes
No
7.6.1.2 Select address match or range specification
Select address match or range specification as the address range condition for an event to occur. Use the RANGE
area of the Event Setting Window to make this selection.
RANGE Condition
EQU
IN(START)
IN(END)
Content
Address match
Address range specification (Start Address)
Address range specification (End Address)
Address range specification cannot be set for the events that have had EXECUTION selected in ACCESS condition.
Note also that only the following combinations of events can be selected.
•
E0(Start Address) and E1(End Address)
•
E2(Start Address) and E3(End Address)
•
E4(Start Address) and E5(End Address)
•
E6(Start Address) and E7(End Address)
REJ10J2120-0100 Rev. 1.00
Dec. 01, 2010
Page 80 of 193
R32C/100 E30A Emulator Debugger
Chapter 7 Windows/Dialogs
7.6.2 Select the action condition by which an event is assumed to have occurred
Select the action condition by which an event is assumed to have occurred. Use the ACTION area of the Event
Setting Window to make this selection.
Any event selected in the EVENT area is displayed in different colors depending on the event action you have
selected for it in the ACTION area. The display color can be changed using the Color button.
ACTION Condition
BREAK
TRACE PICKUP
TIME START
TIME END
TIME
TRACE START
TRACE END
RAM MONITOR
Content
Break
Trace Pickup
Execution time measuring start
Execution time measuring end
Interval time measurement
Tracing start
Tracing end
RAM monitor function use
Color
Red
Green
Yellow
Yellow
Orange
Blue
Blue
Purple
The ACTION conditions that can be specified for each event are listed below.
ACTION Condition
Event
BREAK
TRACE
PICKUP
TIME
START
TIME
END
TIME
TRACE
START
TRACE
END
RAM
MONITOR
Event E0
Event E1
Event E2
Event E3
Event E4
Event E5
Event E6
Event E7
Yes
Yes
Yes
Yes
Yes
Yes
Yes
Yes
Yes
Yes
Yes
Yes
Yes
Yes
Yes
Yes
Yes
No
No
No
No
No
No
No
No
No
No
No
Yes
No
No
No
No
Yes
Yes
Yes
No
Yes
Yes
Yes
Yes
No
No
No
No
No
No
No
No
No
No
No
Yes
No
No
No
No
No
No
No
No
Yes
No
No
REJ10J2120-0100 Rev. 1.00
Dec. 01, 2010
Page 81 of 193
R32C/100 E30A Emulator Debugger
Chapter 7 Windows/Dialogs
7.6.3 Select the Combinatorial Condition
Select the combinatorial conditions of an event. Use the EVENT and the SEQ areas of the Event Setting Window to
make this selection.
•
Select the OR Condition In the EVENT area you can select an use event.
•
Select the Sequential Condition In the SEQ area you can select an event for which the Sequential
condition is to be set. Sequential condition can only be selected for break events. However, if the
event E5 is used to set a data comparison break event or the RAM monitor event, you cannot specify
Sequential for the event E5.
Sequential Condition
Ex -> Ex-1
Content
Single Condition
Sequential Condition
The Sequential condition can also be selected using the Sequential button.
Click on the button between the events for which you want to specify the Sequential condition. Transition between
the events will be shown by an arrow. The Sequential condition can only be specified for the events that have been
set as break events. Example: To set successively occurring events as in E3 -> E2 -> E1 -> E0
The Sequential condition can be specified for two to eight events. You also can specify multiple Sequential
conditions in pairs. If the Sequential condition is specified for the event En, that event and the event En-1 are
specified to be Sequential. The Sequential condition can be specified in order of events En, En-1, En-2, and so on.
For example, the Sequential condition can be specified for events E2 -> E1 -> E0, but cannot be specified in order of
E0 -> E1 -> E2, or in order of E3 -> E0, etc.
REJ10J2120-0100 Rev. 1.00
Dec. 01, 2010
Page 82 of 193
R32C/100 E30A Emulator Debugger
Chapter 7 Windows/Dialogs
7.6.4 Setting the RAM monitor event
To set the RAM monitor event, select the below check box.
The RAM monitor event is set to the event E5.
Please note that the RAM monitor function doesn't operate when the RAM monitor event is not set.
ATTENTION
•
Only when RAM monitor mode is selected in the Debugging Mode tab of the Init dialog, RAM
monitor function can be used.
7.6.5 Select the Trace Range
A trace range can be selected for the trace event concerned.
A trace measurement of up to 8M cycles can be recorded.
Trace Area
Break
Before
After
Full
Content
Stores the 8M cycles to the point at which the target program stops.
Stores the 8M cycles to the point at which the trace point is passed.
Stores the 8M cycles of trace data after the trace point.
Stores the 8M cycles of trace data after the trace starts.
ATTENTION
•
Only when Trace mode is selected in the Debugging Mode tab of the Init dialog, Trace function can
be used.
REJ10J2120-0100 Rev. 1.00
Dec. 01, 2010
Page 83 of 193
R32C/100 E30A Emulator Debugger
Chapter 7 Windows/Dialogs
7.6.6 Select the Trace Mode
The trace mode can be selected.
Mode
Trace priority
MCU execution priority
Content
The Trace priority mode gives priority to the trace data output, and the
MCU execution is delayed.
The MCU execution priority mode gives priority to the MCU execution, and
the trace range is 512 cycles.
The kind of trace data to record is displayed in the trace kind column.
Kind
Branch/Data Access
Branch(Compression)
Content
Branch trace, Data access trace
Condition branch trace
ATTENTION
•
Only when Trace mode is selected in the Debugging Mode tab of the Init dialog, Trace function can
be used.
7.6.7 Setting the execution time measurement
The trace mode can be selected.
The Execution time measurement event is set to the event E0 and the event E4.
Please note that the execution time measurement function doesn't operate when the Execution time measurement
event is not set.
ATTENTION
•
Only when Time measurement mode is selected in the Debugging Mode tab of the Init dialog,
Execution time measurement function can be used.
REJ10J2120-0100 Rev. 1.00
Dec. 01, 2010
Page 84 of 193
R32C/100 E30A Emulator Debugger
Chapter 7 Windows/Dialogs
7.6.8 Command Button
The buttons at the bottom of the Event Setting window have the following meanings.
Button Name
Color...
Reset
Save...
Load...
Set
Close
Content
Change the display color of the event list.
Discards the contents being displayed in the window and loads contents from
the emulator in which they were set.
Saves the contents set in the window to a file.
Loads event information from a file in which it was saved.
Sends the contents set in the window to the emulator.
Closes the window.
REJ10J2120-0100 Rev. 1.00
Dec. 01, 2010
Page 85 of 193
R32C/100 E30A Emulator Debugger
Chapter 7 Windows/Dialogs
7.6.9 Setting and Deleting a Break Points from Editor(Source) Window
You can set break points in the Editor(Source) Window. To do so, double-click the break point setting area ("H/W
Breakpoints" column) for the line in which you want to set the break. (A blue marker is displayed on the line to
which the break point was set.)
You can delete the break point by double-clicking again in the break point setting area ("H/W Breakpoints" column).
In the Editor(Source) window, a display of "H/W Breakpoints" column is set to "Enable" by default. To erase this
column, deselect the [H/W Breakpoints] check box in the dialog box opened by choosing the main menu - [Edit] ->
[Define Column Format]. The "H/W Breakpoints" column is erased from all Editor (Source) windows. And select
popup menu - [Columns] -> [H/W Breakpoints] in the Editor (Source) window, A column can be set up for each
Editor (Source) windows.
REJ10J2120-0100 Rev. 1.00
Dec. 01, 2010
Page 86 of 193
R32C/100 E30A Emulator Debugger
Chapter 7 Windows/Dialogs
7.6.10 Specify the Break Events
To specify an break event, select Break on the Event Type of the Event Select dialog box.
Following events can be set for an break event.
•
Instruction Execution
To specify an instruction execution event, select the "EXECUTION" in the ACCESS area of the event.
The event is established immediately before executing the instruction at a specified address.
Memory Access
•
To specify a memory access event, select the "READ" or "WRITE or "R/W" in the ACCESS area of the
event. The event is established when memory is accessed at the specified address or under conditions
set for the specified address range. When specifying a break event for memory access, you can
specify the data to be compared with the data written/read to or from a specified address. You also
can specify mask bits for the comparison data.
7.6.10.1 Instruction Execution of Specified Address
Specify the following.
Example) Instruction execution at address F81000h
REJ10J2120-0100 Rev. 1.00
Dec. 01, 2010
Page 87 of 193
R32C/100 E30A Emulator Debugger
Chapter 7 Windows/Dialogs
7.6.10.2 Writing/Reading a Specified Address
Set as below.
Example) Writing to address 4100h
Example) Writing byte length data 32h to address 4100h
REJ10J2120-0100 Rev. 1.00
Dec. 01, 2010
Page 88 of 193
R32C/100 E30A Emulator Debugger
Chapter 7 Windows/Dialogs
Example) Writing word length data 1234h to address 4100h
ATTENTION
•
•
•
Data comparison can be specified for the event E5 only when Trace mode is selected in the
Debugging Mode tab of the Init dialog.
If the event E5 is used for a break event without data comparison, be sure to specify 0000h for the
mask value. Furthermore, if it is used for data comparison in byte units, specify 00FFh for the mask
value. Note that data comparison in word units beginning with an odd address can also be specified.
If data comparison is set, the real-time capability of the user program execution will be lost.
REJ10J2120-0100 Rev. 1.00
Dec. 01, 2010
Page 89 of 193
R32C/100 E30A Emulator Debugger
Chapter 7 Windows/Dialogs
7.6.10.3 Reading/writing data to the specified address range
Set as below.
Example) Writing data to addresses ranging from 4100h to 41FFh
7.6.10.4 Entering to specified function
Set as below.
Example) Entering a break to function name “change”
REJ10J2120-0100 Rev. 1.00
Dec. 01, 2010
Page 90 of 193
R32C/100 E30A Emulator Debugger
Chapter 7 Windows/Dialogs
7.6.11 Specify the Event Combination Condition
Break events can be used in one of the following combinations. (A total of 8 events comprised of break events, trace
events, and time measurement events in combination can be specified.)
•
•
One of the specified events is established. (OR condition)
Events occur in a specified order. (Sequential condition)
7.6.11.1 Select OR
Check (turn on) an event in the event specification area that you want to use.
7.6.11.2 Select Sequential
Use the Sequential button.
Click on the button between the events for which you want to specify the Sequential condition. Transition between
the events will be shown by an arrow. The Sequential condition can only be specified for the events that have been
set as break events. However, if the event E5 is used to set a data comparison break event, you cannot specify
Sequential for the event E5.
The Sequential condition can be specified for two to eight events. You also can specify multiple Sequential
conditions in pairs.
If the Sequential condition is specified for the event En, that event and the event En-1 are specified to be
Sequential.
The Sequential condition can be specified in order of events En, En-1, En-2, and so on. For example, the Sequential
condition can be specified for events E2 -> E1 -> E0, but cannot be specified in order of E0 -> E1 -> E2, or in order
of E3 -> E0, etc.
Example: To set successively occurring events as in E3 -> E2 -> E1 -> E0
REJ10J2120-0100 Rev. 1.00
Dec. 01, 2010
Page 91 of 193
R32C/100 E30A Emulator Debugger
Chapter 7 Windows/Dialogs
Example: To set successively occurring events as in E3 -> E2 and E7 -> E6 -> E5
7.6.12 Specify the Trace Events
To specify a trace event, select Trace Point on the Trace/Time Measurement tab of the Event Select dialog box.
For the trace event, you can specify a branch trace event that records jump address information or a data trace
event that records data access information. For whichever trace event to be set, you should specify trace conditions
as necessary.
Note that you can set both branch trace event and data trace event, so that mixed information can be recorded.
When the trace event are not set, the trace function is the condition branch trace. The condition branch trace is
recorded by compressing information of the condition branch instruction.
Therefore, the condition branch trace can record the execution history more than the branch trace.
The following shows the trace conditions that can be set.
•
Specify the branch trace event
The new instruction address fetched at the jump address is recorded.
To specify an branch trace event, select the "BRANCH" in the ACCESS area of the event. The branch trace
event can specify only the setting that records jump address information in the entire address range.
Specify the following.
Example: To record the jump address information in the entire address range
REJ10J2120-0100 Rev. 1.00
Dec. 01, 2010
Page 92 of 193
R32C/100 E30A Emulator Debugger
Chapter 7 Windows/Dialogs
•
Specify the data trace event
The access information to the specified address is recorded. To specify an data trace event, select the
"READ/WRITE/RW" in the ACCESS area of the event. The event is established when memory is accessed at
the specified address or under conditions set for the specified address range.
Specify the following.
Example: To record the data writes to the address 4100h
REJ10J2120-0100 Rev. 1.00
Dec. 01, 2010
Page 93 of 193
R32C/100 E30A Emulator Debugger
Chapter 7 Windows/Dialogs
•
Specify the condition branch trace
The jump address information in the entire address range is recorded.
Please remove all the trace events.
REJ10J2120-0100 Rev. 1.00
Dec. 01, 2010
Page 94 of 193
R32C/100 E30A Emulator Debugger
Chapter 7 Windows/Dialogs
7.6.12.1 Specifying a trace range for the trace event to be set
To set a trace event, you need to specify a trace range. Event setting conditions differ depending on mode specified
for a trace range.
The specifiable trace range and event setting conditions are shown below.
•
Specify Break or Full for the trace range for the trace event to be set
Specify any address or address range as you set a trace event. By default, Break is set for the trace range,
and events for recording jump address information in the entire address range are set in E6 and E7 as the
trace event.
Default setting
Trace conditions (branch trace/data trace) should be specified in the ACCESS area of the event used. To
specify an address range, use range specification of the event. The following shows a combination of events
for which a range can be specified.
•
Combination of E0 and E1
•
Combination of E2 and E3
•
Combination of E4 and E5
•
Combination of E6 and E7
To perform a trace with any condition you specified, change the above setting.
Specify the following.
REJ10J2120-0100 Rev. 1.00
Dec. 01, 2010
Page 95 of 193
R32C/100 E30A Emulator Debugger
Chapter 7 Windows/Dialogs
Example: To record data writes to the 4100h, 4110h and 4120h in Full mode
To set a data write to the addresses 4110h and 4120h, open the Set Event Status dialog box
again and change the address in the Address1 text box shown above to register it as
addition.
REJ10J2120-0100 Rev. 1.00
Dec. 01, 2010
Page 96 of 193
R32C/100 E30A Emulator Debugger
•
Chapter 7 Windows/Dialogs
Specify Before for the trace range for the trace event to be set
Set the trace start event (only event E0 specifiable) and the trace end event (only event E4 specifiable) and
then specify any address or address range to set a trace event.
In Before mode, the debugger records the trace events that have occurred from the trace start event
(program started running) till the condition for the trace end event is met.
For the trace start event, set a trace start for Before mode (by specifying the current PC value for the address
and EXECUTION for the ACCESS condition) in the event E0. For the trace end event, set any address and
ACCESS condition in the event E4 as the trace end condition.
Trace conditions (branch trace/data trace) should be specified in the ACCESS area of the event used. To
specify an address range, use range specification of the event. The events that can be combined in range
specification are limited to those given below because the events E0 and E4 are used for the trace start and
trace end events.
Combination of E2 and E3
•
Combination of E6 and E7
•
By default, events for recording jump address information in the entire address range are set in E6 and E7
as the trace event.
Specify the following.
Example: To record jump address information in the entire address range in Before mode and specify
instruction execution at the address F82000h as the trace end condition
To perform a trace with any condition you specified, change the above setting.
Specify the following.
REJ10J2120-0100 Rev. 1.00
Dec. 01, 2010
Page 97 of 193
R32C/100 E30A Emulator Debugger
Chapter 7 Windows/Dialogs
Example: To record data writes in the range 4100h to 41FFh in Before mode and specify data writes at the
address 4200h as the trace end condition
REJ10J2120-0100 Rev. 1.00
Dec. 01, 2010
Page 98 of 193
R32C/100 E30A Emulator Debugger
•
Chapter 7 Windows/Dialogs
Specify After for the trace range for the trace event to be set
Set the trace start event (only event E0 specifiable) and the trace end event (only event E4 specifiable) and
then specify any address or address range to set a trace event.
In After mode, the debugger records the trace events that have occurred from when the condition for the
trace start event was met till when the program has stopped running.
For the trace start event, set any address and ACCESS condition in the event E0 as the trace start condition.
For the trace end event, set a condition unlikely to occur (e.g., 0h is specified for the address while WRITE is
specified for the ACCESS condition) in the event E4 as the trace end event for After mode.
Trace conditions (branch trace/data trace) should be specified in the ACCESS area of the event used. To
specify an address range, use range specification of the event. The events that can be combined in range
specification are limited to those given below because the events E0 and E4 are used for the trace start and
trace end events.
Combination of E2 and E3
•
Combination of E6 and E7
•
By default, events for recording jump address information in the entire address range are set in E6 and E7
as the trace event.
Specify the following.
Example: To record data access (data read and data write) in the entire address range in After mode and
specify data writes at the address 4100h as the trace start condition
To perform a trace with any condition you specified, change the above setting. Specify the following.
REJ10J2120-0100 Rev. 1.00
Dec. 01, 2010
Page 99 of 193
R32C/100 E30A Emulator Debugger
Chapter 7 Windows/Dialogs
Example: To record data writes to the 4100h, 4110h and 4120h in After mode and and specify data writes at
the address 4010h as the trace start condition
To set a data write to the addresses 4110h and 4120h, open the Set Event Status dialog box
again and change the address in the Address1 text box shown above to register it as
addition.
ATTENTION
•
•
•
•
In Before and After modes, the debugger records the trace events that have occurred within the trace
range, as well as the trace start events that occurred during that time. Note that no trace end events
are recorded.
The condition branch trace might take time to display the disassemble mode and the source mode of
the trace window.
When the MCU execution priority mode is selected in the trace mode, the trace range is 512 cycles.
Please select the Trace priority mode in the trace mode when the trace range is 8M cycles. The Trace
priority mode gives priority to the trace data output, and the MCU execution is delayed. This mode
requires a program processing time more than in MCU execution priority mode. When the condition
branch trace, the trace mode is the Trace priority mode.
Only when Trace mode is selected in the Debugging Mode tab of the Init dialog, Trace function can
be used.
REJ10J2120-0100 Rev. 1.00
Dec. 01, 2010
Page 100 of 193
R32C/100 E30A Emulator Debugger
Chapter 7 Windows/Dialogs
7.6.13 Specify the Time Measurement Events
To specify an time measurement event, double-click to the event setting area. This opens an event setting dialog
box. Select Time Measurement on the Event Type of the event setting dialog box.
There are the following measurement functions in the time measurement.
•
Execution time measurement
Measuring the program execution time from when the program started to when it stops.
•
Interval time measurement
Measuring the interval time from Start Event to End Event.
Following events can be set for an interval time measurement event.
−
Memory Access
To specify a memory access event, select the "READ or WRITE or R/W" in the ACCESS area of the
event. The event is established when memory is accessed at the specified address.
Set the measurement events (measurement start event and measurement end event) at the
Measurement Condition of the Time Measurement Window.
7.6.13.1 Specify the Execution Time Measurement Events
•
Measuring the program execution time from when the program started to when it stops
Select the below check box.
The Execution time measurement event is set to the event E0 and the event E4.
Please note that the execution time measurement function doesn't operate when the Execution time
measurement event is not set.
REJ10J2120-0100 Rev. 1.00
Dec. 01, 2010
Page 101 of 193
R32C/100 E30A Emulator Debugger
Chapter 7 Windows/Dialogs
7.6.13.2 Specify the Interval Time Measurement Events
•
Writing/Reading a Specified Address
Set as below.
Example: Writing to address 410h
Example: Writing byte length data 32h to address 420h
REJ10J2120-0100 Rev. 1.00
Dec. 01, 2010
Page 102 of 193
R32C/100 E30A Emulator Debugger
Chapter 7 Windows/Dialogs
Example: Writing word length data 1234h to address 430h
ATTENTION
•
Only when Time measurement mode is selected in the Debugging Mode tab of the Init dialog,
Execution time measurement function can be used.
REJ10J2120-0100 Rev. 1.00
Dec. 01, 2010
Page 103 of 193
R32C/100 E30A Emulator Debugger
Chapter 7 Windows/Dialogs
7.7 Time Measurement Window
The Time Measurement window displays the minimum/maximum/average execution time and measurement count
at any measurement point. The execution time of up to 3 measurement points can be measured simultaneously.
You can specify the event for the measurement condition in the same manner as when specifying events in the
Event Setting Window.
•
If the contents of events are altered, they are marked by an asterisk (*) on the title bar. The
asterisks (*) are not displayed after setting up the emulator.
ATTENTION
•
The Event Setting Window and the Time Measure Windows use the same resource of the emulator.
If the event settings are modified in Time Measure Window, settings of the Event Setting Window
are modified, too.
REJ10J2120-0100 Rev. 1.00
Dec. 01, 2010
Page 104 of 193
R32C/100 E30A Emulator Debugger
Chapter 7 Windows/Dialogs
7.7.1 Specify the Time Measurement Event
The events listed below can be specified as measurement events.
•
Memory Access
To set events, double-click to the event setting area of the Time Measurement Window. This opens an event setting
dialog box.
For details on how to specify an interval time measurement event, see "7.6.13 Specify the Time Measurement
Events."
7.7.2 Time Measurement Condition
For the time measurement conditions, the following can be specified for each measurement interval.
Measures the time in an interval from where the start event is
established till where the end event is established.
Measures the time from where an event is established till
where the next event is established.
7.7.3 Command Button
The buttons on this window has the following meanings.
Button
Function
Reset
Discards the contents being displayed in the window and loads contents from the
emulator in which they were set.
Saves the contents set in the window to a file.
Loads event information from a file in which it was saved.
Sends the contents set in the window to the emulator.
Closes the window.
Save...
Load...
Set
Close
REJ10J2120-0100 Rev. 1.00
Dec. 01, 2010
Page 105 of 193
R32C/100 E30A Emulator Debugger
Chapter 7 Windows/Dialogs
7.7.4 Set the Measurement Condition
For the debugger, the following measurement conditions can be specified.
•
Measure the execution time between the events.
•
Measure the event occurrence cycle.
Up to three measurement intervals can be specified. To specify measurement intervals, double-click any line
(MP1-MP3) in the Measurement Point group of the Interval Time Measure Window. This opens a dialog box for
specifying measurement conditions.
7.7.4.1 Measure the execution time between the events
1.
2.
Set the measurement events (measurement start event and measurement end event).
Specify the following in the Measurement Condition Designation dialog.
REJ10J2120-0100 Rev. 1.00
Dec. 01, 2010
Page 106 of 193
R32C/100 E30A Emulator Debugger
Chapter 7 Windows/Dialogs
7.7.4.2 Measure the event occurrence cycle
1.
2.
Set the measurement event (measurement start event only).
Specify the following in the Measurement Condition Designation dialog.
REJ10J2120-0100 Rev. 1.00
Dec. 01, 2010
Page 107 of 193
R32C/100 E30A Emulator Debugger
Chapter 7 Windows/Dialogs
7.7.5 Reference the time measurement results
7.7.5.1 Reference the execution time measurement results
The point execution time measurement results are displayed in the Platform tab of the Status window.
The cumulative result is displayed when measured two or more times.
7.7.5.2 Reference the interval time measurement results
The point time measurement results are displayed at the bottom of the Point Time Measurement window.
Min
Max
Avg
Cnt
Minimum execution time
Maximum execution time
Average execution time
Measurement count
7.7.5.3 Clear the measurement results
Click the button of the measurement result to be cleared.
You can clear all the measurement results by clicking the ALL button.
REJ10J2120-0100 Rev. 1.00
Dec. 01, 2010
Page 108 of 193
R32C/100 E30A Emulator Debugger
Chapter 7 Windows/Dialogs
7.8 Trace Window
The Trace Window is used to display the results of real-time trace measurement.
•
Bus mode
This mode allows you to inspect cycle-by-cycle bus information. The display content depends on the
MCU and simulator system used. In addition to bus information, this mode allows disassemble,
source line or data access information to be displayed in combination.
•
Disassemble mode
This mode allows you to inspect the executed instructions. In addition to disassemble information,
this mode allows source line or data access information to be displayed in combination.
•
Data access mode
This mode allows you to inspect the data read/write cycles. In addition to data access information,
this mode allows source line information to be displayed in combination.
•
Source mode
This mode allows you to inspect the program execution path in the source program.
The measurement result is displayed when a trace measurement has finished. When a trace measurement restarts,
the window display is cleared.
The range of a trace measurement can be altered in the Trace Point Setting Window. For details about this window,
refer to "7.6 Event Setting Window" With default settings, the trace information immediately before the program
has stopped is recorded.
7.8.1 Configuration of Bus Mode
When bus mode is selected, trace information is displayed in bus mode. Bus mode is configured as shown below.
The display content in bus mode differs depending on the MCU or simulator system used.
REJ10J2120-0100 Rev. 1.00
Dec. 01, 2010
Page 109 of 193
R32C/100 E30A Emulator Debugger
Chapter 7 Windows/Dialogs
1.
Cycle display area: Shows trace cycles. Double-click here to bring up a dialog box to change the displayed
cycle.
2.
Label display area: Shows labels corresponding to address bus information. Double-click here to bring up a
dialog box to search for addresses.
3.
Bus information display area: The content displayed here differs depending on the MCU or simulator system
used.
- Refer to "7.8.6 Display of bus information on the R32C Debugger"
4.
Time information display area: Shows time information of trace measurement result. One of the following
three modes can be selected from the menu. (Not supported.)
- Absolute Time:Shows an elapsed time from the time the program started running up to now in terms of
absolute time (default).
- Differences:Shows a differential time from the immediately preceding cycle.
- Relative Time:Shows a relative time from the selected cycle. Note, however, that this mode changes to the
absolute time display mode when the trace measurement result is updated.
5.
Acquired range of trace measurement result: Shows the currently acquired range of trace measurement result.
6.
Trace measurement range: Shows the currently set range of trace measurement.
7.
First line cycle: Shows the cycle of the first line displayed.
8.
First line address: Shows the address of the first line displayed.
9.
First line time: First line time: Shows the time information of the first line displayed.
10. Window splitting box: Double-clicking this box splits the window into parts.
In addition to bus information, the window can display disassemble, source line or data access information in
combination. In this case, the display will be similar to the one shown below.
REJ10J2120-0100 Rev. 1.00
Dec. 01, 2010
Page 110 of 193
R32C/100 E30A Emulator Debugger
Chapter 7 Windows/Dialogs
7.8.2 Configuration of Disassemble Mode
When disassemble mode is selected while bus mode is unselected, trace information is displayed in disassemble
mode. Disassemble mode is configured as shown below.
1.
2.
3.
4.
Address display area: Shows addresses corresponding to instructions. Double-click here to bring up a dialog
box to search for addresses.
Object code display area: Shows the object codes of instructions.
Label display area: Shows labels corresponding to instruction addresses. Double-click here to bring up a dialog
box to search for addresses.
Mnemonic display area: Shows the mnemonics of instructions.
Other display areas are the same as in bus mode.
In addition to disassemble information, the window can display source line or data access information in
combination. In this case, the display will be similar to the one shown below.
REJ10J2120-0100 Rev. 1.00
Dec. 01, 2010
Page 111 of 193
R32C/100 E30A Emulator Debugger
Chapter 7 Windows/Dialogs
7.8.3 Configuration of Data Access Mode
When data access mode is selected while bus mode and disassemble mode are unselected, trace information is
displayed in data access mode. Data access mode is configured as shown below.
1.
Data access display area: Shows data access information. If the information displayed here is "000400 1234
W," for example, it means that data "1234H" was written to the address 000400H in 2-byte width.
Other display areas are the same as in bus mode.
In addition to data access information, the window can display source line information in combination. In this case,
the display will be similar to the one shown below.
REJ10J2120-0100 Rev. 1.00
Dec. 01, 2010
Page 112 of 193
R32C/100 E30A Emulator Debugger
Chapter 7 Windows/Dialogs
7.8.4 Configuration of Source Mode
When only source mode is selected, trace information is displayed in source mode. Source mode is configured as
shown below.
1.
2.
3.
4.
5.
6.
7.
8.
Line number display area: Shows the line number information of the displayed file. Double-click here to bring
up a dialog box to change the displayed file.
Address display area: Shows addresses corresponding to source lines. Double-click here to bring up a dialog
box to search for addresses.
Referenced cycle display area: Shows the currently referenced cycle that is marked by ">>." Furthermore, the
addresses corresponding to source lines, if any, are marked by "-."
Source display area: Shows the content of the source file.
File name: Shows the file name of the currently displayed source file.
Referenced cycle: Shows the currently referenced cycle.
Referenced address: Shows the address corresponding to the currently referenced cycle.
Referenced time: Shows the time information corresponding to the currently referenced cycle.
Other display areas are the same as in bus mode.
REJ10J2120-0100 Rev. 1.00
Dec. 01, 2010
Page 113 of 193
R32C/100 E30A Emulator Debugger
Chapter 7 Windows/Dialogs
7.8.5 Extended Menus
This window has the following popup menus that can be brought up by right-clicking in the window.
Menu
BUS
DIS
SRC
DATA
View
Time
Cycle...
Address...
Source...
Absolute Time
Differences
Trace
Relative Time
Forward
Backward
Step
Come
Stop
Restart
Layout...
Copy
Save...
Load...
Toolbar display
Customize toolbar...
Allow Docking
Hide
REJ10J2120-0100 Rev. 1.00
Dec. 01, 2010
Function
Display the information of BUS mode.
Display the information of Disassemble mode.
Display the information of Source mode.
Display the information of Data access mode.
Changes the displayed position by specifying a cycle.
Changes the displayed position by searching an address.
Display a selected source file.
Shows elapsed time from the time the program started
running up to now in terms of absolute time.
Shows a differential time from the immediately preceding
displayed cycle.
Shows a relative time from the currently selected cycle.
Changes the direction of search to forward direction.
Changes the direction of search to reverse direction.
Searches in Step mode in the specified direction of search.
Searches in Come mode in the specified direction of search.
Stops trace measurement in the middle and displays the
measured content at the present point of time.
Restarts trace measurement.
Change layout of the corrent view.
Copy selected lines.
Save trace data to file.
Load trace data from file.
Display toolbar.
Open toolbar customize dialog box.
Allow window docking.
Hide window.
Page 114 of 193
R32C/100 E30A Emulator Debugger
Chapter 7 Windows/Dialogs
7.8.6 Display of bus information on the R32C Debugger
From left to right, the contents are as follows:
•
Src, Dest
The status of the address bus
Data
•
The status of the data bus
Size
•
The data access size
Representation
B
W
L
Q
•
BIU status
8bit
16bit
32bit
64bit
Status
The status between the memory and I/O.
Representation Status
JMP
Jump/Return
RD
WR
•
Read access
Write access
Factor
Records as branch information.
Src is branch instruction address. Dest is jump address.
Records as data access information.
Records as data access information.
Jcnd
The status ('0' true or '1' false) of the condition branch instruction.
REJ10J2120-0100 Rev. 1.00
Dec. 01, 2010
Page 115 of 193
R32C/100 E30A Emulator Debugger
Chapter 7 Windows/Dialogs
7.9 GUI I/O Window
The GUI I/O window allows you for port input by creating a user target system key input panel (button) in the
window and clicking the created button. And this window also allows you to implement the user target system
output panel in the window.
•
You can arrange the following parts on the window.
- Label (character string)
Displays/erases a character string specified by the user when any value is written to the specified address
(bit).
- LED
Changes the display color of any area when any value is written to the specified address (bit). (Substitution
for LED ON)
- Button
A virtual port input can be executed at the time the button is pressed.
- Text
Display the text string.
•
You can also save the created panel in a file and reload it.
•
You can set up to 200 address points to the created part. If different addresses are set to the
individual parts, you can arrange up to 200 parts.
REJ10J2120-0100 Rev. 1.00
Dec. 01, 2010
Page 116 of 193
R32C/100 E30A Emulator Debugger
Chapter 7 Windows/Dialogs
7.9.1 Extended Menus
This window has the following popup menus that can be brought up by right-clicking in the window.
Menu
Select Item
Delete
Copy
Paste
Create Button
Create Label
Create LED
Create Text
Display grid
Save...
Load...
Sampling Period...
Toolbar display
Customize toolbar...
Allow Docking
Hide
REJ10J2120-0100 Rev. 1.00
Dec. 01, 2010
Function
Select an I/O item.
Delete the selected I/O item.
Copy the selected I/O item.
Paste the copied I/O item.
Create a new button item.
Create a new label item.
Create a new LED item.
Create a new text item.
Display the grid line.
Save I/O panel file.
Load I/O panel file.
Set RAM monitor sampling period.
Display toolbar.
Open toolbar customize dialog box.
Allow window docking.
Hide window.
Page 117 of 193
R32C/100 E30A Emulator Debugger
Chapter 7 Windows/Dialogs
7.10 MR Window
Use the MR Window to display the status of the realtime OS.
You can only use the MR Window when you have downloaded a program that uses the realtime OS (if the
downloaded program does not use the MR, nothing is displayed in the MR Window when it is opened.)
•
•
•
•
•
•
You can open the MR window as many as the number of display modes .
By clicking the desired button, the MR window display mode changes and the display data also
changes.
By double-clicking the desired task line, you can display the context data of the task.
You can drag the cursor to change the width of the display area in each mode.
If the downloaded program does not use MR, you cannot select all the menu which will select the
display mode.
The usable display mode depends on MRxx.
ATTENTION
Please use the startup file (crt0mr.axx/start.axx) whose contents matches with the version of MRxx, when you
make downloaded program. The MR Window and MR command will not run properly if the startup file you uses
don't match with the version of MRxx.
REJ10J2120-0100 Rev. 1.00
Dec. 01, 2010
Page 118 of 193
R32C/100 E30A Emulator Debugger
Chapter 7 Windows/Dialogs
7.10.1 Extended Menus
This window has the following popup menus that can be brought up by right-clicking in the window.
Menu
Mode
Context...
Layout
Refresh
RAM Monitor
Toolbar display
Customize toolbar...
Allow Docking
Hide
*: Not supported.
REJ10J2120-0100 Rev. 1.00
Dec. 01, 2010
Task
Ready Queue
Timeout Queue
Event Flag
Semaphore
Mailbox
Data Queue
Cyclic Handler
Alarm Handler
Memory Pool
Message Buffer*
Port
Mailbox(with Priority)
Status Bar
Enable RAM Monitor
Sampling Period...
Function
Displays Task status.
Displays Ready status.
Displays Timeout status.
Displays Event Flag status.
Displays Semaphore status.
Displays Mailbox status.
Displays Data Queue status.
Displays Cyclic Handler status.
Displays Alarm Handler status.
Displays Memory Pool status.
Displays Message Buffer status.
Displays Port status.
Displays Mailbox(with Priority) status.
Displays Context.
Switch display or non-display of status bar.
Refresh memory data.
Switch enable or disable RAM Monitor function.
Set RAM Monitor sampling period.
Display toolbar.
Open toolbar customize dialog box.
Allow window docking.
Hide window.
Page 119 of 193
R32C/100 E30A Emulator Debugger
Chapter 7 Windows/Dialogs
7.10.2 Display the Task Status
In the MR window, select Popup Menu - [Mode] -> [Task].
By double-clicking any line, the information on the task context is displayed in the Context dialog. For details on
the Context dialog, see "7.10.12 Display the Task Context"
The following data is displayed in the status bar.
7.10.2.1 Display the Task Status(When the realtime OS is MRxx conformed to uITRON specifications V.3.0.)
All the tasks defined in the configuration are listed in the order of ID number. The function of each item is as
described below. (When the realtime OS is MRxx conformed to uITRON specifications V.3.0.)
Items
Contents
ID
StaAddr
(name)
Pri
Status*1
wup_count
timeout
flg_ptn
flg_mode*2
Task ID
Starting address of task
Task name
Priority
Task status
Wake-up count
Timeout value
Wait bit pattern of event flag
Wait cancellation condition of event flag
REJ10J2120-0100 Rev. 1.00
Dec. 01, 2010
Page 120 of 193
R32C/100 E30A Emulator Debugger
•
Chapter 7 Windows/Dialogs
*1Task Status
Display
Status
RUN
RDY
SUS
DMT
WAI(SLP)
WAI(SLP)-SUS
WAI(SLP-TMO)
WAI(SLP-TMO)-SUS
WAI(DLY)
WAI(DLY)-SUS
WAI(FLG)
WAI(FLG)-SUS
WAI(FLG-TMO)
WAI(FLG-TMO)-SUS
WAI(SEM)
WAI(SEM)-SUS
WAI(SEM-TMO)
WAI(SEM-TMO)-SUS
WAI(MBX)
WAI(MBX)-SUS
WAI(MBX-TMO)
WAI(MBX-TMO)-SUS
RUNNING state
READY state
SUSPENDED state
DORMANT state
Sleeping state
Sleeping state (suspended)
Sleeping state with time-out
Sleeping state with time-out (suspended)
Delayed state due to dly_tsk
Delayed state due to dly_tsk (suspended)
Waiting state for an eventflag
Waiting state for an eventflag (suspended)
Waiting state for an eventflag with time-out
Waiting state for an eventflag with time-out (suspended)
Waiting state for a semaphore resource
Waiting state for a semaphore resource (suspended)
Waiting state for a semaphore resource with time-out
Waiting state for a semaphore resource with time-out (suspended)
Receiving waiting state for a mailbox
Receiving waiting state for a mailbox (suspended)
Receiving waiting state for a mailbox with time-out
Receiving waiting state for a mailbox with time-out (suspended)
•
*2Display the Wait Cancellation Condition of Event Flag
flg_mode
Status
TWF_ANDW
Waits for all bits set in the wait bit pattern to be set (AND
wait)
Clears the event flag to 0 when an AND wait has occurred
and the task wait status has been cancelled
Waits for any one bit set in the wait bit pattern to be set
(OR wait)
Clears the event flag to 0 when an OR wait has occurred
and the task wait status has been cancelled
TWF_ANDW+TWF_CLR
TWF_ORW
TWF_ORW+TWF_CLR
REJ10J2120-0100 Rev. 1.00
Dec. 01, 2010
Page 121 of 193
R32C/100 E30A Emulator Debugger
Chapter 7 Windows/Dialogs
7.10.2.2 Display the Task Status(When the realtime OS is MRxx conformed to uITRON specifications V.4.0.)
All the tasks defined in the configuration are listed in the order of ID number. The function of each item is as
described below. (When the realtime OS is MRxx conformed to uITRON specifications V.4.0.)
Items
Contents
ID
Name
Pri
Status*1
Wupcnt
Actcnt
Tmout
Flgptn
Wfmode*2
Task ID
Task name
Priority
Task status
Wake-up count
Activated count
Timeout value
Wait bit pattern of event flag
Wait cancellation condition of event flag
REJ10J2120-0100 Rev. 1.00
Dec. 01, 2010
Page 122 of 193
R32C/100 E30A Emulator Debugger
•
Chapter 7 Windows/Dialogs
*1Task Status
Display
Status
RUN
RDY
SUS
DMT
WAI(SLP)
WAI(SLP)-SUS
WAI(SLP-TMO)
WAI(SLP-TMO)-SUS
WAI(DLY)
WAI(DLY)-SUS
WAI(FLG)
WAI(FLG)-SUS
WAI(FLG-TMO)
WAI(FLG-TMO)-SUS
WAI(SEM)
WAI(SEM)-SUS
WAI(SEM-TMO)
WAI(SEM-TMO)-SUS
WAI(MBX)
WAI(MBX)-SUS
WAI(MBX-TMO)
WAI(MBX-TMO)-SUS
WAI(SDTQ)
WAI(SDTQ)-SUS
WAI(SDTQ-TMO)
WAI(SDTQ-TMO)-SUS
WAI(RDTQ)
WAI(RDTQ)-SUS
WAI(RDTQ-TMO)
WAI(RDTQ-TMO)-SUS
WAI(VSDTQ)
WAI(VSDTQ)-SUS
WAI(VSDTQ-TMO)
WAI(VSDTQ-TMO)-SUS
RUNNING state
READY state
SUSPENDED state
DORMANT state
Sleeping state
Sleeping state (suspended)
Sleeping state with time-out
Sleeping state with time-out (suspended)
Delayed state due to dly_tsk
Delayed state due to dly_tsk (suspended)
Waiting state for an eventflag
Waiting state for an eventflag (suspended)
Waiting state for an eventflag with time-out
Waiting state for an eventflag with time-out (suspended)
Waiting state for a semaphore resource
Waiting state for a semaphore resource (suspended)
Waiting state for a semaphore resource with time-out
Waiting state for a semaphore resource with time-out (suspended)
Receiving waiting state for a mailbox
Receiving waiting state for a mailbox (suspended)
Receiving waiting state for a mailbox with time-out
Receiving waiting state for a mailbox with time-out (suspended)
Sending waiting state for a data queue
Sending waiting state for a data queue (suspended)
Sending waiting state for a data queue with time-out
Sending waiting state for a data queue with time-out (suspended)
Receiving waiting state for a data queue
Receiving waiting state for a data queue (suspended)
Receiving waiting state for a data queue with time-out
Receiving waiting state for a data queue with time-out (suspended)
Sending waiting state for an extended data queue
Sending waiting state for an extended data queue (suspended)
Sending waiting state for an extended data queue with time-out
Sending waiting state for an extended data queue with time-out
(suspended)
Receiving waiting state for an extended data queue
Receiving waiting state for an extended data queue (suspended)
Receiving waiting state for an extended data queue with time-out
Receiving waiting state for an extended data queue with time-out
(suspended)
Waiting state for a fixed-sized memory block
Waiting state for a fixed-sized memory block (suspended)
Waiting state for a fixed-sized memory block with time-out
Waiting state for a fixed-sized memory block with time-out
(suspended)
WAI(VRDTQ)
WAI(VRDTQ)-SUS
WAI(VRDTQ-TMO)
WAI(VRDTQ-TMO)-SUS
WAI(MPF)
WAI(MPF)-SUS
WAI(MPF-TMO)
WAI(MPF-TMO)-SUS
REJ10J2120-0100 Rev. 1.00
Dec. 01, 2010
Page 123 of 193
R32C/100 E30A Emulator Debugger
•
Chapter 7 Windows/Dialogs
*2 Display the Wait Cancellation Condition of Event Flag
Wfmode
Status
TWF_ANDW
TWF_ORW
Waits for all bits set in the wait bit pattern to be set (AND wait)
Waits for any one bit set in the wait bit pattern to be set (OR wait)
7.10.3 Display the Ready Queue Status
In the MR window, select Popup Menu - [Mode] -> [Ready Queue].
The following data is displayed in the status bar.
7.10.3.1 Display the Ready Queue Status(When the realtime OS is MRxx conformed to uITRON specifications
V.3.0.)
The function of each item is as described below. (When the realtime OS is MRxx conformed to uITRON
specifications V.3.0.)
Item
Contents
Pri
RdyQ
Displays priority
Shows the ID Nos. and task names of tasks in the ready queue
•
Up to 8 characters of the task name is displayed in the RdyQ field. When the task name exceeds 8
characters, the extra characters are omitted.
7.10.3.2 Display the Ready Queue Status(When the realtime OS is MRxx conformed to uITRON specifications
V.4.0.)
The function of each item is as described below. (When the realtime OS is MRxx conformed to uITRON
specifications V.4.0.)
Item
Contents
Pri
Ready Queue
Displays priority
Shows the ID Nos. and task names of tasks in the ready queue
•
Up to 8 characters of the task name is displayed in the Ready Queue field. When the task name
exceeds 8 characters, the extra characters are omitted.
REJ10J2120-0100 Rev. 1.00
Dec. 01, 2010
Page 124 of 193
R32C/100 E30A Emulator Debugger
Chapter 7 Windows/Dialogs
7.10.4 Display the Timeout Queue Status
In the MR window, select Popup Menu - [Mode] -> [Timeout Queue].
7.10.4.1 Display the Timeout Queue Status(When the realtime OS is MRxx conformed to uITRON specifications
V.3.0.)
The function of each item is as described below.
Tasks waiting at present are displayed in the descending order of timeout value. (When the realtime OS is MRxx
conformed to uITRON specifications V.3.0.)
Item
Contents
Value
ID(name)
Shows the timeout value of each task
Shows the ID No. and task name of the tasks in the timeout queue
•
Following character strings are used to indicate the type of wait state.
Character string
Wait state
[slp]
[dly]
[flg]
[sem]
[mbx]
Wait due to tslp_tsk
Wait due to dly_tsk
Wait due to twai_flg
Wait due to twai_sem
Wait due to trcv_msg
•
When a task connected to the timeout queue is in the state of forced waiting (double waiting), a
string "[s]", which indicates double waiting, is appended to a string displayed in the ID (name) field.
Normal display
Display when in WAIT-SUSPEND
REJ10J2120-0100 Rev. 1.00
Dec. 01, 2010
26(_task26)
26(_task26)[s]
Page 125 of 193
R32C/100 E30A Emulator Debugger
Chapter 7 Windows/Dialogs
7.10.4.2 Display the Timeout Queue Status(When the realtime OS is MRxx conformed to uITRON specifications
V.4.0.)
The function of each item is as described below.
Tasks waiting at present are displayed in the descending order of timeout value. (When the realtime OS is MRxx
conformed to uITRON specifications V.4.0.)
Item
Contents
Tmout
ID(Name)
Shows the timeout value (ms) of each task
Shows the ID No. and task name of the tasks in the timeout queue
•
Following character strings are used to indicate the type of wait state.
Character string
Wait state
[slp]
[dly]
[flg]
[sem]
[mbx]
[mpf]
[sdtq]
[rdtq]
[vsdtq]
[vrdtq]
Wait due to tslp_tsk
Wait due to dly_tsk
Wait due to twai_flg
Wait due to twai_sem
Wait due to trcv_mbx
Wait due to tget_mpf
Wait due to tsnd_dtq
Wait due to trcv_dtq
Wait due to vtsnd_dtq
Wait due to vtrcv_dtq
•
When a task connected to the timeout queue is in the state of forced waiting (double waiting), a
string "[s]", which indicates double waiting, is appended to a string displayed in the ID(Name) field.
Normal display
Display when in WAIT-SUSPEND
REJ10J2120-0100 Rev. 1.00
Dec. 01, 2010
26(_task26)
26(_task26)[s]
Page 126 of 193
R32C/100 E30A Emulator Debugger
Chapter 7 Windows/Dialogs
7.10.5 Display the Event Flag Status
In the MR window, select Popup Menu - [Mode] -> [Event Flag].
7.10.5.1 Display the Event Flag Status(When the realtime OS is MRxx conformed to uITRON specifications V.3.0.)
All the event flags defined in the configuration are listed in the order of ID number. The function of each item is
listed below. (When the realtime OS is MRxx conformed to uITRON specifications V.3.0.)
Item
Contents
ID
flg_ptn
flagQ
ID No. of event flag
Bit pattern of each event flag
Task ID Nos. and task names in the event flag queue
•
When a task connected to the event flag queue is in the state of waiting with timeout enabled
(waiting in twai_flg), a string "[tmo]", which indicates a state of waiting with timeout enabled, is
appended to a string displayed in the flag Q field.
When a task connected to the event flag queue is in the state of forced waiting (double waiting), a
string "[s]", which indicates double waiting, is appended to a string displayed in the flag Q field.
Normal Display
Display when in WAIT-SUSPEND
Display when in WAIT-SUSPEND with time out
•
26(_task26)
26(_task26)[s]
26(_task26)[tmo][s]
Up to 8 characters can be displayed in the task name in the flag Q field.If a task name exceeds 8
characters, the extra characters are omitted.
7.10.5.2 Display the Event Flag Status(When the realtime OS is MRxx conformed to uITRON specifications V.4.0.)
All the event flags defined in the configuration are listed in the order of ID number. The function of each item is
listed below. (When the realtime OS is MRxx conformed to uITRON specifications V.4.0.)
Item
Contents
ID
Flgatr
Flgptn
Flag Queue
ID No. of event flag
Attribute of each event flag
Bit pattern of each event flag
Task ID Nos. and task names in the event flag queue
REJ10J2120-0100 Rev. 1.00
Dec. 01, 2010
Page 127 of 193
R32C/100 E30A Emulator Debugger
•
The following are displayed in the Flgatr area:
TA_TFIFO
TA_TPRI
TA_WSGL
TA_WMUL
TA_CLR
•
Task wait queue is in FIFO order
Task wait queue is in task priority order
Only one task is allowed to be in the waiting state for the eventflag
Multiple tasks are allowed to be in the waiting state for the eventflag
Eventflag's bit pattern is cleared when a task is released from the
waiting state for that eventflag
When a task connected to the event flag queue is in the state of waiting with timeout enabled
(waiting in twai_flg), a string "[tmo]", which indicates a state of waiting with timeout enabled, is
appended to a string displayed in the Flag Queue field.
When a task connected to the event flag queue is in the state of forced waiting (double waiting), a
string "[s]", which indicates double waiting, is appended to a string displayed in the Flag Queue
field.
Normal Display
Display when in WAIT-SUSPEND
Display when in WAIT-SUSPEND with time out
•
Chapter 7 Windows/Dialogs
26(_task26)
26(_task26)[s]
26(_task26)[tmo][s]
Up to 8 characters can be displayed in the task name in the Flag Queue field.If a task name exceeds
8 characters, the extra characters are omitted.
REJ10J2120-0100 Rev. 1.00
Dec. 01, 2010
Page 128 of 193
R32C/100 E30A Emulator Debugger
Chapter 7 Windows/Dialogs
7.10.6 Display the Semaphore Status
In the MR window, select Popup Menu - [Mode] -> [Semaphore].
7.10.6.1 Display the Semaphore Status(When the realtime OS is MRxx conformed to uITRON specifications V.3.0.)
All the SEMs defined in the configuration are listed in the order of ID number. The function of each item is listed
below. (When the realtime OS is MRxx conformed to uITRON specifications V.3.0.)
Item
Contents
ID
Def_cnt
Count
semQ
ID No. of semaphore
Default value of semaphore counter
Semaphore count
Task ID Nos. and task names in the semaphore queue
•
When a task connected to the SEM queue is in the state of waiting with timeout enabled (waiting in
twai_sem), a string "[tmo]", which indicates a state of waiting with timeout enabled, is appended to a
string displayed in the semQ field.
When a task connected to the SEM queue is in the state of forced waiting (double waiting), a string
"[s]", which indicates double waiting, is appended to a string displayed in the semQ field.
Normal Display
Display when in WAIT-SUSPEND
Display when in WAIT-SUSPEND with time out
•
26(_task26)
26(_task26)[s]
26(_task26)[tmo][s]
Up to 8 characters can be displayed in the task name in the semQ field.If a task name exceeds 8
characters, the extra characters are omitted.
7.10.6.2 Display the Semaphore Status (When the realtime OS is MRxx conformed to uITRON specifications V.4.0.)
All the SEMs defined in the configuration are listed in the order of ID number. The function of each item is listed
below. (When the realtime OS is MRxx conformed to uITRON specifications V.4.0.)
Item
Contents
ID
Sematr
Semcnt
Semaphore Queue
ID No. of semaphore
Attribute of each semaphore
Semaphore count
Task ID Nos. and task names in the semaphore queue
REJ10J2120-0100 Rev. 1.00
Dec. 01, 2010
Page 129 of 193
R32C/100 E30A Emulator Debugger
•
The following are displayed in the Sematr area:
TA_TFIFO
TA_TPRI
•
Chapter 7 Windows/Dialogs
Task wait queue is in FIFO order
Task wait queue is in task priority order
When a task connected to the SEM queue is in the state of waiting with timeout enabled (waiting in
twai_sem), a string "[tmo]", which indicates a state of waiting with timeout enabled, is appended to a
string displayed in the Semaphore Queue field.
When a task connected to the SEM queue is in the state of forced waiting (double waiting), a string
"[s]", which indicates double waiting, is appended to a string displayed in the Semaphore Queue
field.
Normal Display
Display when in WAIT-SUSPEND
Display when in WAIT-SUSPEND with time out
•
26(_task26)
26(_task26)[s]
26(_task26)[tmo][s]
Up to 8 characters can be displayed in the task name in the Semaphore Queue field.If a task name
exceeds 8 characters, the extra characters are omitted.
REJ10J2120-0100 Rev. 1.00
Dec. 01, 2010
Page 130 of 193
R32C/100 E30A Emulator Debugger
Chapter 7 Windows/Dialogs
7.10.7 Display the Mailbox Status
In the MR window, select Popup Menu - [Mode] -> [Mailbox].
7.10.7.1 Display the Mailbox Status (When the realtime OS is MRxx conformed to uITRON specifications V.3.0.)
All the mail boxes defined in the configuration are listed in the order of ID number. The function of each item is
listed below. (When the realtime OS is MRxx conformed to uITRON specifications V.3.0.)
Item
Contents
ID
Msg_cnt
MAXmsg
Wait Queue(Message)
ID No. of mailbox
Number of messages in each mailbox
Maximum number of messages that can be contained in each mailbox
The messages stored in the mailbox or ID No. and task name of tasks
waiting for messages
•
•
The WaitQueue (Message) field shows a string "Msg" when a message is stored (when Msg_cont as
described above is non-zero), and then displays the stored message.
When no message is stored (when Msg_cont is zero), the WaitQueue field displays a string "Task" if a
task waiting for a message exists, and then displays the ID number and name of the task waiting for
a message.
When a task connected to the mail box queue is in the state of waiting with timeout enabled (waiting
in trcv_msg), a string "[tmo]", which indicates the state of timeout enabled, is appended to a string
displayed in the WaitQueue (Message) field.
When a task connected to the mail box queue is in the state of forced waiting (Double waiting), a
string "[s]", which indicates the state of double waiting, is appended to a string displayed in the
WaitQueue (Message) field.
Normal Display
Display when in WAIT-SUSPEND
Display when in WAIT-SUSPEND with time out
•
26(_task26)
26(_task26)[s]
26(_task26)[tmo][s]
Up to 8 characters can be displayed in the task name in the WaitQueue (Message) field.
If a task name exceeds 8 characters, the extra characters are omitted.
REJ10J2120-0100 Rev. 1.00
Dec. 01, 2010
Page 131 of 193
R32C/100 E30A Emulator Debugger
Chapter 7 Windows/Dialogs
7.10.7.2 Display the Mailbox Status (When the realtime OS is MRxx conformed to uITRON specifications V.4.0.)
All the mail boxes defined in the configuration are listed in the order of ID number. The function of each item is
listed below. (When the realtime OS is MRxx conformed to uITRON specifications V.4.0.)
Item
Contents
ID
Mbxatr
Mailbox Queue (Wait)
Mailbox Queue (Message)
ID No. of mailbox
Attribute of each mailbox
ID No. and task name of tasks waiting for messages
The messages stored in the mailbox
•
The following are displayed in the Mbxatr area:
TA_TFIFO
TA_TPRI
TA_MFIFO
TA_MPRI
•
Task wait queue is in FIFO order
Task wait queue is in task priority order
Message queue is in FIFO order
Message queue is in message priority order
When a task connected to the mail box queue is in the state of waiting with timeout enabled (waiting
in trcv_mbx), a string "[tmo]", which indicates the state of timeout enabled, is appended to a string
displayed in the Mailbox Queue (Wait) field.
When a task connected to the mail box queue is in the state of forced waiting (Double waiting), a
string "[s]", which indicates the state of double waiting, is appended to a string displayed in the
Mailbox Queue (Wait) field.
Normal Display
Display when in WAIT-SUSPEND
Display when in WAIT-SUSPEND with time out
•
26(_task26)
26(_task26)[s]
26(_task26)[tmo][s]
Up to 8 characters can be displayed in the task name in the Mailbox Queue (Wait) field. If a task
name exceeds 8 characters, the extra characters are omitted.
REJ10J2120-0100 Rev. 1.00
Dec. 01, 2010
Page 132 of 193
R32C/100 E30A Emulator Debugger
Chapter 7 Windows/Dialogs
7.10.8 Display the Data Queue Status
In the MR window, select Popup Menu - [Mode] -> [Data Queue].
7.10.8.1 Display the Data Queue Status(When the realtime OS is MRxx conformed to uITRON specifications V.4.0.)
All the data queues defined in the configuration are listed in the order of ID number. The function of each item is
listed below. (When the realtime OS is MRxx conformed to uITRON specifications V.4.0.)
Item
Contents
ID
Dtqatr
Dtcnt
Dtqsz
Data Queue (Wait)
ID No. of data queue
Attribute of each date queue
Number of messages in each data queue
Maximum number of messages that can be contained in each data queue
ID No. and task name of tasks waiting for message transmission waiting
or message reception waiting
The messages stored in the data queue
Data Queue (Data)
•
The display of the ID field varies depending on which one is specified, the standard data(32 bits) or
the extended data(16 bits).
MR100/4
- If the standard data(32 bits), the ID field displays a string "[32]" and data queue ID number.
- If the extended data(16 bits), the ID field displays a string "[16]" and data queue ID number.
•
The following are displayed in the Dtqatr area:
TA_TFIFO
TA_TPRI
REJ10J2120-0100 Rev. 1.00
Dec. 01, 2010
Task wait queue is in FIFO order
Task wait queue is in task priority order
Page 133 of 193
R32C/100 E30A Emulator Debugger
•
•
The Data Queue (Wait) field displays a string "Send" if a task waiting for a message sending, and
then displays the ID number and name of the task waiting for a message sending. Also, if a task
waiting for a message receiving, displays a string "Receive" and then displays the ID number and
name of the task waiting for a message receiving.
When a task connected to the date queue is in the state of waiting with timeout enabled , a string
"[tmo]", which indicates the state of timeout enabled, is appended to a string displayed in the Data
Queue (Wait) field.
When a task connected to the data queue is in the state of forced waiting (Double waiting), a string
"[s]", which indicates the state of double waiting, is appended to a string displayed in the Data
Queue (Wait) field.
Normal Display
Display when in WAIT-SUSPEND
Display when in WAIT-SUSPEND with time out
•
Chapter 7 Windows/Dialogs
26(_task26)
26(_task26)[s]
26(_task26)[tmo][s]
Up to 8 characters can be displayed in the task name in the Data Queue (Wait) field. If a task name
exceeds 8 characters, the extra characters are omitted.
REJ10J2120-0100 Rev. 1.00
Dec. 01, 2010
Page 134 of 193
R32C/100 E30A Emulator Debugger
Chapter 7 Windows/Dialogs
7.10.9 Display the Cycle Handler Status
In the MR window, select Popup Menu - [Mode] -> [Cyclic Handler].
7.10.9.1 Display the Cycle Handler Status(When the realtime OS is MRxx conformed to uITRON specifications
V.3.0.)
All the cycle handlers defined in the configuration are listed in the order of ID number. The function of each item is
listed below. (When the realtime OS is MRxx conformed to uITRON specifications V.3.0.)
Item
Contents
ID
StaAddr
(name)
interval
count
Status
ID No. of cycle handler
Starting address of cycle handler
Name of cycle handler
Interrupt interval
Interrupt count
Activity status of cycle start handler
•
The following are displayed in the Status area:
TCY_ON
TCY_OFF
REJ10J2120-0100 Rev. 1.00
Dec. 01, 2010
Cycle handler enabled
Cycle handler disabled
Page 135 of 193
R32C/100 E30A Emulator Debugger
Chapter 7 Windows/Dialogs
7.10.9.2 Display the Cycle Handler Status(When the realtime OS is MRxx conformed to uITRON specifications
V.4.0.)
All the cycle handlers defined in the configuration are listed in the order of ID number. The function of each item is
listed below. (When the realtime OS is MRxx conformed to uITRON specifications V.4.0.)
Item
Contents
ID
Name
Cycphs
Cyctim
Tmout
ID No. of cycle handler
Name of cycle handler
The activation phase (by the millisecond)
The activation cycle time (by the millisecond)
The amount of time by the millisecond remaining before the cyclic
handler's next activation time
Activity status of cycle start handler
Status
•
The following are displayed in the Status area:
TCYC_STA
TCYC_STP
REJ10J2120-0100 Rev. 1.00
Dec. 01, 2010
Cycle handler is in an operational state
Cycle handler is in a non-operational state
Page 136 of 193
R32C/100 E30A Emulator Debugger
Chapter 7 Windows/Dialogs
7.10.10 Display the Alarm Handler Status
In the MR window, select Popup Menu - [Mode] -> [Alarm Handler].
When the realtime OS is MRxx conformed to uITRON specifications V.3.0, the following data is displayed in the
status bar.
7.10.10.1 Display the Alarm Handler Status(When the realtime OS is MRxx conformed to uITRON specifications
V.3.0.)
Of all the cycle start handlers defined in the configuration, only those which are not started yet at present are
listed in the ascending order of start time. The function of each item is listed below. (When the realtime OS is
MRxx conformed to uITRON specifications V.3.0.)
Item
Contents
ID
StaAddr
(name)
AlarmTime
ID No. of alarm handler
Starting address of alarm handler
Name of alarm handler
Starting time of alarm handler
7.10.10.2 Display the Alarm Handler Status(When the realtime OS is MRxx conformed to uITRON specifications
V.4.0.)
Of all the cycle start handlers defined in the configuration, only those which are not started yet at present are
listed in the ascending order of start time. The function of each item is listed below. (When the realtime OS is
MRxx conformed to uITRON specifications V.4.0.)
Item
Contents
ID
Name
Almtim
ID No. of alarm handler
Name of alarm handler
The amount of time by the millisecond remaining before the alarm
handler's activation time
Activity status of alarm handler
Status
•
The following are displayed in the Status area:
TALM_STA
TALM_STP
REJ10J2120-0100 Rev. 1.00
Dec. 01, 2010
Alarm handler is in an operational state
Alarm handler is in a non-operational state
Page 137 of 193
R32C/100 E30A Emulator Debugger
Chapter 7 Windows/Dialogs
7.10.11 Display the Memory Pool Status
In the MR window, select Popup Menu - [Mode] -> [Memory Pool].
7.10.11.1 Display the Memory Pool Status(When the realtime OS is MRxx conformed to uITRON specifications
V.3.0.)
All the memory pools defined in the configuration are listed in the order of ID number. (The fixed length data
comes first, and the optional length data comes after the fixed length data.) The function of each item is listed
below. (When the realtime OS is MRxx conformed to uITRON specifications V.3.0.)
Item
Contents
ID
BaseAddr
Blk_Size
Total Blk_cnt
Free Blk_cnt(map)
ID No. of memory pool
Base address of memory pool
Block size of memory pool
Tot a l block count of memory pool
Number of unused blocks and information on unused memory blocks
(bit information)
•
The display of the ID field varies depending on which one is specified, fixed length or optional length.
- If the data is of fixed length, the ID field displays a string "[F]" and memory pool ID number.
- For an arbitrary length, the contents displayed on the first line are the character string "[V]," a memory pool
ID number, and a block ID number. Displayed on the second to fourth lines are the memory pool ID and
block ID numbers. The block ID numbers are enclosed in parentheses.
When specifying the optional length memory pool, "--" is displayed in the Total Mlk_cut field.
•
No bit information is displayed in the Free Blk_cnt (map) field.
•
When specifying the fixed-length memory pool, the display format of each bit in the memory block
information in Free Blk_cnt (map) is as shown below:
item
Contents
'0'
'1'
'-'
Memory block in use (busy)
Memory block not in use (ready)
No memory block
REJ10J2120-0100 Rev. 1.00
Dec. 01, 2010
Page 138 of 193
R32C/100 E30A Emulator Debugger
Chapter 7 Windows/Dialogs
7.10.11.2 Display the Memory Pool Status(When the realtime OS is MRxx conformed to uITRON specifications
V.4.0.)
All the memory pools are listed in the order of ID number. The function of each item is listed below. (When the
realtime OS is MRxx conformed to uITRON specifications V.4.0.)
Item
Contents
ID
Mplatr
Mpladr
Mplsz
Blkcnt
Fblkcnt
Memory Pool Queue
ID No. of memory pool
Attribute of each memory pool
Base address of memory pool
Size of memory pool
Total block count of fixed length memory pool
Number of unused blocks and information on unused memory blocks
Displays the ID number and name of tasks waiting in the memory
pool.
•
The following are displayed in the Mplatr area:
TA_TFIFO
TA_TPRI
Task wait queue is in FIFO order
Task wait queue is in task priority order
•
The display of the ID field varies depending on which one is specified, fixed length or optional length.
- If the data is of fixed length, the ID field displays a string "[F]" and memory pool ID number.
- For an arbitrary length, the contents displayed on the first line are the character string "[V]," a memory pool
ID number, and a block ID number. Displayed on the second to fourth lines are the memory pool ID and
block ID numbers. The block ID numbers are enclosed in parentheses.
REJ10J2120-0100 Rev. 1.00
Dec. 01, 2010
Page 139 of 193
R32C/100 E30A Emulator Debugger
Chapter 7 Windows/Dialogs
7.10.12 Display the Task Context
7.10.12.1 Display the Task Context
In the MR window, select Popup Menu - [Context...].
The Context dialog box is opened. The Context dialog box is used to reference/specify the context information of the
specified task.
You can also open the Context dialog box by double-clicking the data display area in the task state display mode .
Enter the task ID number in the Task ID field and click the View button (or press the Enter key).
The context of the specified task appears in the Context field.
•
If the task entered in the Task ID field is "RUN" or "DMT" when clicking the View button, the
context is not displayed. (In the Context field, only the task ID and task state are displayed.)
If a task ID number which does not exist is entered in the Task ID field when clicking the View
•
button, an error occurs.
REJ10J2120-0100 Rev. 1.00
Dec. 01, 2010
Page 140 of 193
R32C/100 E30A Emulator Debugger
Chapter 7 Windows/Dialogs
7.10.12.2 Change the task context
Enter the task ID number in the Task ID field in the Context dialog and click the Set button. The Set Context
dialog is opened.
The Set Context dialog is used to set the specified context register value of the specified task.
Specify the register to be changed in the Register field list box and enter the value to be set in the "Value:" field.
If an expression description set in the "Value:" field is wrong, or if the specified value is outside the allowable range
set for the specified register, an error occurs.
REJ10J2120-0100 Rev. 1.00
Dec. 01, 2010
Page 141 of 193
R32C/100 E30A Emulator Debugger
Chapter 7 Windows/Dialogs
7.11 MR Trace Window
The MR Trace window measures the task execution history of a program using the real time OS and displays the
result graphically.
In addition to the task execution history, a history of various other operations each are traced and displayed,
including interrupt processing, task state transition, and system call issuance.
This window is available only when a target program which uses our real time OS (MRxx) is downloaded.
For MR100/4
•
For MR100/4, this function is available for V.1.01 or later version. If a target program created on MR100/4
V.1.00 is downloaded, this function does not work and nothing is displayed in the MR Trace window.
Use the timer A or timer B as the system clock. If you use another timer as the system clock or do not use the
•
system clock, histories cannot be measured and displayed correctly.
A history of high-speed interrupts cannot be measured and displayed.
•
A history of interrupts using the fixed vector table cannot be measured and displayed.
•
A history of non-kernel interrupts cannot be measured and displayed. However, it can be measured and
•
displayed by invoking macros for measurement from non-kernel interrupt handlers. For details, refer to the
MR100/4 User’s Manual.
The content of each item is as follows.
Items
Contents
VEC*1
table
ID
(name)
Indicates a software interrupt number.
Indicates the interrupt vector table number.
Indicates a task ID number.
Indicates an interrupt routine name, task name, idle processing
(display "Idle"), and unknown name(displayed "Unknown").
REJ10J2120-0100 Rev. 1.00
Dec. 01, 2010
Page 142 of 193
R32C/100 E30A Emulator Debugger
Chapter 7 Windows/Dialogs
When moving the mouse to the information displayed in the window, the pop up window as below is opened,
showing the detailed information.
Interrupt handling or task execution history
System call issue history
Task state transition history
Following information is displayed in the status bar.
•
Time value at which start marker is positioned
•
Time value at which end marker is positioned
•
Time width of a range indicated by start and end markers
•
Time value at which indicator is positioned
•
Scale factor of display
•
Time width of grid line interval
•
Range of measurement (trace) result
The grid lines are displayed using the start marker as the radix point.
The grid lines are displayed using the start marker as the radix point. The scale is displayed, using the time at
which the start marker is positioned as 0, with the left (forward in time) set to "minus" and the right (backward in
time) set to "plus".
The grid lines allow you to roughly understand the interrupt occurrence cycle and process time.
The interval time width of the displayed grid lines appears in the "Grid" area of the status bar.
The time value in the MR Trace window indicates an elapsed execution time from where the beginning data of the
measurement results recorded in the trace memory is counted as 0. On the contrary, the numeric value above the
grid lines (scale) in the MR Trace window is a relative value using the start marker as 0 (the grid interval is
specified in the Value dialog).
It has nothing to do with the time value. (This is provided so that you can see the window easily.)
Note
The software interrupt number*1 is different according to product. For details about which interrupt number is
assigned to which system call, refer to the MRxx Reference Manual, "Assemble Language Interface."
ATTENTION
•
•
Only when Trace mode is selected in the Debugging Mode tab of the Init dialog, MR Trace window can be used.
In the MR Trace window, the trace mode is set to Trace priority mode. Therefore, the MCU execution may be
delayed.
REJ10J2120-0100 Rev. 1.00
Dec. 01, 2010
Page 143 of 193
R32C/100 E30A Emulator Debugger
Chapter 7 Windows/Dialogs
7.11.1 Extended Menus
This window has the following popup menus that can be brought up by right-clicking in the window.
Menu
Start Marker
End Marker
Indicator
Adjust
Expand
Reduce
Trace Stop *2
Trace Restart *2
Search...
Trace Range
Value...
Color...
Init Order...
Toolbar display
Customize toolbar...
Allow Docking
Hide
*2: Not supported.
REJ10J2120-0100 Rev. 1.00
Dec. 01, 2010
After
Break
Function
Move the start marker in the display area.
Move the end marker in the display area.
Move the indicator in the display area.
Adjust range of start and end marker to full width of display
area Adjust.
Expand scale factor of display.
Reduce scale factor of display.
Stop measuring.
Restarts measuring.
Search for history of system calls.
Set measurement range condition to After.
Set measurement range condition to Break.
Set value.
Change display color.
Reset the task order on the display.
Display toolbar.
Open toolbar customize dialog box.
Allow window docking.
Hide window.
Page 144 of 193
R32C/100 E30A Emulator Debugger
Chapter 7 Windows/Dialogs
7.11.2 Refer the Execution History of Task(MRxx Window)
You can reference the task execution history in the MR Trace window. You can reference the execution history
statistical processing result in the MR Analyze window. These windows are available for a target program using
our real time OS (MRxx).
7.11.2.1 Select the Trace Range
To measure the task execution history, the real time trace function is used. Click the "After" button (or, select
Menu - [Trace Range] ->[After]) or "Break" button (or, select Menu - [Trace Range] -> [Break]) in the MR Trace
window.
After
Break
Record the task execution history until the trace memory is filled.
Record the task execution history until the target program stops (up to the maximum size
of the trace memory)
Execute the target program. Record the information required to know the task execution history in the trace
memory.
ATTENTION
The event set in the Event Setting Window is disabled.
7.11.2.2 Stop the Task Execution History Measurement
Click the "Stop" button in the MR Trace window. (Or, select Menu - [Trace Stop].) The measurement results so far
are displayed in the MR Trace window.
(Not supported.)
7.11.2.3 Restart the Task Execution History Measurement
Click the "Restart" button in the MR Trace window. (Or, select Menu - [Trace Restart].) When restarting the trace
measurement, all the measurement results so far are deleted.
(Not supported.)
REJ10J2120-0100 Rev. 1.00
Dec. 01, 2010
Page 145 of 193
R32C/100 E30A Emulator Debugger
Chapter 7 Windows/Dialogs
7.11.2.4 Refer the Execution History of Task
You can reference the task execution transition in the MR Trace window.
By moving the mouse to any information displayed in the window, the following window is opened, showing the
detailed information.
Interrupt handling or task execution history
System call issue history
Task state transition history
REJ10J2120-0100 Rev. 1.00
Dec. 01, 2010
Page 146 of 193
R32C/100 E30A Emulator Debugger
7.11.2.4.1.
Chapter 7 Windows/Dialogs
Search the History of System Call Issue
Click the "Search" button in the tool bar. The Search dialog is opened. (Or, select Menu - [Search ...].)
Specify the search condition.
With the function code (R0: Function Code) and error code (R0: Error Code), you can specify multiple values (OR
condition). Other items are searched based on the AND condition.
Then, specify the search direction. The debugger searches the items in the direction specified in the dialog, using
the position pointed by the indicator as the radix point.
When the debugger does not check all the search items, the subsequent system call issuance history in the search
direction will be a search result. Click the Find Next button. The debugger searches the system call issuance
history corresponding to the specified condition. The specified items are searched using the AND condition.
If the search condition is met, the indicator is moved to that point.
REJ10J2120-0100 Rev. 1.00
Dec. 01, 2010
Page 147 of 193
R32C/100 E30A Emulator Debugger
7.11.2.4.2.
Chapter 7 Windows/Dialogs
Change the display magnification
Click the "Expand" button or "Reduce" button in the tool bar. (Or, select Menu - [Expand] or [Reduce].)
The display is expanded or reduced using the left corner of the graph area as the radix point. By default, the
display is expanded or reduced with display scale of 1.5.
The display scale appears in the "Scale:*" field in the status bar.
The default expansion/reduction scale is 1.5. To change the scale, select Menu - [Value ...].
The Value dialog is opened. Specify the display expansion/reduction scale.
7.11.2.4.3.
Change the grid line display interval
Select Menu - [Value ...]. The Value dialog is opened. Specify the display time interval.
REJ10J2120-0100 Rev. 1.00
Dec. 01, 2010
Page 148 of 193
R32C/100 E30A Emulator Debugger
7.11.2.4.4.
Chapter 7 Windows/Dialogs
Change the task display order
Drag the task/interrupt routine to be moved (the left portion of the graph) to the destination.
To initialize the display order, select Menu - [Init Order].
7.11.2.4.5.
Display the specific task only
Click the task/interrupt routine to be hidden (the left portion of the graph). Every time you click, the setting is
switched between "Display" and "Hide".
7.11.2.4.6.
Change the display color
Select Menu - [Color...]. The Color dialog is opened.
Click the button corresponding to the desired item. The Color Setting dialog is opened. Change the display color in
the dialog.
REJ10J2120-0100 Rev. 1.00
Dec. 01, 2010
Page 149 of 193
R32C/100 E30A Emulator Debugger
Chapter 7 Windows/Dialogs
7.11.2.5 Measure the Execution Time of Task
You can measure the execution time between the markers by changing the positions of start marker and end
marker in the MR Trace window.
Drag the start marker position and end marker position.
The time interval between the markers is displayed in the status bar.
Note
[Definition of time value in the MR Trace window]
The time value in the MR Trace window indicates an elapsed execution time from where the beginning data of the
measurement results recorded in the trace memory is counted as 0. On the contrary, a numeric value above the
grid line (scale) in the MR Trace window is a relative value which sets the start marker to 0 (the grid interval is
specified in the Value dialog), which has nothing to do with the time value. (It is provided so that you can see the
window easily.)
7.11.2.5.1.
Move the Marker
Each marker can be moved by dragging. When moving the mouse on the marker, the cursor shape changes. Then,
start dragging.
The start marker moves into the window (left portion) by clicking the "Start Marker" button in the tool bar. (Or,
select Menu - [Start Marker].)
The end marker moves into the window (right portion) by clicking the "End Marker" button. (Or, select Menu [End Marker].)
The indicator moves into the window (center) by clicking the "Indicator" button. (Or, select Menu - [Indicator].)
The other markers can move only to the specified positions listed below.
•
•
•
Position to which the interrupt processing or task execution transits
Position to which the task state transits
Position where the system call issuance history is displayed
REJ10J2120-0100 Rev. 1.00
Dec. 01, 2010
Page 150 of 193
R32C/100 E30A Emulator Debugger
Chapter 7 Windows/Dialogs
7.12 MR Analyze Window
The MR Analyze window displays the result of the measurement data statistically analyzed within the range
specified by the start marker and the end marker in the MR Trace window.
The MR Analyze window supports three display mode as below:
•
CPU occupation state by interrupt/task
•
Ready time by task
•
List of system call issuance histories (You can extract and display the history based on the specific condition.)
The MR Analyze window functions together with the MR Trace window.
This window is available only when a target program using our real time OS (MRxx) is downloaded.
7.12.1 Configuration of CPU Occupancy Status Display Mode
The CPU occupation state display mode is used to display the CPU occupation time and ratio by interrupt/task.
The MR Trace window shows the statistical results within the range specified by the start marker and end marker.
By clicking the maximum execution time/minimum execution time display area of each line, you can search
interrupt to the clicked line or process history at the maximum/minimum execution time of the task.
The search result is pointed by the indicator which moves to the target position in the MR Trace window.
REJ10J2120-0100 Rev. 1.00
Dec. 01, 2010
Page 151 of 193
R32C/100 E30A Emulator Debugger
Chapter 7 Windows/Dialogs
7.12.2 Configuration of Ready State Duration Display Mode
The ready state time display mode by task is used to display the results generated from statistical process of the
time required from execution ready to transition to execution by task.
The statistical result is displayed within the range specified by the start marker and end marker in the MR Trace
window.
By clicking the maximum ready time/minimum ready time display area of the desired line, you can search the
process history of the maximum ready time/minimum ready time of the task corresponding to the clicked line.
The search result is pointed by the indicator which moves to the target position in the MR Trace window.
7.12.3 Configuration of System Call History Display Mode
The system call issuance history list mode is used to list the system calls issued.
The system call issuance history is listed within the range specified by the start marker and end marker in the MR
Trace window.
The number indicates a numeric value counted from the top system call within the measurable range.
By clicking the desired line, you can search the system call issuance history to the clicked line.
The search result is pointed by the indicator which moves to the target position in the MR Trace window.
REJ10J2120-0100 Rev. 1.00
Dec. 01, 2010
Page 152 of 193
R32C/100 E30A Emulator Debugger
Chapter 7 Windows/Dialogs
7.12.4 Extended Menus
This window has the following popup menus that can be brought up by right-clicking in the window.
Menu
Run Time
Rdy->Run
System Call
Pick Up System Call...
Save...
Toolbar display
Customize toolbar...
Allow Docking
Hide
Function
CPU occupancy status display mode.
Ready state duration display mode.
System call history display mode.
Extract specified system calls display mode.
Save analysis data to file.
Display toolbar.
Open toolbar customize dialog box.
Allow window docking.
Hide window.
7.12.5 Analyze the Execution History of Task
You can reference the execution history statistical processing in the MR Analyze window. The MR Analyze window
functions together with the MR Trace window. If the MR Trace window is not open, or the MR Trace window does
not show any data, the MR Analyze window will not function.
The execution history statistical processing function allows you to reference the following topics.
7.12.5.1 Refer the CPU Occupation State
Click the Run Time button in the tool bar. (Or, select Menu - [Run Time].) The MR Analyze window changes to the
CPU occupation state display mode.
The window shows the CPU occupation time and ratio by interrupt processing and by task.
The data displayed is the statistical results for the range specified with the start marker and end marker in the MR
Trace window.
By clicking the maximum execution time/minimum execution time display field of each line, you can search the
processing history at the maximum execution time/minimum execution time of the task corresponding to the
clicked line.
The search result is pointed by the indicator in the MR Trace window after the indicator moves to the destination
position.
REJ10J2120-0100 Rev. 1.00
Dec. 01, 2010
Page 153 of 193
R32C/100 E30A Emulator Debugger
Chapter 7 Windows/Dialogs
7.12.5.2 Refer the Ready Queue Time
Click the Ready->Run button in the tool bar. (Or, select Menu - [Rdy -> Run].)
The time required from execution ready state to transition to execution state by task is processed statistically and
displayed.
The data displayed is the statistical results of the range specified with the start marker and end marker in the MR
Trace window.
By clicking the maximum ready time/minimum ready time display field of each line, you can search the processing
history at the maximum ready time/minimum ready time of the task corresponding to the clicked line.
The search result is pointed by the indicator in the MR Trace window after the indicator moves to the destination
position.
7.12.5.3 Refer the System Call Issuance History
Click the "System Call" button in the tool bar. (Or, select Menu - [System Call].)
The issued system calls are listed in chronological order of system call.
The data displayed is the statistical results for the range specified with the start marker and end marker in the MR
Trace window.
By clicking each line, you can search the system call issuance history corresponding to the clicked line. The search
result is pointed by the indicator in the MR Trace window after the indicator moves to the destination position.
REJ10J2120-0100 Rev. 1.00
Dec. 01, 2010
Page 154 of 193
R32C/100 E30A Emulator Debugger
7.12.5.3.1.
Chapter 7 Windows/Dialogs
Extract the Issuance History
Click the "Pick Up" button in the tool bar. (Or, select Menu - [Pick Up System Call...].)
The dialog shown below is opened. Specify the search condition of the system call to be extracted and displayed.
Extract the issuance history of the system call which meets the specified condition and display it.
REJ10J2120-0100 Rev. 1.00
Dec. 01, 2010
Page 155 of 193
R32C/100 E30A Emulator Debugger
8.
Chapter 8 Table of Script Commands
Table of Script Commands
The following script commands are prepared.
The commands with yellow color displaying can be executed at run time.
The command to which "*" adheres behind is not supported according to the product.
8.1 Table of Script Commands (classified by function)
8.1.1 Execution Commands
Command Name
Go
GoFree
GoProgramBreak*
GoBreakAt*
Stop
Status
Step
StepInstruction
OverStep
OverStepInstruaction
Return
ReturnInstruction
Reset
Time
Short Name
G
GF
GPB
GBA
S
SI
O
OI
RET
RETI
-
Contents
Program execution with breakpoints
Free run program execution
Run target program with software break point
Run target program with software break point
Stops program execution
Checks the operating status of the MCU
Step execution of source line
Step execution of instructions
Overstep execution of source lines
Overstep execution of instructions
Executes a source line return
Executes an instruction return
Resets the target MCU
Sets the run time display and checks the current setting
8.1.2 File Operation Commands
Command Name
Load
LoadHex
LoadMot*
LoadSymbol
Reload
UploadHex
UploadMot*
REJ10J2120-0100 Rev. 1.00
Dec. 01, 2010
Short Name
L
LH
LM
LS
UH
UM
Contents
Downloads the target program
Downloads an Intel HEX-format file
Downloads a Motorola S-format file
Loads source line/ASM symbol information
Re-downloads the target program
Outputs data to an Intel HEX-format file
Outputs data to a Motorola S-format file
Page 156 of 193
R32C/100 E30A Emulator Debugger
Chapter 8 Table of Script Commands
8.1.3 Register Operation Commands
Command Name
Register
Short Name
R
Contents
Checks and sets a register value
8.1.4 Memory Operation Commands
Command Name
DumpByte
DumpWord*
DumpLword*
SetMemoryByte
SetMemoryWord*
SetMemoryLword*
FillByte
FillWord*
FillLword*
Move
MoveLord*
MoveWord*
Short Name
DB
DW
DL
MB
MW
ML
FB
FW
FL
MOVEL
MOVEW
Contents
Displays the contents of memory (in 1-byte units)
Displays the contents of memory (in 2-byte units)
Displays the contents of memory (in 4-byte units)
Checks and changes memory contents (in 1-byte units)
Checks and changes memory contents (in 2-byte units)
Checks and changes memory contents (in 4-byte units)
Fills a memory block with the specified data (in 1-byte units)
Fills a memory block with the specified data (in 2-byte units)
Fills a memory block with the specified data (in 4-byte units)
Moves memory blocks
Moves memory blocks(in 4-byte units)
Moves memory blocks(in 2-byte units)
8.1.5 Assemble/Disassemble Commands
Command Name
Assemble
DisAssemble
Module
Scope
Section
Bit*
Symbol
Label
Express
Short Name
A
DA
MOD
SEC
SYM
EXP
Contents
Line-by-line assembly
Disassembles memory contents line by line
Displays modules names
Sets and checks the effective local symbol scope
Checks section information
Checks and sets bit symbols
Checks assembler symbols
Checks assembler labels
Displays an assembler expression
8.1.6 Software Break Setting Commands
Command Name
Short Name
Contents
SoftwareBreak
SoftwareBreakClear
SoftwareBreakClearAll
SoftwareBreakDisable
SoftwareBreakDisableAll
SoftwareBreakEnable
SoftwareBreakEnableAll
BreakAt
BreakIn
SB
SBC
SBCA
SBD
SBDA
SBE
SBEA
-
Sets and checks software breaks
Clears software breaks
Clears all software breaks
Disables software breakpoints
Disables all software breaks
Enables software breakpoints
Enables all software breaks
Sets a software breakpoint by specifying a line No.
Sets a software breakpoint by specifying a function
REJ10J2120-0100 Rev. 1.00
Dec. 01, 2010
Page 157 of 193
R32C/100 E30A Emulator Debugger
Chapter 8 Table of Script Commands
8.1.7 Real-time Trace Commands
Short Name
TD
TL
Command Name
TraceData*
TraceList*
Contents
Realtime trace data display
Displays disassembled realtime trace data
8.1.8 Event Setting Commands
Command Name
Short Name
Contents
EVent
EV
Sets and checks events
8.1.9 Script/Log File Commands
Command Name
Short Name
Contents
Script
Exit
Wait
Pause
Sleep
Logon
Logoff
Exec
-
Opens and executes a script file
Exits the script file
Waits for an event to occur before command input
Waits for user input
Halts for user input until the specified time has elapsed
Outputs the screen display to a log file
Stops the output of the screen display to a log file
Executes external application
8.1.10 Program Display Commands
Command Name
Func
Up*
Down*
Where*
Path
AddPath
File
Short Name
-
Contents
Checks function names and displays the contents of functions
Displays the calling function
Displays a called function
Displays a function call status
Sets and checks the search path
Adds the search path
Checks a filename and displays the contents of that file
8.1.11 Clock Command
Command Name
Clock
Short Name
CLK
REJ10J2120-0100 Rev. 1.00
Dec. 01, 2010
Contents
Checks the clock
Page 158 of 193
R32C/100 E30A Emulator Debugger
Chapter 8 Table of Script Commands
8.1.12 C Language Debugging Commands
Command Name
Print
Set
Short Name
-
Contents
Check value of specified C variable expression
Set specified data in specified C variable expression
8.1.13 Real-time OS Command
Command Name
Short Name
Contents
MR*
-
Displays status of realtime OS (MRxx)
8.1.14 Utility Commands
Command Name
Short Name
Contents
Radix
Alias
UnAlias
UnAliasAll
Version
Date
Echo
CD
VER
-
Sets and checks the radix for numerical input
Specifies and checks command alias definitions
Cancels the alias defined for a command
Cancels all aliases defined for commands
Displays the version No.
Displays the date
Displays messages
Window open
REJ10J2120-0100 Rev. 1.00
Dec. 01, 2010
Page 159 of 193
R32C/100 E30A Emulator Debugger
Chapter 8 Table of Script Commands
8.2 Table of Script Commands (alphabetical order)
Command Name
AddPath
Alias
Assemble
Bit*
BreakAt
BreakIn
CD
Clock
Date
DisAssemble
Down*
DumpByte
DumpLword*
DumpWord*
Echo
EVent
Exec
Exit
Express
File
FillByte
Short Name
A
CLK
DA
DB
DL
DW
EV
EXP
FB
FillLword*
FL
FillWord*
FW
Func
-
Go
GoBreakAt*
GoFree
GoProgramBreak*
Label
Load
LoadHex
LoadMot*
LoadSymbol
Logoff
Logon
Module
Move
MoveLord*
MoveWord*
MR*
OverStep
OverStepInstruaction
Path
Pause
G
GBA
GF
GPB
L
LH
LM
LS
MOD
MOVEL
MOVEW
O
OI
-
REJ10J2120-0100 Rev. 1.00
Dec. 01, 2010
Contents
Adds the search path
Specifies and checks command alias definitions
Line-by-line assembly
Checks and sets bit symbols
Sets a software breakpoint by specifying a line No.
Sets a software breakpoint by specifying a function
Specifies and checks the current directory
Checks the clock
Displays the date
Disassembles memory contents line by line
Displays a called function
Displays the contents of memory (in 1-byte units)
Displays the contents of memory (in 4-byte units)
Displays the contents of memory (in 2-byte units)
Displays messages
Sets and checks events
Executes external application
Exits the script file
Displays an assembler expression
Checks a filename and displays the contents of that file
Fills a memory block with the specified data (in 1-byte
units)
Fills a memory block with the specified data (in 4-byte
units)
Fills a memory block with the specified data (in 2-byte
units)
Checks function names and displays the contents of
functions
Program execution with breakpoints
Run target program with software break point
Free run program execution
Run target program with software break point
Checks assembler labels
Downloads the target program
Downloads an Intel HEX-format file
Downloads a Motorola S-format file
Loads source line/ASM symbol information
Stops the output of the screen display to a log file
Outputs the screen display to a log file
Displays modules names
Moves memory blocks
Moves memory blocks(in 4-byte units)
Moves memory blocks(in 2-byte units)
Displays status of realtime OS (MRxx)
Overstep execution of source lines
Overstep execution of instructions
Sets and checks the search path
Waits for user input
Page 160 of 193
R32C/100 E30A Emulator Debugger
Print
Radix
Register
Reload
Reset
Return
ReturnInstruction
Scope
Script
Section
Set
SetMemoryByte
SetMemoryLword*
SetMemoryWord*
Sleep
SoftwareBreak
SoftwareBreakClear
SoftwareBreakClearAll
SoftwareBreakDisable
SoftwareBreakDisableAll
SoftwareBreakEnable
SoftwareBreakEnableAll
Status
Step
StepInstruction
Stop
Symbol
Time
TraceData*
TraceList*
UnAlias
UnAliasAll
Up*
UploadHex
UploadMot*
Version
Wait
Where*
REJ10J2120-0100 Rev. 1.00
Dec. 01, 2010
Chapter 8 Table of Script Commands
R
RET
RETI
SEC
MB
ML
MW
SB
SBC
SBCA
SBD
SBDA
SBE
SBEA
S
SI
SYM
TD
TL
UH
UM
VER
-
Check value of specified C variable expression.
Sets and checks the radix for numerical input
Checks and sets a register value
Re-downloads the target program
Resets the target MCU
Executes a source line return
Executes an instruction return
Sets and checks the effective local symbol scope
Opens and executes a script file
Checks section information
Set specified data in specified C variable expression
Checks and changes memory contents (in 1-byte units)
Checks and changes memory contents (in 4-byte units)
Checks and changes memory contents (in 2-byte units)
Halts for user input until the specified time has elapsed
Sets and checks software breaks
Clears software breaks
Clears software breaks
Disables software breakpoints
Disables all software breaks
Enables software breakpoints
Enables all software breaks
Checks the operating status of the MCU
Step execution of source line
Step execution of instructions
Stops program execution
Checks assembler symbols
Sets the run time display and checks the current setting
Realtime trace data display
Displays disassembled realtime trace data
Cancels the alias defined for a command
Cancels all aliases defined for commands
Displays the calling function
Outputs data to an Intel HEX-format file
Outputs data to a Motorola S-format file
Displays the version No.
Waits for an event to occur before command input
Displays a function call status
Page 161 of 193
R32C/100 E30A Emulator Debugger
Chapter 9 Writing Script Files
9.
Writing Script Files
This debugger allows you to run script files in a Script Window. The script file contains the controls necessary for
automatically executing the script commands.
9.1 Structural Elements of a Script File
You can include the following in script files:
•
Script commands
•
Assign statements
•
Conditional statements (if, else, endi)
Program execution branches to the statement(s) to be executed according to the result of the
conditional expression.
•
Loop statements (while, endw)
A block of one or more statements is repeatedly executed according to the expression.
•
break statement
Exits from the innermost loop.
Comment statements
•
You can include comments in a script file. The comment statements are ignored when the script
commands are executed.
Specify only one statement on each line of the script file. You cannot specify more than one statement on a line, or
write statements that span two or more lines.
Notes
•
•
•
•
•
•
•
You cannot include comments on the same lines as script commands.
You can nest script files up to ten levels.
You can nest if statements and while statements up to 32 levels.
If statements must be paired with endi statements, and while statements with endw statements in
each script file.
Expressions included in script files are evaluated as unsigned types. Therefore, operation cannot be
guaranteed if you use negative values for comparison in if or while statements.
You can specify up to 4096 characters per line. An error occurs if a line exceeds this number of
characters.
When a script file containing illegal commands is automatically executed (when you select [ Option ]
-> [Script]-> [ Run ] from the Script Window menu after opening a script file, or click the button in
the Script Window), execution of the script file continues even after the error is detected, except
when the script line itself cannot be read. If an error is detected and the script file continues to be
executed, operation after detection of the error cannot be guaranteed. Reliability cannot therefore be
placed on the results of execution after an error has been detected.
REJ10J2120-0100 Rev. 1.00
Dec. 01, 2010
Page 162 of 193
R32C/100 E30A Emulator Debugger
Chapter 9 Writing Script Files
9.1.1 Script Command
You can use the same script commands that you enter in the Script Window. You can also call script files from
within other script files (nesting up to 10 levels).
9.1.2 Assign Statement
Assign statement s define and initialize macro variables and assign values. The following shows the format to be
used.
%macro-variable = expression
•
•
•
•
You can use alphanumerics and the underscore (_) in macro variable names. However , you cannot
use a numeric to start a macro variable name.
You can specify any expression of which the value is an integer between 0h and FFFFFFFFh to be
assigned in a macro variable. If you specify a negative number, it is processed as twos complement.
You can use macro variables within the expression.
Always precede macro variables with the "%" sign.
9.1.3 Conditional Statement
In a conditional statement, different statements are executed according to whether the condition is true or false.
The following shows the format to be used.
if ( expression )
statement 1
else
statement 2
endi
•
•
•
If the expression is t rue (other than 0), statement 1 is executed. If false, (0), statement 2 is executed.
You can omit the else statement. If omitted and the expression is false, execution jumps to the line
after the endi statement.
if statements can be nested (up to 32 levels).
REJ10J2120-0100 Rev. 1.00
Dec. 01, 2010
Page 163 of 193
R32C/100 E30A Emulator Debugger
Chapter 9 Writing Script Files
9.1.4 Loop Statement(while,endw) and Break Statement
In loop statements, execution of a group of statements is repeated while the expression is true. The following shows
the format to be used.
while ( expression )
statement
endw
•
•
•
If the expression is t rue, the group of statements is repeated. If false, the loop is exited (and the
statement following the endw statement is executed).
You can nest while statements up to 32 levels.
Use the break statement to forcibly exit a while loop. If while statements are nested, break exits
from the inner most loop.
9.1.5 Comment statements
You can include comments in a script file. Use the following format.
;character string
•
•
Write the statement after a semicolon (;). You can include only spaces and tabs in front of the
semicolon
Lines with comment statements are ignored when the script file is executed.
REJ10J2120-0100 Rev. 1.00
Dec. 01, 2010
Page 164 of 193
R32C/100 E30A Emulator Debugger
Chapter 9 Writing Script Files
9.2 Writing Expressions
This debugger allows you to use expressions for specifying addresses, data, and number of passes, etc. The
following shows example commands using expressions.
>DumpByte TABLE1
>DumpByte TABLE1+20
You can use the following elements in expressions:
•
Constants
•
Symbols and labels
•
Macro variables
•
Register variables
•
Memory variables
•
Line Nos.
•
Character constants
•
Operators
9.2.1 Constants
You can use binary, octal, decimal, or hexadecimals. The prefix or suffix symbol attached to the numerical value
indicates which radix is used.
The debugger for M32C and M16C/R8C and 740
Prefix
Suffix
Examples
Hexadecimal
Decimal
Octal
Binary *
0x,0X
h,H
0xAB24
AB24h
@
None
@1234
None
o,O
1234o
%
b,B
%10010
10010b
*You can only specify % when the predetermined radix is hexadecimal.
If you are inputting a radix that matches the predetermined radix, you can omit the symbol that indicates the radix
(excluding binary).
•
Use the RADIX command to set the predetermined value of a radix. However, in the cases shown
below, the radix is fixed regardless of what you specify in a RADIX command.
Type
Address
Line No.
No. of executions
No. of passes
REJ10J2120-0100 Rev. 1.00
Dec. 01, 2010
Radix
Hex
Dec
Page 165 of 193
R32C/100 E30A Emulator Debugger
Chapter 9 Writing Script Files
9.2.2 Symbols and labels
You can include symbols and labels defined in your target program, or symbols and labels defined using the
Assemble command.
•
You can include alphanumerics, the underscore (_), period (.), and question mark (?) in symbols and
labels. However, do not start with a numeric.
Symbols and labels can consist of up to 255 characters.
•
Uppercase and lowercase letters are unique.
•
Product Name
Notes
The debugger for M32R,
The debugger for R32C,
The debugger for M32C,
The debugger for M16C/R8C,
•
•
You cannot include the assembler structured
instructions, pseudo instructions, macro instructions,
operation code, or reserved words (.SECTION, .BYTE,
switch, if, etc.).
You cannot use strings that start with two periods (..)
for symbols or labels.
9.2.2.1 Local label symbol and scope
This debugger supports both global label symbols, which can be referenced from the whole program area, and local
label symbols, which can only be referenced within the file in which they are declared. The effective range of local
label symbols is known as the scope, which is measured in units of object files. The scope is switched in this
debugger in the following circumstances:
•
When a command is entered
The object file that includes the address indicated by the program counter becomes the current scope.
When the SCOPE command is used to set the scope, the specified scope is the active scope.
During command execution
•
The current scope automatically switches depending on the program address being handled by the
command.
9.2.2.2 Priority levels of labels and symbols
The conversion of values to labels or symbols, and vice versa, is subject to the following levels of priority:
•
Conversion of address values
1.
Local labels
2.
Global labels
3.
Local symbols
4.
Global symbols
5.
Local labels outside scope
6.
Local symbols outside scope
1.
2.
3.
4.
5.
6.
•
Conversion of data values
Local symbols
Global symbols
Local labels
Global labels
Local symbols outside scope
Local labels outside scope
1.
2.
3.
•
Conversion of bit values
Local bit symbols
Global bit symbols
Local bit symbols outside scope
REJ10J2120-0100 Rev. 1.00
Dec. 01, 2010
Page 166 of 193
R32C/100 E30A Emulator Debugger
Chapter 9 Writing Script Files
9.2.3 Macro Variables
Macro variables are defined by assign statements in the script file. See Section "9.1.2 Assign Statement " in the
Reference part for details. Precede variables with '%' for use as macro variables.
•
You can specify alphanumerics and/or the underbar (_) in the variable name following the percent
sign (%). However , do not star t the names with a numeric.
You cannot use the names of registers as variable names.
•
Uppercase and lowercase letters are differentiated in variable names.
•
•
You can define a maximum of 255 macro variables. Once defined, a macro variable remains valid
until you quit the debugger.
Macro variables are useful for specifying the number of iterations of the while statement.
9.2.4 Register variables
Register variables are used for using the values of registers in an expression. Precede the name of the register with
'%' to use it as a register variable. Use the following format.
Product Name
The debugger for R32C
Register name
PC, USP, ISP, INTB, FLB, SVF, SVP, VCT,
DMD0, DMD1, DMD2, DMD3, DCT0, DCT1, DCT2, DCT3,
DCR0, DCR1, DCR2, DCR3, DSA0, DSA1, DSA2, DSA3,
DSR0, DSR1, DSR2, DSR3, DDA0, DDA1, DDA2, DDA3,
DDR0, DDR1, DDR2, DDR3,
0R0, 0R1, 0R2, 0R3, 0R4, 0R5, 0R6, 0R7, <- Bank 0 Register
0A0, 0A1, 0A2, 0A3, 0FB, 0SB <- Bank 0 Register
1R0, 1R1, 1R2, 1R3, 1R4, 1R5, 1R6, 1R7, <- Bank 1 Register
1A0, 1A1, 1A2, 1A3, 1FB, 1SB <- Bank 1 Register
Uppercase and lowercase letters are not unique in register names. You can specify either.
9.2.5 Memory variables
Use memory variables to use memory values in expressions. The format is as follows:
[Address].data-size
•
You can specify expressions in addresses (you can also specify memory variables).
•
The data size is specified as shown in the following table.
data Length
1 Byte
2 Bytes
4 bytes
Debugger
All
The debugger for M32R
Other
The debugger for M32R
The debugger for M32R, M16C/R8C
Specification
B or b
H or h
W or w
W or w
L or l
Example: Referencing the contents of memory at address 8000h in 2 bytes
[0x8000].W
•
The default data size is word, if not specified.
REJ10J2120-0100 Rev. 1.00
Dec. 01, 2010
Page 167 of 193
R32C/100 E30A Emulator Debugger
Chapter 9 Writing Script Files
9.2.6 Line Nos.
These are source file line Nos. The format for line Nos. is as follows:
#line_no
#line_no."source file name"
•
•
•
•
•
Specify line Nos. in decimal.
You can only specify line Nos. in which software breaks can be set. You cannot specify lines in which
no assembler instructions have been generated, including comment lines and blank lines.
If you omit the name of the source file, the line Nos. apply to the source file displayed in active
Editor(Source) Window.
Include the file attribute in the name of the source file.
Do not include any spaces between the line No. and name of the source file.
9.2.7 Character constants
The specified character or character string is converted into ASCII code and processed as a constant.
•
Enclose characters in single quote marks.
•
Enclose character strings in double quote marks.
•
The character string must consist of one or two characters (16 bits max.). If more than two
characters are specified, the last two characters of the string are processed. For example, "ABCD"
would be processed as "CD", or value 4344h.
9.2.8 Operators
The table below lists the operators that you can use in expressions.
•
The priority of operators is indicated by the level, level 1 being the highest and level 8 the lowest. If
two or more operators have the same level of priority, they are evaluated in order from the left of the
expression.
Operator
Function
Priority level
()
+, -, ~
Brackets
Monadic
positive,
monadic
negative, monadic logical NOT
Dyadic multiply, dyadic divide
Dyadic add, dyadic subtract
Right shift, left shift
Dyadic logical AND
Dyadic logical OR, dyadic
exclusive OR
Dyadic comparison
level 1
level 2
*, /
+, >>,
&
|, ^
<, <=, >, >=, ==, !=
REJ10J2120-0100 Rev. 1.00
Dec. 01, 2010
level 3
level 4
level 5
level 6
level 7
level 8
Page 168 of 193
R32C/100 E30A Emulator Debugger
Chapter 10 C/C++ Expressions
10. C/C++ Expressions
10.1 Writing C/C++ Expressions
You can use C/C++ expressions consisting of the tokens shown below for registering C watchpoints and for
specifying the values to be assigned to C watchpoints.
Token
Immediate values
Scope
Mathematical operators
Pointers
Reference
Sign inversion
Member reference using dot operator
Member reference using arrow
Pointers to Members
Parentheses
Arrays
Casting to basic types
Casting to typedef types
Variable names and function names
Character constants
Character string literals
Example
10, 0x0a, 012, 1.12, 1.0E+3
::name, classname::member
+, -, *, /
*, **, ...
&
Object.Member
Pointer->Member, this->Member
Object.*var, Pointer->*var
(, )
Array[2], DArray[2] [3] , ...
(int), (char*), (unsigned long *), ...
(DWORD), (ENUM), ...
var, i, j, func, ...
'A', 'b', ...
"abcdef", "I am a boy.", ...
10.1.1 Immediate Values
You can use hexadecimals, decimals, octals as immediate values. Values starting with 0x are processed as
hexadecimals, those with 0 as octals, and those without either prefix as decimals.
Floating-point numbers can also be used to assign values to variables.
Notes
•
•
You cannot register only immediate values as C watchpoints.
The immediate value is effective only when it is used in C/C++ language expressions that specify
C/C++ watchpoints or when it is used to specify the value to be assigned to those expressions. When
using floating-point numbers, operation cannot be performed on an expression like 1.0+2.0.
REJ10J2120-0100 Rev. 1.00
Dec. 01, 2010
Page 169 of 193
R32C/100 E30A Emulator Debugger
Chapter 10 C/C++ Expressions
10.1.2 Scope Resolution
The scope resolution operator :: is available as following.
Global scope: ::valiable name
::x, ::val
Class scope: class name::member name, class name::class name::member name, e.g.
T::member, A::B::member
10.1.3 Mathematical Operators
You can use the addition (+), subtraction (-), multiplication (*), and division (/) mathematical operators. The
following shows the order of priority in which they are evaluated.
(*), (/), (+), (-)
Notes
•
There is no support currently for mathematical operators for floating point numbers.
10.1.4 Pointers
Pointers are indicated by the asterisk (*). You can use pointer to pointers **, and pointer to pointer to pointers ***,
etc.
Examples: "*variable_name", "**variable_name", etc.
Notes
•
Immediate values cannot be processed as pointers. That is, you cannot specify *0xE000, for example.
10.1.5 Reference
References are indicated by the ampersand (&). You can only specify "&variable_name".
REJ10J2120-0100 Rev. 1.00
Dec. 01, 2010
Page 170 of 193
R32C/100 E30A Emulator Debugger
Chapter 10 C/C++ Expressions
10.1.6 Sign Inversion
Sign inversion is indicated by the minus sign (-). You can only specify "-immediate_value" or "-variable_name". No
sign inversion is performed if you specify 2 (or any even number of) minus signs.
Notes
•
There is no support currently for sign inversion of floating point numbers.
10.1.7 Member Reference Using Dot Operator
You can only use "variable_name.member_name" for checking the members of structures and unions using the dot
operator.
Example:
class T {
public:
int member1;
char member2;
};
class T t_cls;
class T *pt_cls = &t_cls;
In this case, t_cls.member1, (*pt_cls).member2 correctly checks the members.
10.1.8 Member Reference Using Arrow
You can only use "variable_name->member_name" for checking the members of structures and unions using the
arrow.
Example:
class T {
public:
int member1;
char member2;
};
class T t_cls;
class T *pt_cls = &t_cls;
In this case, (&t_cls)->member1, pt_cls->member2 correctly checks the members.
REJ10J2120-0100 Rev. 1.00
Dec. 01, 2010
Page 171 of 193
R32C/100 E30A Emulator Debugger
Chapter 10 C/C++ Expressions
10.1.9 Pointers to Members
Pointers to members using the ".*" or "->*" operator can be refered only in the forms of variable name .* member
name or variable name ->* member name.
Example:
class T {
public:
int member;
};
class T t_cls;
class T *pt_cls = &t_cls;
int T::*mp = &T::member;
In this case, t_cls.*mp and tp_cls->*mp can correctly reference the variable of pointer-to-member type.
Note
•
Note that the expression *mp cannot considered as the variable of pointer-to-member type.
10.1.10 Parentheses
Use the '(' and ')' to specify priority of calculation within an expression.
10.1.11 Arrays
You can use the ' [ ' and ' ] ' to specify the elements of an array. You can code arrays as follows: "variable_name
[ (element_No or variable) ] ", "variable_name [ (element_No or variable) ] [ (element_No or variable) ] ", etc.
10.1.12 Casting to Basic Types
You can cast to C basic types char, short, int, and long, and cast to the pointer types to these basic types. When
casting to a pointer type, you can also use pointers to pointers and pointers to pointers to pointers, etc.
Note that if signed or unsigned is not specified, the default values are as follows:
Basic type
char
short
int
long
Default
unsigned
signed
signed
signed
Notes
•
•
Of the basic types of C++, casts to bool type, wchar_t type, and floating-point type (float or double)
cannot be used.
Casts to register variables cannot be used.
REJ10J2120-0100 Rev. 1.00
Dec. 01, 2010
Page 172 of 193
R32C/100 E30A Emulator Debugger
Chapter 10 C/C++ Expressions
10.1.13 Casting to typedef Types
You can use casting to typedef types (types other than the C basic types) and the pointer types to them. When
casting to a pointer type, you can also use pointers to pointers and pointers to pointers to pointers, etc.
Notes
•
You cannot cast to struct or union types or the pointers to those types.
10.1.14 Variable Name
Variable names that begin with English alphabets as required
under C/C++ conventions can be used.
The maximum number of characters for variable name is 255.
And 'this' pointer is available.
10.1.15 Function Name
Function names that begin with English alphabets as required
under C conventions can be used.
In the case of C++, no function names can be used.
10.1.16 Character Constants
You can use characters enclosed in single quote marks (') as character constants. For example, 'A', 'b' , etc. These
character constants are converted to ASCII code and used as 1-byte immediate values.
Notes
•
•
You cannot register character constants only as C watchpoints.
Character constants are valid only when used in a C/C++ expression that specifies a C watchpoint,
and when specifying a value to be assigned (character constants are processed in the same manner
as immediate values).
10.1.17 Character String Literals
You can use character strings enclosed in double quote marks (") as character string literals. Examples are "abcde",
"I am a boy.", etc.
Notes
•
Character string literals can only be placed on the right side of an assignment operator in an
expression. They can only be used when the left side of the assignment operator is a char array or a
char pointer type. In all other cases, a syntax error results.
REJ10J2120-0100 Rev. 1.00
Dec. 01, 2010
Page 173 of 193
R32C/100 E30A Emulator Debugger
Chapter 10 C/C++ Expressions
10.2 Display Format of C/C++ Expressions
C/C++ expressions in the data display areas of the C Watch Windows are displayed as their type name, C/C++
expression (variable name), and result of calculation (value), as shown below.
The following describes the display formats of the respective types.
10.2.1 Enumeration Types
•
When the result (value) of calculation has been defined, its name is displayed.
(DATE) date = Sunday(all Radices)
•
If the result (value) of calculation has not been defined, it is displayed as follows:
(DATE) date = 16 (when Radix is in initial state)
(DATE) date = 0x10(when Radix is hex)
(DATE) date = 0000000000010000B(when Radix is binary)
10.2.2 Basic Types
•
When the result of calculation is a basic type other than a char type or floating point type, it is
displayed as follows:
(unsigned int) i = 65280(when Radix is in initial state)
(unsigned int) i = 0xFF00(when Radix is hex)
(unsigned int) i = 1111111100000000B(when Radix is binary)
When the result of calculation is a char type, it is displayed as follows:
(unsigned char) c = 'J'(when Radix is in initial state)
(unsigned char) c = 0x4A(when Radix is hex)
(unsigned char) c = 10100100B(when Radix is binary)
•
When the result of calculation is a floating point, it is displayed as follows:
(double) d = 8.207880399131839E-304(when Radix is in initial state)
(double) d = 0x10203045060708(when Radix is hex)
(double) d = 0000000010.....1000B(when Radix is binary)
(..... indicates abbreviation)
REJ10J2120-0100 Rev. 1.00
Dec. 01, 2010
Page 174 of 193
R32C/100 E30A Emulator Debugger
Chapter 10 C/C++ Expressions
10.2.3 Pointer Types
•
When the result of calculation is a pointer type to other than a char* type, it is displayed in
hexadecimal as follows:
(unsigned int *) p = 0x1234(all Radices)
When the result of calculation is a char* type, you can select the display format of the string or a
•
character in the C Watch window's menu [Display String].
- string types
(unsigned char *) str = 0x1234 "Japan"(all Radices)
- character types
(unsigned char *) str = 0x1234 (74 'J')(all Radices)
l When the result of calculation is a char* type, it is displayed as follows:
(unsigned char *) str = 0x1234 "Jap(all Radices)
If the string contains a non-printing code prior to the code to show the end of the string (0), it is displayed up to the
non-printing character and the closing quote mark is not displayed.
You can double-click on lines indicated by a '+' to see the members of that structure or union. The '+' changes to a '-'
while the members are displayed. To return to the original display, double click the line, now indicated by the '-'.
REJ10J2120-0100 Rev. 1.00
Dec. 01, 2010
Page 175 of 193
R32C/100 E30A Emulator Debugger
Chapter 10 C/C++ Expressions
10.2.4 Array Types
•
When the result of calculation is an array type other than a char [ ] type, the starting address is
displayed in hex as follows:
(signed int [10]) z = 0x1234(all Radices)
•
When the result of calculation is a char [ ] type, it is displayed as follows:
(unsigned char [10]) str = 0x1234 "Japan"(all Radices)
If the string contains a non-printing code prior to the code to show the end of the string (0), it is displayed up to the
non-printing character and the closing quote mark is not displayed.
(unsigned char [10]) str = 0x1234 "Jap(all Radices)
Also if the string contains more than 80 characters, the closing quote mark is not displayed. When the C/C++
expression is an array type as same as pointer type, a '+' is display to the left of the type name. You can see the
elements of the array by using this indicating. (for the details, refer"10.2.3 Pointer Types") When the number of the
array elements is more than 100, the following dialog box open. Specify the number of the elements in the dialog
box.
The elements from the index specified in "Start" to the index specified in "End" are displayed. If you specify the
value more than the max index of the array, the value is regarded as max index of the array. When you click the
"Cancel" button, the elements are not displayed.
10.2.5 Function Types
•
When the result of calculation is a function type, the starting address is displayed in hex as follows:
(void()) main = 0xF000(all Radices)
10.2.6 Reference Types
•
When the result of calculation is a reference type, the reference address is displayed in hex as
follows:
(signed int &) ref = 0xD038(all Radices)
10.2.7 Bit Field Types
•
When the result of calculation is a bit field type, it is displayed as follows:
(unsigned int :13) s.f = 8191(when Radix is in initial state)
(unsigned int :13) s.f = 0x1FFF(when Radix is hex)
(unsigned int :13) s.f = 1111111111111B(when Radix is binary)
REJ10J2120-0100 Rev. 1.00
Dec. 01, 2010
Page 176 of 193
R32C/100 E30A Emulator Debugger
Chapter 10 C/C++ Expressions
10.2.8 When No C Symbol is Found
If the calculated expression contained a C symbol that could not be found, it is displayed as follows:
() x = <not active>(all Radices)
10.2.9 Syntax Errors
•
When the calculated expression contains a syntax error, it is displayed as follows:
() str*(p = <syntax error>(all Radices)
(where str*(p is the syntax error)
10.2.10 Structure and Union Types
•
When the result of calculation is a structure or union type, the address is displayed in hex as follows:
(Data) v = 0x1234 (all Radices)
If, as in structures and unions, the C/C++ expression consists of members, a '+' is displayed to the left of the type
name (tag name).
You can double-click on lines indicated by a '+' to see the members of that structure or union. The '+' changes to a '-'
while the members are displayed. To return to the original display, double click the line, now indicated by the '-'.
This function allows you to check the members of structures and unions.
Attention
If a variable is declared with the same name as the type definition name declared by typedef, you cannot reference
that variable.
•
Register Variables
When the result of calculation is a register variable, "register" is displayed to the left of the type name as follows:
(register signed int) j = 100
REJ10J2120-0100 Rev. 1.00
Dec. 01, 2010
Page 177 of 193
R32C/100 E30A Emulator Debugger
Chapter 11 Display the Cause of the Program StoppageAttention
11. Display the Cause of the Program Stoppage
If the program is stoped by the debug function, the cause of the stoppage is displayed in the Output window or
Status window ([Platform] sheet).
The contents of a display and the meaning of "the cause of the stoppage" are as follows.
Display
Halt
Program
Event, Data Access
The cause of the stoppage
The stop by the [Halt Program] button/menu
Program break(software break) or Instruction Execution break(event
break)
Memory Access break(event break)
REJ10J2120-0100 Rev. 1.00
Dec. 01, 2010
Page 178 of 193
Chapter 12 Attention
R32C/100 E30A Emulator Debugger
12. Attention
12.1 Common Attention
12.1.1 File operation on Windows
1.
2.
File Name and Directory Name
- Operation is not guaranteed if your directory names and filenames include kanji.
- Use only one period in a filename.
Specify the File and Directory
- You cannot use "..." to specify two levels upper directories.
- You cannot use a network pathname. You must allocate a drive.
12.1.2 Area where software breakpoint can be set
The area where the software breakpoint can be set is different according to the product.
12.1.2.1 The debugger for R32C
Software breakpoints can be set in the MCU's internal RAM area, MCU's internal flash ROM area, and the RAM
area in the user target.
ATTENTION
•
•
If a breakpoint in the MCU's internal flash ROM area is specified, it is necessary that instructions be
rewritten or written back in block units. Therefore, no software breakpoints can be set while the
target program is running.
If the area is an instruction non-rewritable area such as the ROM area in the user target, no
software breakpoints can be set.
REJ10J2120-0100 Rev. 1.00
Dec. 01, 2010
Page 179 of 193
R32C/100 E30A Emulator Debugger
Chapter 12 Attention
12.1.3 Get or set C variables
•
If a variable is declared with the same name as the type definition name declared by typedef, you
cannot reference that variable.
Values cannot be changed for register variables.
•
Values cannot be changed for 64 bit width variables (long long, double, and so on).
•
•
Values cannot be changed for C/C++ expressions that do not indicate the memory address and size.
•
For the sake of optimization, the C compiler may place different variables at the same address. In
this case, values of the C variable may not be displayed correctly.
•
Literal character strings can only be substituted for char array and char pointer type variables.
•
No arithmetic operations can be performed on floating point types.
•
No sign inversion can be performed on floating point types.
•
Casting cannot be performed on floating point types.
•
Casting cannot be performed on register variables.
•
Casting cannot be performed on structure types, union types, or pointer types to structure or union
types.
•
Character constants and literal character strings cannot contain escape sequences.
•
The following values can be substituted for the bit-fields.
- integer constants, character constants, and enumerators
- variables of bool types, characters types, integers types, and enumeration types
- bit-field
When the substituted value is larger than the size of the bit-field, it will be truncated.
•
The bit-field member allocated in the SFR area might not be transformed into a correct value.
•
While the target program is running, values of local variables and bit-fields cannot be modified.
12.1.4 Function name in C++
•
•
•
•
•
When you input the address using the function name in setting display address, setting break points,
and so on, you can not specify the member function, operator function, and overloaded function, of a
class.
You can not use function names for C/C++ expression
No script commands (e.g., breakin and func) can be used in which function names are specified for
arguments.
In address value specifying columns of dialog boxes, no addresses can be specified using function
names.
The pointers for a member function can not be referred correctly in C watch window.
12.1.5 Option settings for download modules
These options, which can be set in "Debug Settings" dialog box, are invalid for this debugger:
•
Offset : specified value is regarded as ‘0’
•
Access size : specified value is regarded as ‘1’
•
Perform memory verify during download : Not supported.
12.1.6 Debugging multi modules
If you register two or more absolute module file in one session, you can download only one file in same time.
If you register one absolute module file and one or more machine language file in one session, you can download all
file in same time.
REJ10J2120-0100 Rev. 1.00
Dec. 01, 2010
Page 180 of 193
R32C/100 E30A Emulator Debugger
Chapter 12 Attention
12.1.7 Synchronized debugging
Synchronized debugging function is not available.
12.1.8 Down-load of Firmware
The emulator must have the suitable firmware downloaded into it. The debugger inspects the version of the
emulator's internal firmware as it starts up. If it is found that the emulator does not have the firmware files needed
for it, the emulator enters a mode in which the firmware is forced to be downloaded at the debugger startup.
12.1.9 Check of ID Code
Checks the ID code written in the flash memory at the debugger startup. When the ID code is written in the flash
memory, a dialog box to input the ID code appears. Enter the correct ID code in the dialog box. If the ID code you
have supplied does not match, the debugger will not start.
12.1.10 ID code write to flash memory
The ID code is written into the flash memory only when the program was downloaded in writer mode. When
operating in other than the writer mode, no ID code is written into the flash memory even when the program is
downloaded. In that case, an ID code consisting entirely of FFh is assumed.
12.1.11 The start procedure of debugger.
To start the debugger, follow one of the procedures described below.
•
Turn on the power for the emulator and target -> Start the debugger -> Set up the Init dialog box -> Reset the
target in hardware
Turn on the power for the emulator -> Start the debugger -> Set up the Init dialog box -> Turn on the power for
•
the target
If the target needs to be reset in hardware or the power for the target needs to be turned on, the dialog box to
inform that thing appears. In that case, reset the target in hardware or turn on the power for the target and then
click the OK button.
12.1.12 Use of Watch dog timer
You can debug a program making use of the watchdog timer. Only when the watchdog timer is active, the
emulator's monitor program performs refreshing.
12.1.13 Debugging Resource on MCU
Since the MCU's internal break events share trace events and time measurement events, there is a total of 8 break
events.
12.1.14 Setting of break point on MCU's internal RAM area
Please use the software breakpoint to the MCU's internal RAM area to use the hardware break resource effectively.
REJ10J2120-0100 Rev. 1.00
Dec. 01, 2010
Page 181 of 193
R32C/100 E30A Emulator Debugger
Chapter 12 Attention
12.2 Attention of the R32C Debugger
12.2.1 Stack area used by the emulator
The emulator uses the interrupt stack area as its work area (MAX 52 bytes).
When debugging, allocate a sufficient interrupt stack area consisting of the regularly used size plus 52 bytes.
12.2.2 Interrupt stack pointer when resetting the target program
The emulator sets the interrupt stack pointer (ISP) to 0500h when resetting the target program.
Remember that the interrupt stack pointer (ISP) is set to 0000h on a unit at the production stage.
12.2.3 RAM area used by the data compare break function
Be aware that when you are using the data comparison break function based on event E5, 8 bytes from the
beginning of the MCU's internal RAM (address 0400h) are used.
12.2.4 Option of C Compiler/Assembler/Linker
The information may not be downloaded/debugged normally depending on the option designation of the compiler,
assembler, and linker.
Refer to "12.3 Option of C Compiler/Assembler/Linker"
The compiler that can be used by R32C debugger:
•
NCxx
•
the IAR EC++ Compiler
•
the IAR C Compiler
REJ10J2120-0100 Rev. 1.00
Dec. 01, 2010
Page 182 of 193
R32C/100 E30A Emulator Debugger
Chapter 12 Attention
12.2.5 Downloading a program to external flash memory
Only flash memory with 4096 or fewer sectors can be registered. If flash memory with more sectors is connected,
programming cannot be guaranteed.
A script specified by the USD file corresponds to the executable memory_fill command of the
High-performance Embedded Workshop debugger. However, note that some options are not available.
The format to be used for script is as follows.
mf<start><end><data>[<mode>]
<start> start address
<end> end address
<data> data value
<mode> BYTE (one byte)
WORD (two byte)
LONG (four byte)
Abbreviation: (same as BYTE)
S/W breakpoints cannot be set in external flash memory.
Data in external flash memory cannot be changed by using the Memory window.
REJ10J2120-0100 Rev. 1.00
Dec. 01, 2010
Page 183 of 193
R32C/100 E30A Emulator Debugger
Chapter 12 Attention
12.3 Option of C Compiler/Assembler/Linker
We do not evaluate other settings, so we can not recommend to append other options.
12.3.1 When Using NCxx
When -O, -OR or -OS option is specified at compilation, the source line information may not be generated normally
due to optimization, causing step execution to be operated abnormally.
To avoid this problem, specify -ONBSD (or -Ono_Break_source_debug) option together with -O, -OR or OS option.
12.3.2 When Using the IAR EC++ Compiler (EW)
Please specify the project setting by following process.
1.
The Setting in the IAR Embedded Workbench
When you select the menu [Project] -> [Options...], the dialog for "Options For Target " target"" will open. In
this dialog, please select the "XLINK" as category, and set the project setting.
- Output Tab
In the "Format" area, check the "Other" option, and select the "elf/dwarf" as "Output Format".
- Include Tab
In the "XCL File Name" area, specify your XCL file (ex: lnkm32cf.xcl).
2.
Edit the XCL file
Add the command line option "-y" to your XCL file. The designation of "-y" option varies depending on the
product.
Product Name
The debugger for R32C
3.
-y Option
-yspc
Build your program after the setting above.
In the options other than the above-mentioned, the operation check is not done. Please acknowledge that the
options other than the above-mentioned cannot be recommended.
REJ10J2120-0100 Rev. 1.00
Dec. 01, 2010
Page 184 of 193
Chapter 12 Attention
R32C/100 E30A Emulator Debugger
12.3.3 When Using the IAR C Compiler (EW)
Please specify the project setting by following process.
1.
The Setting in the IAR Embedded Workbench
When you select the menu [Project] -> [Options...], the dialog for "Options For Target " target"" will open. In
this dialog, please select the "XLINK" as category, and set the project setting.
- Output Tab
In the "Format" area, check the "Other" option, and select the "ieee-695" as "Output Format".
- Include Tab
In the "XCL File Name" area, specify your XCL file (ex: lnkm16c.xcl).
2.
Edit the XCL file
Add the command line option "-y" to your XCL file. The designation of "-y" option varies depending on the
product.
Product Name
The debugger for R32C
3.
-y Option
-ylmba
Build your program after the setting above.
In the options other than the above-mentioned, the operation check is not done. Please acknowledge that the
options other than the above-mentioned cannot be recommended.
REJ10J2120-0100 Rev. 1.00
Dec. 01, 2010
Page 185 of 193
R32C/100 E30A Emulator Debugger
Chapter 12 Attention
12.3.4 When Using the IAR C Compiler (ICC)
12.3.4.1 Specify the Option
Please compile according to the following procedures and link.
•
At compilation
Specify the "-r" option.
Before linking
•
Open the linker's option definition file (extension .xcl) to be read when linking and add "-FIEEE695" and "-y"
options. The designation of "-y" option varies depending on the product.
Product Name
The debugger for R32C
-y Option
-ylmba
•
At link
Specify the linker's option definition file name using "-f" option.
In the options other than the above-mentioned, the operation check is not done. Please acknowledge that the
options other than the above-mentioned cannot be recommended.
12.3.4.2 Command Execution Examples
The following shows examples of entering commands depending on the product
•
The debugger for M32C
>ICCR32C -r file1.c<Enter>
>ICCR32C -r file2.c<Enter>
>XLINK -o filename.695 -f lnkr32c.xcl file1 file2<Enter>
The XCL file name varies depending on the product and memory model. For details, see the ICCxxxx manual.
REJ10J2120-0100 Rev. 1.00
Dec. 01, 2010
Page 186 of 193
R32C/100 E30A Emulator Debugger V.1.02
User’s Manual
Publication Date:
Dec 01, 2010
Rev.1.00
Published by:
Renesas Electronics Corporation
Edited by:
Microcomputer Tool Development Department 2
Renesas Solutions Corp.
http://www.renesas.com
SALES OFFICES
Refer to "http://www.renesas.com/" for the latest and detailed information.
Renesas Electronics America Inc.
2880 Scott Boulevard Santa Clara, CA 95050-2554, U.S.A.
Tel: +1-408-588-6000, Fax: +1-408-588-6130
Renesas Electronics Canada Limited
1101 Nicholson Road, Newmarket, Ontario L3Y 9C3, Canada
Tel: +1-905-898-5441, Fax: +1-905-898-3220
Renesas Electronics Europe Limited
Dukes Meadow, Millboard Road, Bourne End, Buckinghamshire, SL8 5FH, U.K
Tel: +44-1628-585-100, Fax: +44-1628-585-900
Renesas Electronics Europe GmbH
Arcadiastrasse 10, 40472 Düsseldorf, Germany
Tel: +49-211-65030, Fax: +49-211-6503-1327
Renesas Electronics (China) Co., Ltd.
7th Floor, Quantum Plaza, No.27 ZhiChunLu Haidian District, Beijing 100083, P.R.China
Tel: +86-10-8235-1155, Fax: +86-10-8235-7679
Renesas Electronics (Shanghai) Co., Ltd.
Unit 204, 205, AZIA Center, No.1233 Lujiazui Ring Rd., Pudong District, Shanghai 200120, China
Tel: +86-21-5877-1818, Fax: +86-21-6887-7858 / -7898
Renesas Electronics Hong Kong Limited
Unit 1601-1613, 16/F., Tower 2, Grand Century Place, 193 Prince Edward Road West, Mongkok, Kowloon, Hong Kong
Tel: +852-2886-9318, Fax: +852 2886-9022/9044
Renesas Electronics Taiwan Co., Ltd.
7F, No. 363 Fu Shing North Road Taipei, Taiwan
Tel: +886-2-8175-9600, Fax: +886 2-8175-9670
Renesas Electronics Singapore Pte. Ltd.
1 harbourFront Avenue, #06-10, keppel Bay Tower, Singapore 098632
Tel: +65-6213-0200, Fax: +65-6278-8001
Renesas Electronics Malaysia Sdn.Bhd.
Unit 906, Block B, Menara Amcorp, Amcorp Trade Centre, No. 18, Jln Persiaran Barat, 46050 Petaling Jaya, Selangor Darul Ehsan, Malaysia
Tel: +60-3-7955-9390, Fax: +60-3-7955-9510
Renesas Electronics Korea Co., Ltd.
11F., Samik Lavied' or Bldg., 720-2 Yeoksam-Dong, Kangnam-Ku, Seoul 135-080, Korea
Tel: +82-2-558-3737, Fax: +82-2-558-5141
© 2010 Renesas Electronics Corporation and Renesas Solutions Corp. All rights reserved.
Colophon 1.0
R32C/100 E30A Emulator Debugger V.1.02
User’s Manual
REJ10J2120-0100