1
To our customers,
Old Company Name in Catalogs and Other Documents
On April 1st, 2010, NEC Electronics Corporation merged with Renesas Technology
Corporation, and Renesas Electronics Corporation took over all the business of both
companies. Therefore, although the old company name remains in this document, it is a valid
Renesas Electronics document. We appreciate your understanding.
Renesas Electronics website: http://www.renesas.com
April 1st, 2010
Renesas Electronics Corporation
Issued by: Renesas Electronics Corporation (http://www.renesas.com)
Send any inquiries to http://www.renesas.com/inquiry.
Notice
1.
2.
3.
4.
5.
6.
7.
All information included in this document is current as of the date this document is issued. Such information, however, is
subject to change without any prior notice. Before purchasing or using any Renesas Electronics products listed herein, please
confirm the latest product information with a Renesas Electronics sales office. Also, please pay regular and careful attention to
additional and different information to be disclosed by Renesas Electronics such as that disclosed through our website.
Renesas Electronics does not assume any liability for infringement of patents, copyrights, or other intellectual property rights
of third parties by or arising from the use of Renesas Electronics products or technical information described in this document.
No license, express, implied or otherwise, is granted hereby under any patents, copyrights or other intellectual property rights
of Renesas Electronics or others.
You should not alter, modify, copy, or otherwise misappropriate any Renesas Electronics product, whether in whole or in part.
Descriptions of circuits, software and other related information in this document are provided only to illustrate the operation of
semiconductor products and application examples. You are fully responsible for the incorporation of these circuits, software,
and information in the design of your equipment. Renesas Electronics assumes no responsibility for any losses incurred by
you or third parties arising from the use of these circuits, software, or information.
When exporting the products or technology described in this document, you should comply with the applicable export control
laws and regulations and follow the procedures required by such laws and regulations. You should not use Renesas
Electronics products or the technology described in this document for any purpose relating to military applications or use by
the military, including but not limited to the development of weapons of mass destruction. Renesas Electronics products and
technology may not be used for or incorporated into any products or systems whose manufacture, use, or sale is prohibited
under any applicable domestic or foreign laws or regulations.
Renesas Electronics has used reasonable care in preparing the information included in this document, but Renesas Electronics
does not warrant that such information is error free. Renesas Electronics assumes no liability whatsoever for any damages
incurred by you resulting from errors in or omissions from the information included herein.
Renesas Electronics products are classified according to the following three quality grades: “Standard”, “High Quality”, and
“Specific”. The recommended applications for each Renesas Electronics product depends on the product’s quality grade, as
indicated below. You must check the quality grade of each Renesas Electronics product before using it in a particular
application. You may not use any Renesas Electronics product for any application categorized as “Specific” without the prior
written consent of Renesas Electronics. Further, you may not use any Renesas Electronics product for any application for
which it is not intended without the prior written consent of Renesas Electronics. Renesas Electronics shall not be in any way
liable for any damages or losses incurred by you or third parties arising from the use of any Renesas Electronics product for an
application categorized as “Specific” or for which the product is not intended where you have failed to obtain the prior written
consent of Renesas Electronics. The quality grade of each Renesas Electronics product is “Standard” unless otherwise
expressly specified in a Renesas Electronics data sheets or data books, etc.
“Standard”:
8.
9.
10.
11.
12.
Computers; office equipment; communications equipment; test and measurement equipment; audio and visual
equipment; home electronic appliances; machine tools; personal electronic equipment; and industrial robots.
“High Quality”: Transportation equipment (automobiles, trains, ships, etc.); traffic control systems; anti-disaster systems; anticrime systems; safety equipment; and medical equipment not specifically designed for life support.
“Specific”:
Aircraft; aerospace equipment; submersible repeaters; nuclear reactor control systems; medical equipment or
systems for life support (e.g. artificial life support devices or systems), surgical implantations, or healthcare
intervention (e.g. excision, etc.), and any other applications or purposes that pose a direct threat to human life.
You should use the Renesas Electronics products described in this document within the range specified by Renesas Electronics,
especially with respect to the maximum rating, operating supply voltage range, movement power voltage range, heat radiation
characteristics, installation and other product characteristics. Renesas Electronics shall have no liability for malfunctions or
damages arising out of the use of Renesas Electronics products beyond such specified ranges.
Although Renesas Electronics endeavors to improve the quality and reliability of its products, semiconductor products have
specific characteristics such as the occurrence of failure at a certain rate and malfunctions under certain use conditions. Further,
Renesas Electronics products are not subject to radiation resistance design. Please be sure to implement safety measures to
guard them against the possibility of physical injury, and injury or damage caused by fire in the event of the failure of a
Renesas Electronics product, such as safety design for hardware and software including but not limited to redundancy, fire
control and malfunction prevention, appropriate treatment for aging degradation or any other appropriate measures. Because
the evaluation of microcomputer software alone is very difficult, please evaluate the safety of the final products or system
manufactured by you.
Please contact a Renesas Electronics sales office for details as to environmental matters such as the environmental
compatibility of each Renesas Electronics product. Please use Renesas Electronics products in compliance with all applicable
laws and regulations that regulate the inclusion or use of controlled substances, including without limitation, the EU RoHS
Directive. Renesas Electronics assumes no liability for damages or losses occurring as a result of your noncompliance with
applicable laws and regulations.
This document may not be reproduced or duplicated, in any form, in whole or in part, without prior written consent of Renesas
Electronics.
Please contact a Renesas Electronics sales office if you have any questions regarding the information contained in this
document or Renesas Electronics products, or if you have any other inquiries.
(Note 1) “Renesas Electronics” as used in this document means Renesas Electronics Corporation and also includes its majorityowned subsidiaries.
(Note 2) “Renesas Electronics product(s)” means any product developed or manufactured by or for Renesas Electronics.
User’s Manual
M3T-PD79SIM V.3.20
User’s Manual
Simulator Debugger for 79xx Series
Rev.1.00 2003.05
• Microsoft, MS-DOS, Windows, and Windows NT are registered trademarks of Microsoft Corporation in the U.S. and other countries.
• IBM and AT are registered trademarks of International Business Machines Corporation.
• Intel and Pentium are registered trademarks of Intel Corporation.
• Adobe, Acrobat, and Acrobat Reader are trademarks of Adobe Systems Incorporated.
• All other brand and product names are trademarks, registered trademarks or service marks of their respective holders.
Keep safety first in your circuit designs!
z Renesas Technology Corporation and Renesas Solutions Corporation put the maximum effort into making semiconductor products
better and more reliable, but there is always the possibility that trouble may occur with them. Trouble with semiconductors may lead to
personal injury, fire or property damage. Remember to give due consideration to safety when making your circuit designs, with
appropriate measures such as (i) placement of substitutive, auxiliary circuits, (ii) use of nonflammable material or (iii) prevention
against any malfunction or mishap.
Notes regarding these materials
z These materials are intended as a reference to assist our customers in the selection of the Renesas Technology product best suited to
the customer's application; they do not convey any license under any intellectual property rights, or any other rights, belonging to
Renesas Technology Corporation, Renesas Solutions Corporation or a third party.
z Renesas Technology Corporation and Renesas Solutions Corporation assume no responsibility for any damage, or infringement of any
third-party's rights, originating in the use of any product data, diagrams, charts, programs, algorithms, or circuit application examples
contained in these materials.
z All information contained in these materials, including product data, diagrams, charts, programs and algorithms represents information
on products at the time of publication of these materials, and are subject to change by Renesas Technology Corporation and Renesas
Solutions Corporation without notice due to product improvements or other reasons. It is therefore recommended that customers
contact Renesas Technology Corporation, Renesas Solutions Corporation or an authorized Renesas Technology product distributor
for the latest product information before purchasing a product listed herein. The information described here may contain technical
inaccuracies or typographical errors. Renesas Technology Corporation and Renesas Solutions Corporation assume no responsibility
for any damage, liability, or other loss rising from these inaccuracies or errors. Please also pay attention to information published by
Renesas Technology Corporation and Renesas Solutions Corporation by various means, including the Renesas home page
(http://www.renesas.com).
z When using any or all of the information contained in these materials, including product data, diagrams, charts, programs, and
algorithms, please be sure to evaluate all information as a total system before making a final decision on the applicability of the
information and products. Renesas Technology Corporation and Renesas Solutions Corporation assume no responsibility for any
damage, liability or other loss resulting from the information contained herein.
z Renesas Technology semiconductors are not designed or manufactured for use in a device or system that is used under
circumstances in which human life is potentially at stake. Please contact Renesas Technology Corporation, Renesas Solutions
Corporation or an authorized Renesas Technology product distributor when considering the use of a product contained herein for any
specific purposes, such as apparatus or systems for transportation, vehicular, medical, aerospace, nuclear, or undersea repeater use.
z The prior written approval of Renesas Technology Corporation and Renesas Solutions Corporation is necessary to reprint or reproduce
in whole or in part these materials.
z If these products or technologies are subject to the Japanese export control restrictions, they must be exported under a license from
the Japanese government and cannot be imported into a country other than the approved destination. Any diversion or reexport
contrary to the export control laws and regulations of Japan and/or the country of destination is prohibited.
z Please contact Renesas Technology Corporation or Renesas Solutions Corporation for further details on these materials or the
products contained therein.
For inquiries about the contents of this document or product, fill in the text file the installer generates in the following directory and email
to your local distributor.
¥SUPPORT¥Product-name¥SUPPORT.TXT
Renesas Tools Homepage http://www.renesas.com/en/tools
Preface
The PD79SIM is a simulator debugger for Windows, which simulates the 7900 series
operation of 16-bit microcomputer and evaluates the target program. This user's manual
describes the PD79SIM's features, functions, setting up and operational procedures.
Rights to the Program
The right to use the program is granted according to provisions under a software license
agreement. The PD79SIM program can only be used for the purposes of product development
by the user, and cannot be used for any other purposes.
Note also that the information in this manual does not convey any guarantee or license for the
use of software. If you agree to each article in the Software License Agreement, please fill out
and return your Registration Fax.
Contents
Contents
INTRODUCTION
1
1 PD79SIM Introduction
3
2 PD79SIM Features
4
2.1 Multi-Windowing Function ...................................................................................4
2.2 I/O Simulation Function........................................................................................4
2.3 Interrupt Simulation Function..............................................................................4
2.4 Simplified System Simulation Function................................................................4
2.5 RAM Monitor Function..........................................................................................4
2.6 Break Functions ....................................................................................................5
2.7 Source Level Debugging Function.........................................................................5
2.8 On-Demand Method ..............................................................................................5
3 PD79SIM Simulation Specifications
6
3.1 Main Differences to Actual MCU ..........................................................................6
3.2 Operation of Instructions ......................................................................................7
3.3 Resetting................................................................................................................8
3.4 Memory..................................................................................................................8
3.5 Virtual Port Input Function ..................................................................................9
3.6 Virtual Port Output Function ...............................................................................9
3.7 Virtual Interrupt Function....................................................................................9
3.8 GUI Input Function.............................................................................................10
3.9 GUI Output Function ..........................................................................................10
3.10 I/O Script Function ............................................................................................10
3.11 Unique Simulator Functions .............................................................................11
4 PD79SIM Input and Output Files
12
4.1 Input Files ...........................................................................................................12
4.2 Output Files.........................................................................................................14
4.3 Temporary Files ..................................................................................................15
SETUP
17
1 Setup
19
1.1 Installation ..........................................................................................................19
i
PD79SIM User’s Manual
1.2 Starting PD79SIM ...............................................................................................19
1.3 pd79sim Setup .....................................................................................................20
1.4 sim79 Setup .........................................................................................................22
WINDOW FUNCTION
25
1 WINDOW FUNCTION OF PD79SIM
27
1.1 The PD79SIM Window ........................................................................................27
1.2 Program Window .................................................................................................33
1.3 Source Window ....................................................................................................38
1.4 Register Window..................................................................................................41
1.5 Memory Window..................................................................................................43
1.6 Dump Window .....................................................................................................45
1.7 RAM Monitor Window .........................................................................................47
1.8 ASM Watch Window............................................................................................50
1.9 C Watch Window .................................................................................................53
1.10 Local Window ....................................................................................................56
1.11 File Local Window .............................................................................................58
1.12 Global Window...................................................................................................60
1.13 Script Window ...................................................................................................61
1.14 I/O Window ........................................................................................................63
1.15 GUI Input Window ............................................................................................80
1.16 GUI Output Window..........................................................................................82
1.17 MR Window .......................................................................................................84
1.18 Coverage Window ..............................................................................................86
1.19 S/W Break Point Setting Dialog Box .................................................................89
1.20 H/W Break Point Setting Dialog Box ................................................................90
BASIC OPERATION
91
1 Loading and Displaying the Target Program
93
1.1 Downloading........................................................................................................93
1.2 To Reload the recent downloaded file..................................................................94
1.3 To download the target program automatically when updated ..........................95
1.4 Changing Program Display Position Immediately After Downloading ..............95
1.5 Uploading ............................................................................................................96
ii
Contents
1.6 Saving Results of Disassembly ............................................................................96
1.7 Continuing to Display a Selected Program Position ...........................................97
1.8 Changing the Program Display Position .............................................................97
1.9 Checking Source Programs in Other Directories ..............................................101
1.10 Mixing Source and Disassemble Displays .......................................................102
1.11 Displaying the Results of Disassembling ........................................................103
1.12 Changing Display Colors .................................................................................104
2 Starting and Stopping Target Program Execution
105
2.1 Starting and Stopping .......................................................................................105
2.2 Step Execution...................................................................................................107
2.3 Returning from Current to Calling Routine......................................................108
2.4 Program Execution to Specified Location..........................................................108
2.5 Resetting the Program ......................................................................................109
3 Checking and Setting Register Data and Memory Contents
110
3.1 Checking the Contents of Registers ..................................................................110
3.2 Changing the Contents of Registers..................................................................111
3.3 Checking Changes in RAM During Target Program Execution........................113
3.4 Checking the Value at a Specified Address.......................................................114
3.5 To switch scope ..................................................................................................117
3.6 Setting Data at a Specified Address..................................................................117
3.7 Updating the Memory Display ..........................................................................119
3.8 Checking and Changing Memory Map Data .....................................................119
3.9 To change the acquisition mode of the memory ................................................119
4 Software Breaks
120
4.1 Opening the S/W Break Point Setting Dialog Box ............................................120
4.2 Setting a Break Point ........................................................................................121
4.3 Deleting a Break Point ......................................................................................122
4.4 Temporarily Disabling Break Points.................................................................122
4.5 Temporarily Enabling Break Points..................................................................123
4.6 Setting a Break Point from Program (Source) Window ....................................123
4.7 Setting Breakpoints from the Toolbar...............................................................124
4.8 Saving Breakpoints ...........................................................................................124
4.9 Loading Saved Breakpoints...............................................................................124
5 Hardware Breaks
125
5.1 Opening the H/W Break Point Setting Dialog Box............................................125
iii
PD79SIM User’s Manual
5.2 Setting Hardware Breakpoints .........................................................................126
5.3 Deleting a Hardware Breakpoint ......................................................................129
6 CHECKING C VARIABLES
130
6.1 Checking C Variables ........................................................................................130
6.2 To change the value of a C variable...................................................................133
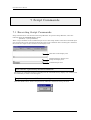
7 SCRIPT COMMANDS
134
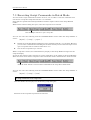
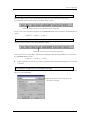
7.1 Executing Script Commands .............................................................................134
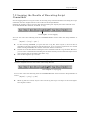
7.2 Logging the Results of Executing Script Commands......................................135
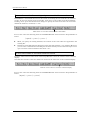
7.3 Executing Script Commands in Batch Mode.....................................................138
8 EXITING PD79SIM
140
8.1 Exiting PD79SIM ..............................................................................................140
9 MISCELLANEOUS
141
9.1 Line Assemble....................................................................................................141
9.2 Starting Up Make..............................................................................................143
9.3 Searching for Character Strings in Target Program ......................................144
9.4 Changing Window Proportions..........................................................................145
9.5 Switching Over Active Windows .......................................................................146
9.6 Displaying the Version of PD79SIM..................................................................146
9.7 To Configure the operation of the PD79SIM .....................................................146
9.8 To Open the Editor ............................................................................................147
HIGH-END DEBUGGING
149
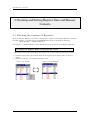
1 Setting Virtual Port Inputs in I/O Window
151
1.1 Overview............................................................................................................151
1.2 Setting Cycle-synchronized Inputs....................................................................151
1.3 Setting Read Access-synchronized Inputs.........................................................154
1.4 Setting Interrupt-synchronized Inputs .............................................................156
2 Setting Virtual Port Outputs in I/O Window
159
2.1 Overview............................................................................................................159
2.2 Setting Virtual Port Outputs.............................................................................159
3 Setting Virtual Interrupts in I/O Window
161
3.1 Overview............................................................................................................161
3.2 Setting Cycle-synchronized Interrupts..............................................................161
iv
Contents
3.3 Setting Executed Address-synchronized Interrupts..........................................164
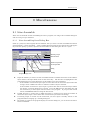
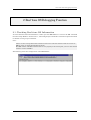
4 Other Functions of I/O Window
166
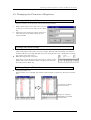
4.1 Changing Setup Data of Virtual Port Inputs and Virtual Interrupts...............166
4.2 Deleting Virtual Port Inputs, Virtual Port Outputs, Virtual Interrupts, or I/O Script
Files Set...................................................................................................................171
4.3 Changing Display Mode of Virtual Port Input, Virtual Port Output, or Virtual
Interrupt..................................................................................................................176
4.4 Changing Scale of Display Screen .....................................................................177
4.5 Changing Colors of Display Screen ...................................................................178
4.6 Searching for Display Data ...............................................................................179
4.7 Listing Registered I/O Script Files ....................................................................180
4.8 Regarding Evaluation Timings of Virtual Port Inputs, Virtual Interrupts, and I/O
Script Files Set ........................................................................................................180
5 Setting GUI Input Window
181
5.1 Overview............................................................................................................181
5.2 Creating Buttons ...............................................................................................181
5.3 Saving Buttons You've Created.........................................................................183
5.4 Changing Button Position or Settings after Creating Button...........................184
5.5 Copying buttons.................................................................................................185
5.6 Deleting buttons ................................................................................................186
5.7 Displaying Grid Lines........................................................................................186
6 Setting GUI Output Window
187
6.1 Overview............................................................................................................187
6.2 Creating Labels .................................................................................................188
6.3 Creating LEDs...................................................................................................190
6.4 Saving Parts You've Created.............................................................................192
6.5 Changing Parts Position or Settings after Creating Parts................................193
6.6 Copying Parts ....................................................................................................193
6.7 Deleting Parts....................................................................................................194
6.8 Displaying Grid Lines........................................................................................194
7 I/O Script Function
195
7.1 Overview............................................................................................................195
7.2 Method for Writing I/O Script ...........................................................................195
7.3 Composition of I/O Script ..................................................................................197
7.4 Method for Writing Right-side Expressions ......................................................201
v
PD79SIM User’s Manual
7.5 Method for Writing Left-side Expressions ........................................................204
8 Coverage Information
206
8.1 Referencing Coverage ........................................................................................206
8.2 Updating Coverage Display...............................................................................206
8.3 Initializing Coverage .........................................................................................206
8.4 Saving/Loading Coverage Measurement Information.......................................207
9 Customize Function
208
9.1 About Customize Function ................................................................................208
REAL-TIME OS DEBUGGING
213
1 Executing MR79 Application Programs
215
1.1 Setting Timer Interrupts...................................................................................215
2 Real-time OS Debugging Function
217
2.1 Checking Real-time OS Information .................................................................217
2.2 Measuring Sizes of System and Task Stacks Used ...........................................230
REFERENCE
235
1 Table of Script Commands
237
1.1 Input Format .....................................................................................................237
1.2 Tables of Commands..........................................................................................238
2 Writing Script Files
253
2.1 Structural Elements of a Script File .................................................................253
2.2 Writing Expressions ..........................................................................................255
3 C Expressions
259
3.1 Writing C Expressions.......................................................................................259
3.2 Display Format of C Expressions ......................................................................262
4 Error Messages
267
INDEX
279
vi
Introduction
1
2
PD79SIM Introduction
1 PD79SIM Introduction
The PD79SIM is a simulator debugger for Windows, which simulates the 7900 series operation of
16-bit microcomputer and evaluates the target program.
PD79SIM comprises the following software:
1. pd79sim(the simulator debugger front end)
2. sim79(the simulator engine)
3
P D 7 9 S I M U s e r ’s M a n u a l
2 PD79SIM Features
2.1 Multi-Windowing Function
PD79SIM supports multiple overlapping windows, enabling you to simultaneously view a wide range
of data. Each window contains menus and buttons, allowing commands to be executed by clicking
with the mouse.
2.2 I/O Simulation Function
PD79SIM provides the following I/O simulation functions:
l Virtual port input function
Changes of the data that is input from external devices to memory can be defined in the I/O
Window or a file.
l Virtual port output function
The data that is output to memory by a program can be recorded.Changes of the recorded data can
be graphically displayed.
2.3 Interrupt Simulation Function
Software interrupts can be defined.
I/O Window or a file.
You can define the interrupts you want to be generated in the
2.4 Simplified System Simulation Function
l GUI Input function
Key matrix can be defined by GUI.
l GUI output function
LEDs, etc. can be defined by GUI.
2.5 RAM Monitor Function
PD79SIM supports a RAM monitoring function, making it possible to check the contents of memory
while executing the target program. The memory area monitored by this function is called the RAM
monitor area. The PD79SIM have a 1KB RAM monitor area, which can be mapped to any address.
You can use the RAM Monitor Window to monitor the RAM monitor area.
4
PD79SIM Features
2.6 Break Functions
PD79SIM has the following two break functions:
2.6.1 Software Break
Software breaks allow program execution to be stopped before the command at the specified address.
The point at which this break occurs is called the software breakpoint. You can set software
breakpoints from the S/W Break Point Setting dialog box. You can also easily set them from the
Program Window and Source Window. PD79SIM supports up to 64 software breakpoints.
You can set and read in the software breakpoint file via the S/W Break Point Setting dialog box.
2.6.2 Hardware Break
Hardware breaks allow program execution to be stopped on detection of data being written to memory,
read from memory, or an instruction being fetched. The point at which this break occurs is called the
hardware breakpoint. You can set hardware breakpoints from the H/W Break Point Setting dialog
box. PD79SIM supports up to 64 hardware breakpoints.
2.7 Source Level Debugging Function
You can display source files and perform source level debugging such as setting break points in the
source lines and performing step execution. PD79SIM allows debugging at the C language level and
at the assembly language level.
l You can use the Program Window and Source Window to view source files.
l You can use the C Watch Window, Local Window, File Local Window, and Global Window to view
the C variables and C expressions in C source files.
l You can use the ASM Watch Window to view labels and symbols in assembler source files.
l You can use labels and symbols to specify the addresses of breakpoints, etc. First local, then global,
labels and symbols are converted to values. When you specify variables (or functions) defined in a C
source file, add the underbar (_) before the name of the variable (or function). In the case of
functions whose arguments are passed via registers, specify "$". (See the Rules for Calling
Functions in the nc79 User's Manual for specifications of functions whose arguments are passed
via registers.)
2.8 On-Demand Method
PD79SIM supports the "on-demand" method whereby a temporary file is created when a target
program has been downloaded, and the required debugging information is read into memory as
required. This method conserves memory. However, by default, pd79sim uses the "on-memory"
method, in which all debugging information is stored in memory.
Use the pd79sim setup to select the "on-demand" or "on-memory" method of storing debugging
information. See Section 1.3, "pd79sim Setup" in the setup section of this manual for details.
Temporary files are created with the filename pdb_xxxx.tmp (where xxxx is a 4-digit hexadecimal
value) in the directory containing the downloaded files. Temporary files are deleted immediately
before downloading and when you quit PD79SIM. Select the "on-memory" method if there is any file
with the same name as the temporary file.
Temporary files are created in the directory specified from the Init dialog box. If the specified
directory contains a file of the same name as the temporary file, change the directory where you want
the temporary file to be created or choose the "on-memory" method.
5
P D 7 9 S I M U s e r ’s M a n u a l
3 PD79SIM Simulation Specifications
3.1 Main Differences to Actual MCU
This section describes the main differences between PD79SIM and the actual MCU.
See later sections for details.
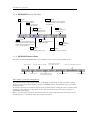
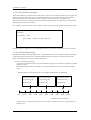
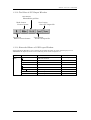
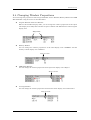
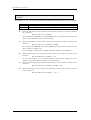
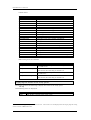
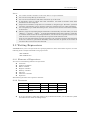
3.1.1 Realtime Timings
Time management by PD79SIM is performed in cycles. However, the following differs from the
actual chip. Here, the number of cycles are indicated by values stipulated in 7900 Series Software
Manual.
l The bus width, queue, and wait states are not considered when measuring the number of cycles.
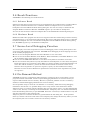
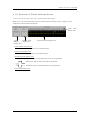
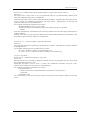
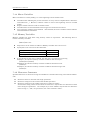
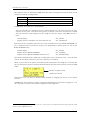
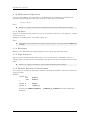
l PD79SIM starts counting cycles immediately after a reset. (Cycles immediately after a reset are
0.) The number of cycles needed to execute one machine instruction are added on for each
instruction executed. (See Figure 3.1 shown below.)
If four cycles are required for the LDA instruction,
cycles are added at this point in time.
If two cycles are required for the CMP instruction,
cycles are added at this point in time.
LDA instruction
CMP instruction
0
1
2
3
4
5
6
7
8
9
Execution cycles
Figure 3.1
Method for measuring
In the above example, no cycles are added while the LDA or CMP instruction is being executed. The
cycles required for each instruction are added after instruction execution.
Note that the virtual port input/output and virtual interrupt functions are processed after instruction
execution is completed.
6
PD79SIM S i m u l a t i o n S p e c i f i c a t i o n s
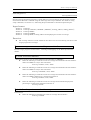
3.1.2 Peripheral I/O
Peripheral I/Os other than the CPU core on the actual chip, such as timers, DMAC, and serial
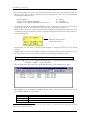
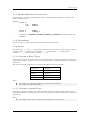
I/Os are not supported. In PD79SIM, the SFR area (000000 16 to 0000FF 16) to which peripheral
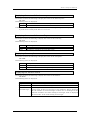
I/Os are connected is handled as RAM. However, bit 1 of the processor mode register 1
(00005F 16) shown below is handled as a direct addressing mode select bit.
Processor mode register 1 (00005F16 )
b7 b6 b5 b4 b3 b2 b1 b0
b1
Direct addressing select bit
0
Only one line of DPR0 is used.
1
Four lines of DPR0-3 are used.
When bit 1 is set to 1 in a program, addressing based on DPR0-3 is enabled.
Other bits do not have any effect in PD79SIM. This register is initialized to
"3C16 " when reset.
For serial I/Os, the virtual port input/output function described later can be used as a pseudoserial I/O.
3.1.3 Memory Space
There is no processor mode. If mapped for memory, the whole 16MB of memory from 000000 16 to
FFFFFF 16 can be read from and written to as RAM.
However, if you try to access an area which is not allocated to memory, an error occurs. If this
occurs while a program is running, the program will stop with an illegal memory access error.
Use the map function, described later, to map this part of memory.
3.1.4 Interrupts
In the actual MCU, peripheral I/O (including external interrupt signals) are generating factors
for interrupts. However, PD79SIM has nothing corresponding to peripheral I/O.
PD79SIM provides another method in place of this, which allows you to generate interrupts in a
simulated manner (virtual interrupt function). Virtual interrupts can be generated at any time,
e.g., in a specified cycle or at an executed address.
3.2 Operation of Instructions
3.2.1 W I T , S T P
Executed as an NOP instruction.
Other instructions operate the same as those of the actual MCU.
7
P D 7 9 S I M U s e r ’s M a n u a l
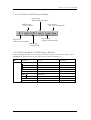
3.3 Resetting
l The S register is initialized to 0FFF 16. For the PS register, only the I flag is set to 1. The
reset vector is set to a value "C00016" immediately after startup, so that the program counter
value immediately after PD79SIM has been invoked is 00C00016. All other registers are
initialized to 0.
l The SFR area is nonexistent in PD79SIM , so the initialization as in the actual chip is not
performed.
l The cycle count is initialized to 0.
Note that the device is reset when PD79SIM is invoked.
3.4 Memory
3.4.1 Types of Memory
The whole memory area (000000 16 to FFFFFF 16) is processed as RAM. Areas except a space range
from 00000016 to 00FFFF 16 and a space (64 KB) containing the interrupt vector area are not
allocated to memory initially. Use the map function to map memory to this area. Specify the
interrupt vector area in the MCU file. See Section 1.3, "pd79sim Setup" in the Setup for details of
how to specify MCU file.
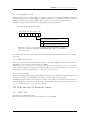
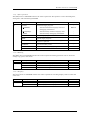
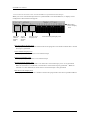
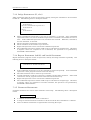
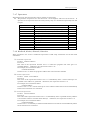
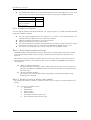
3.4.2 Memory Structure and Initial Values Immediately after
Starting
The memory is set up as follows immediately after starting PD79SIM .
00000016 to 0000FF 16 (SFR area)
00005F 16
00010016 to 00FFFF 16
interrupt vector area
reset vector area
other area
starting
Filled with 0016
Set to 3C16
Filled with 7416 (NOP)
Filled with 7416 (NOP)
Set to C00016
No
memory
immediately
after
3.4.3 The Map Function: MAP Command
The PD79SIM simulator divides the memory between 000000 16 and FFFFFF 16 into 256 equal
parts, so that the memory space can be mapped in 64KB blocks. Memory spaces which contain a
map having the lowest-ordered addresses (00000016 and 00FFFF 16 ) and the interrupt vector area
are allocated to memory when the simulator starts.
Use the MAP command to map the simulator memory. Memory mapped using this command is
initialized with the value 7416 (NOP) immediately after being allocated.
When downloading a target program, the memory is mapped automatically.
Note:
Memory space that has been mapped cannot be deleted.
3.4.4 Accessing an Area Without Memory
If you access an area which is not allocated to memory, the system issues an error of "Improper
access to memory" and interrupts execution of a program or a command, whichever is specified.
(Note that if this occurs when executing a program, no error is output although the program
execution is suspended.)
8
PD79SIM Simulation Specifications
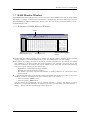
3.5 Virtual Port Input Function
This function defines changes of the data that is input from external devices to a specified memory
address. Using this function you can simulate data inputs to the ports defined in SFR.
The following shows timings at which data can be input to memory:
1. When program execution has reached a specified number of cycles
2. When a specified memory location is accessed for read by a program
3. When a specified virtual interrupt is generated
The input data at the above timings can be defined from the I/O Window.
Furthermore, this function can be used in combination with the I/O script function, a function that
allows you to define virtual port inputs and virtual interrupts. (For details, refer to "High-end
Debugging" described later in this manual.) Using this I/O script function, you can specify more
precise data input timings such as when the program fetches an instruction, when the program
writes to memory, or when the program has executed instructions a specified number of times.
3.6 Virtual Port Output Function
When a data write to some memory address by the program occurs, this function records the written
data value and the cycle at which the data was written.
The recorded data can be verified in graphic or numeric format from the I/O Window.
The maximum number of data that can be recorded by this function is 30,000 entries counted from
the beginning of program execution.
3.7 Virtual Interrupt Function
This function defines interrupt generation. Using this function you can generate timer interrupts and
AD conversion interrupts in a simulated manner without having to actually generate them.
The following shows timings at which virtual interrupts can be generated:
1. When program execution has reached a specified number of cycles
2. When the program has executed a specified address
Virtual interrupts at the above timings can be defined from the I/O Window.
Furthermore, this function can be used in combination with the I/O script function, a function that
allows you to define virtual port inputs and virtual interrupts. (For details, refer to "High-end
Debugging" described later in this manual.) Using this I/O script function, you can specify more
precise interrupt generation timings such as when the program reads or writes to memory or when
the program has executed instructions a specified number of times.
9
P D 7 9 S I M U s e r ’s M a n u a l
3.7.1 Differences between Virtual Interrupts and Interrupts in Actual
Chip
Virtual interrupts differ from interrupts in the actual chip in the following points:
1. About interrupt control register
When a virtual interrupt is generated, the interrupt control register's interrupt request bit is not
set to 1. The interrupt priority specified in the interrupt priority level bit is not referenced
either.The priority of virtual interrupts can be specified when you set virtual interrupts from the
I/O Window or in I/O script. Note that the I/O script function allows you to write statements to
the effect that the interrupt request bit be set to 1 when an interrupt occurs.
2. Special hardware interrupts cannot be generated as virtual interrupts.
Reset, NMI, DBC, watchdog timer, address match interrupts cannot be generated as virtual
interrupts.
3. If virtual interrupts of the same priority occur simultaneously
If in the actual chip, multiple interrupts of the same priority occur simultaneously, they are
resolved according to the priority levels set in hardware so that an interrupt of the highest priority
is accepted. For virtual interrupts, however, all interrupts belonging to one interrupt type (e.g.,
peripheral I/O interrupt) are handled as having the same priority. Therefore, if virtual interrupts
of the same priority occur simultaneously, the order in which they are accepted is indeterminate.
3.8 GUI Input Function
This function implements the user target system's simple key input panel (buttons) in a window.
The key input panel is created in the GUI input window.
By pressing a button created in the GUI input window, you can accomplish virtual port inputs and
virtual interrupts.
l Input data to a specified memory address (virtual port input)
l Generate a specified virtual interrupt
l Accomplish specified virtual interrupt and virtual port input simultaneously
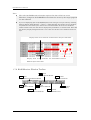
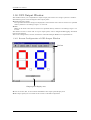
3.9 GUI Output Function
This function implements the user target system's simple output panel in a window. The output
panel is created in the GUI input window.
The following parts can be arranged on this output panel:
l Character string
User-specified character strings are displayed or erased when some value is written to a specified
memory address or according to logic 1 or 0 in bits.
l LED
LEDs are lit when some value is written to a specified memory address or according to logic 1 or 0
in bits.
3.10 I/O Script Function
This function allows you to write virtual port input and virtual interrupt settings to a file in script
form. Therefore, it provides a more flexible way to define virtual port inputs and virtual interrupts
than can be set from the I/O Window. Specifically, this includes, for example, reading the divideby-N ratios you've set in the timer register and generating a timer interrupt periodically.
For details about I/O scripts, refer to "High-end Debugging" described later in this manual.
10
PD79SIM Simulation Specifications
3.11 Unique Simulator Functions
3.11.1 Stack Utilization Monitor: The StackMonitor (SM) Command
Use the StackMonitor command to check the maximum and minimum addresses of the stack, and to
determine how much the program has used of what part of the stack.
The stack monitoring continues from the time that a Go or GoFree command is invoked until it is
interrupted, the maximum and minimum values being recorded for the two stack pointers (S and ISP
registers).
If, while the program is running, it causes a change in the value of a stack pointer, monitoring of
stack utilization of that stack stops at that point.
3.11.2 Cycle Count Monitor Function: The CYcle (CY) Command
Use the CYcle command to determine the number of cycles in a program that has been run. The
number of cycles is obtained using the values described in the "7900 Software Manual".
11
P D 7 9 S I M U s e r ’s M a n u a l
4 PD79SIM Input and Output Files
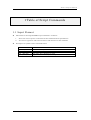
4.1 Input Files
PD79SIM processes the following input files.
4.1.1 IEEE-695 Absolute Format Files
The IEEE-695 absolute format files contain debugging information such as data on the variables used
in the source files as well as line data, and machine language data. These files, which are generated
by the nc79 C compiler, as79 relocatable macro assembler, and ln79 linkage editor, take the attribute
".x79".
4.1.2 Intel HEX-format Files
The Intel HEX-format files store machine language data. These files, which are generated by the
lmc79 load module converter supplied with the as79 relocatable assembler, take the attribute ".hex"
(they are converted from IEEE-695 absolute-format files).
4.1.3 Motorola S-format Files
The Motorola S-format files contain machine language data. These files, which are generated by the
lmc79 load module converter supplied with the as79 relocatable assembler, take the attribute
".mot"(they are converted from IEEE-695 absolute-format files).
4.1.4 Register Information File
The register information file, which is named “PD79SIM.rdf”, contains information of MCU
registers(register name and size, etc.).
PD79SIM automatically reads this file and uses the information to display the register window (The
register window does not open if this file does not exist).
This file is supplied with PD79SIM. The user cannot edit it.
4.1.5 Script File
The script file is for automatic execution of script commands. This file, which is read from the Script
Window, takes the attribute ".scr".
4.1.6 Help File
The help file contains help messages for PD79SIM. This file, which is supplied with PD79SIM, takes the
attribute ".hlp".
12
PD79SIM I n p u t a n d O u t p u t F i l e s
4.1.7 Environmental Setup File
The environmental setup file, which is automatically generated by PD79SIM and cannot be directly
created or edited by the user, stores information about the environmental setup of PD79SIM. The
filename is pd79sim.ini and sim79.ini. The environmental setup file is saved to the Windows
directory (the directory in which you have installed Windows).
4.1.8 MCU File
This file contains the information inherent to the target MCU. The MCU file is included with
product. The file name is M379xx.MCU.
4.1.9 Coverage Measurement Information File
This is a binary file that contains the results of coverage measurements. The file attribute is ".cov."
This file can be saved and loaded from and into the coverage window.
4.1.10 ASM Watch Point Data File
The ASM watch point data file contains data on the ASM watch point that is input from the ASM
Watch window. The file extension is “.wpt” and the file itself can be read from the ASM Watch
window.
4.1.11 C Watch Point Data File
The C watch point data file, which is created automatically by PD79SIM, stores information on the C
watch points recorded in the C Watch Window. The file attribute is ".cwp". This file is stored in the
Windows directory (the directory in which you installed Windows). It cannot be created or edited by
the user.
4.1.12 Software Breakpoint File
The software breakpoint file, which takes the suffix ".brk", contains the software breakpoint settings.
You can read in this file via the S/W Breakpoint dialog box to set the software breakpoints.
4.1.13 I/O Script File
This file contains a description of virtual port inputs and virtual interrupts.
file is read from the I/O Window. The file attribute is ".scr".
The created I/O script
4.1.14 GUI Input File
This file contains definitions of the key panel created in the GUI input window that have been saved
to a file. The file attribute is ".btn."
By reading this file from the GUI input window, you can set up the panel key you've created newly
again.
4.1.15 GUI Output File
This file contains definitions of the output panel created in the GUI output window that have been
saved to a file. The file attribute is ".gof."
By reading this file from the GUI output window, you can set up the output panel you've created
newly again.
13
P D 7 9 S I M U s e r ’s M a n u a l
4.2 Output Files
PD79SIM outputs the following files.
4.2.1 Intel HEX-format Files
The Intel HEX-format files store machine language data. These files, which are saved using
PD79SIM's upload function, take the attribute ".hex". Files saved in the Intel HEX format can be
downloaded by PD79SIM.
4.2.2 Motorola S-format Files
The Motorola S-format files contain machine language data. These files, which are saved using
PD79SIM's upload function, take the attribute ".mot". Files saved in the Motorola S-format can be
downloaded by PD79SIM.
4.2.3 Disassemble Files
Disassemble files store the results of disassembling program memory. These files, which are
reference text files, take the attribute ".txt". Disassemble files cannot be reassembled or downloaded.
4.2.4 Log File
The log file is a text file containing the results of executing the script commands. This file, which
takes the attribute ".log", contains the results from the logon point to the logoff point.
4.2.5 View File
The view file is a text file that contains the contents of the script window. In PD79SIM, the last 1000
lines of the results of executing the script commands are stored in the view buffer. The view file,
which takes the attribute ".viw", contains the contents of the view buffer.
4.2.6 Coverage Measurement Information File
This is a binary file that contains the results of coverage measurements. The file attribute is ".cov."
This file can be saved and loaded from and into the coverage window.
4.2.7 ASM Watch Point Data File
The ASM watch point data file contains data on the ASM watch point that is input from the ASM
Watch window. The file extension is “.wpt” and the file itself can be read from the ASM Watch
window.
4.2.8 Software Breakpoint File
The software breakpoint file, which takes the suffix ".brk", contains the software breakpoint settings.
You can save this file via the S/W Breakpoint dialog box to set the software breakpoints.
14
PD79SIM I n p u t a n d O u t p u t F i l e s
4.2.9 I/O Script File
This file contains definitions of virtual port inputs and virtual interrupts set or created in the I/O
Window that have been saved to a file.
4.2.10 GUI Input File
This file contains definitions of the key panel created in the GUI input window that have been saved
to a file. The file attribute is ".btn."
This file is saved from the GUI input window.
4.2.11 GUI Output File
This file contains definitions of the output panel created in the GUI output window that have been
saved to a file. The file attribute is ".gof."
This file is saved from the GUI output window.
4.2.12 Virtual Port Output File
This file contains the results of virtual port outputs specified in the I/O Window that have been saved
to a file.
This file is referenced by PD79SIM when it displays the results of virtual port outputs in the I/O
Window.
4.3 Temporary Files
4.3.1 Files Created When Using On-Demand Method
A temporary file is created when you specify on-demand reading of debugging information when
downloading a target program. Temporary files are created with the filename pdb_xxxx.tmp (where
xxxx is a 4-digit hexadecimal value) in the directory containing the downloaded files. Temporary files
are deleted immediately prior to downloading and when you quit PD79SIM.
4.3.2 Files Created in I/O Window
Temporary files are created when you set virtual port inputs or virtual interrupts or I/O script files in
the I/O Window. PD79SIM creates these temporary files in the directory in the files that contain
virtual port input or virtual interrupt settings are stored or the directory in which the I/O script files
are stored. Therefore, unless these directories are permitted for access, an error may occur when an
attempt is made to read files from the directory using the I/O Window menus [Option] −> [Load].
15
P D 7 9 S I M U s e r ’s M a n u a l
[ MEMO ]
16
Setup
17
18
Setup
1 Setup
1.1 Installation
See the Release Notes provided with the product for how to install PD79SIM .
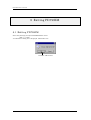
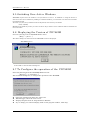
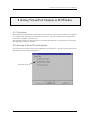
1.2 Starting PD79SIM
Click the start button, then select
program (P)-> [ RENESAS - TOOLS ] -> [ PD79SIM V.X.XX Release X ] -> [ PD79SIM ]
This operation starts pd79sim (the simulator debugger front end), and simultaneously starts sim79
(the simulator engine). If sim79 is already running, only pd79sim starts.
19
P D 7 9 S I M U s e r ’s M a n u a l
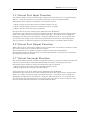
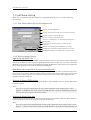
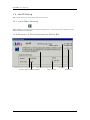
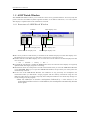
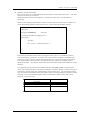
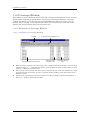
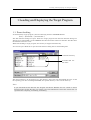
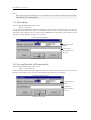
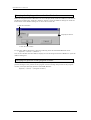
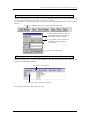
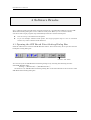
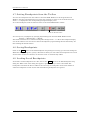
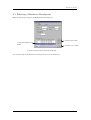
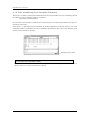
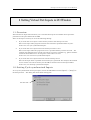
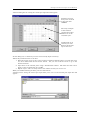
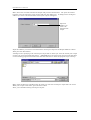
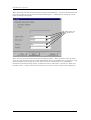
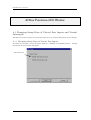
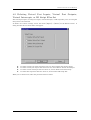
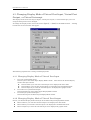
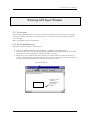
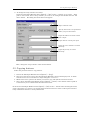
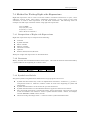
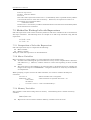
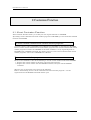
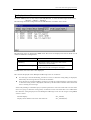
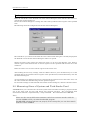
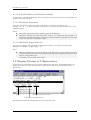
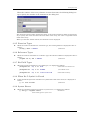
1.3 pd79sim Setup
When you start pd79sim, the Init dialog box is displayed, allowing you to set up the operating
environment.
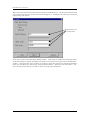
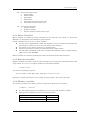
1.3.1 Init Dialog Box Screen Configuration
Area for specifying MCU file
Area for specifying script file to be executed at startup
Area for setting of default tab value
Area for setting og default font size
Selection of “On Memory” or “On Demand” methods of
downloading
Area to set the directory where a temporary file
is created
Switches of Init dialog box ON/OFF of restarting
ON/OFF of an automatic download function at restart
ON/OFF switching of an ending-state resume function
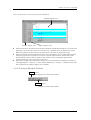
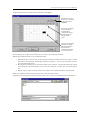
1.3.2 Environment Setup
Specifying the MCU file
Specify the MCU file for the target MCU. Click the "Refer" button to open the file selection dialog box
and select the MCU file. When the corresponding MCU file does not exist, it is necessary to make the
MCU file newly. Please refer to item “Method of making the MCU file” of the release note appended to
this product package for the method of making the MCU file.
Specifying the script file to be executed at startup
Specify a script file if you want to execute script commands at startup. These commands must have
been saved as a script file. Click the "Refer" button to open the file selection dialog box, then use the
mouse to select the script file to be executed at startup. The selected script file is displayed after
InitFile: in the Init dialog box.
Setting of default TAB values
Specify the default tab values for the Program Window, Source Window. You can specify TAB values
between 1 and 32.
Note:
You can set the tabs independently in each window. With the target window active, select
[Option] -> [TAB] from the menu in the PD79SIM Window to open the TAB Setting dialog box.
You can now set the tabs for the active window.
Setting of default font size
pd79sim Specify the default font for the characters displayed by pd79sim. Click the "Font" button to
open the Font dialog box, then specify the font and the font size.
Note:
You can set the font size independently in each window. With the target window active, select
[Option] −> [Font] from the menu in the PD79SIM Window to open the Font Setting dialog box.
20
Setup
You can now set the font size for the active window.
Selection of “On Memory” or “On Demand” method of downloading
This selection determines whether the debugging information is fetched using the "On Memory" or
"On Demand" method when a target program has been downloaded. When you select "On Memory",
all the debugging information is stored in memory. When you select "On Demand", a temporary file is
created when you download the target program, and the required debugging information is read from
that file into memory as it is required.
When you select [Environ] −> [Init] from the PD79SIM and select "On Memory" or "On Demand" from
the Init dialog box, the specified method is valid from the next time you download a target program.
Specifying temporary directory in on-demand mode
PD79SIM creates a temporary file when the target program has been downloaded using the ondemand method. This temporary file is created in a specified directory. If no directory is specified,
the temporary file is created in the directory where the downloaded file exists.
Switches of Init dialog box ON/OFF of restarting
Specify whether the Init dialog box should be opened when restarting PD79SIM . Check "Next Hide"
to stop the Init dialog box being opened when you next start pd79sim. If you want to display the Init
dialog box when you next start pd79sim, select [Init] −> [Environ] from the PD79SIM Window menu,
then uncheck "Next Hide" in the Init dialog box. You can also force the Init dialog box to be displayed
when you start up by pressing and holding the Ctrl key when starting pd79sim.
ON/OFF of Ending-State Resume Function
Specify whether or not you want PD79SIM to be started up in its previously terminated window
display state. If you check Resume check box, PD79SIM starts up in the same window display state
as it was terminated previously.
Automatic Download Function at Restart
Specify whether or not you want the last target program previously loaded into the simulator to be
loaded again when starting up PD79SIM . If you check AutoLoad check box, the target program is
automatically loaded when PD79SIM starts up.
21
PD79SIM U s e r ’s Manual
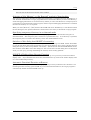
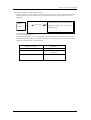
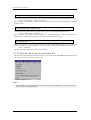
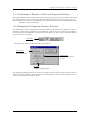
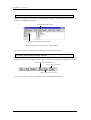
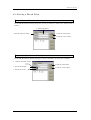
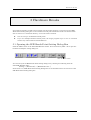
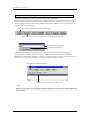
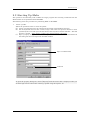
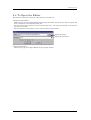
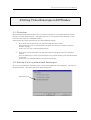
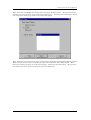
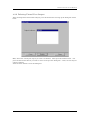
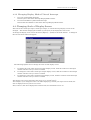
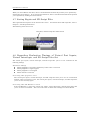
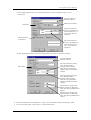
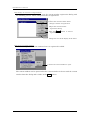
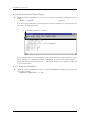
1.4 sim79 Setup
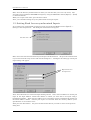
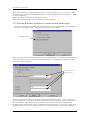
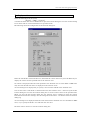
When sim79 starts up, it is registered in the system tray.
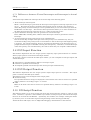
1.4.1 sim79 When Running
Right-clicking on the running sim79 and selecting [Version…] from the menu bar will open up the
Version Information dialog box.
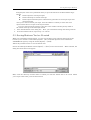
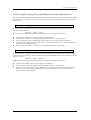
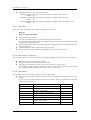
1.4.2 Structure of Version Information Dialog Box
Communication connection status
sim79 version information
Auto exit switch
Simulator MCU Status(RUN/STOP)
22
OK button
Exit button
Setup
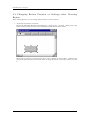
1.4.3 Setting Up
Auto Exit Switch Setting
Check the Auto exit checkbox to automatically exit sim79 when you exit pd79sim.
Communications Connection Status
CONNECT is displayed when connected to pd79sim. CUT is displayed when there is no connection.
Simulator MCU Status(RUN/STOP)
RUN is displayed when the simulator MCU is running, STOP when stopped.
OK button
Closes the Version Information dialog box.
Exit button
Exits sim79. Note that you cannot exit sim79 while connected to pd79sim.
23
P D 7 9 S I M U s e r ’s M a n u a l
[ MEMO ]
24
Window function
25
26
Window function of PD79SIM
1 Window function of PD79SIM
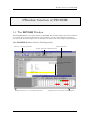
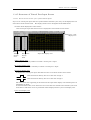
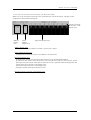
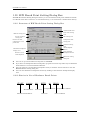
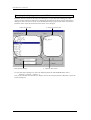
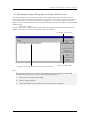
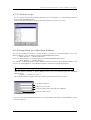
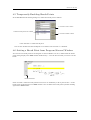
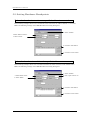
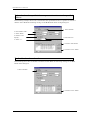
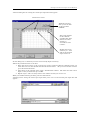
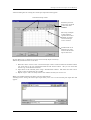
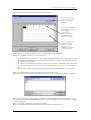
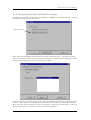
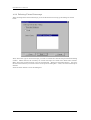
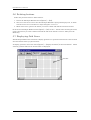
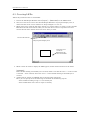
1.1 The PD79SIM Window
The PD79SIM Window is the main window for PD79SIM. This window displays the main commands
on a toolbar. You can click on the buttons on this toolbar to run the target program in normal or
one-step mode. The main display area accommodates windows such as the Target Program Window.
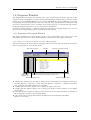
1.1.1 PD79SIM Window Screen Configuration
Menu for executing commands
Main display area
Toolbar with main command buttons
Sub windows
Displays help on how to use windows and menus
Displays status of execution of target program
27
P D 7 9 S I M U s e r ’s M a n u a l
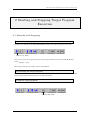
1.1.2 PD79SIM Window Toolbar
Go button
Executes target program
Step button
One-step execution
of target program
Break button
Sets the position of the cursor
in the window as the software
breakpoint
SW button
Sets a software
breakpoint
Return button
Runs the program up
to the higher routine
Stop button
Com button
eExecutes the target program
Stops execution of the
HW button
target program
from the value in the program
Sets
a hardware
counter to the position of the
breakpoint
cursor in the window
Over button
Reset button
Step over
Resets
the target program
function/subroutine call
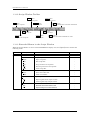
1.1.3 PD79SIM Window Menu
The menus in the PD79SIM Window can be classified as basic menus and extended menus.
Edit menu
File m enu
Environment menu
View menu
Debugging menu
(optional item s )
Debugging menu
(basic debugging)
Optional Window menu
W indow menu
Basic Menus and Extended Menus
The sub-menu items of the optional menus in PD79SIM automatically change according to which
window is active in the main display area of the PD79SIM window. The optional menus are called
extension menus.
In contrast, the items on all menus other than the optional menus remain the same no matter which
window is active. These are called basic menus, and provide the items for the basic operation of
PD79SIM and debugging.
Below, we look at the functions of each item on the basic menus. The functions of the items on the
extended menus are described under the respective windows.
28
Help menu
Window function of PD79SIM
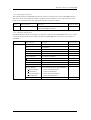
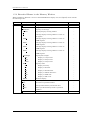
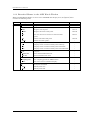
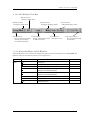
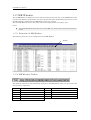
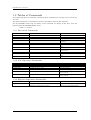
1.1.3.1 File operation
The [File] menu in PD79SIM contains the items required for file operation such as including files,
saving files, and terminating PD79SIM.
Menu
Menu options
Function
File
Download
Download target program.
Load Module...
Shortcut keys
Download machine language data and
-Shift + F.1
debugging information.
Memory Image...
Download only machine language data.
--
Symbol...
Download only debugging information.
--
Reload
Reload target program.
−
Upload...
Upload target program.
--
AutoDownLoad…
Automatically download when the target
program is updated.
−
Save Disasm...
Save disassembly result.
--
File Name
List the file name of target program downloaded.
−
Exit
Terminate PD79SIM.
--
1.1.3.2 Editing
The [Edit] menu in PD79SIM contains the items required for editing operation such as character
strings copy, paste, and search.
Menu
Menu options
Function
Shortcut keys
Edit
Copy
Copy character strings specified to clipboard.
Ctrl + C
Paste
Paste character strings of clipboard.
Ctrl + V
Find...
Find character strings.
--
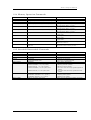
1.1.3.3 Display
The [View] menu in PD79SIM contains the items required for switching display of the tool bar and
status bar.
Menu
Menu options
Function
Shortcut keys
View
Tool Bar
Switch display or non-display of tool bar.
--
Status Bar
Switch display or non-display of status bar.
--
29
P D 7 9 S I M U s e r ’s M a n u a l
1.1.3.4 Setup
The [Environ] menu in PD79SIM contains the items required for setting up the operating
environment.
Menu
Menu options
Function
Shortcut keys
Environ
Init...
Environment setup
--
Path...
Source file search path
--
Start Up...
Startup function settings
--
Customize...
Open Customize dialog box.
−
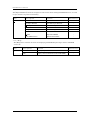
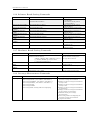
1.1.3.5 Debugging (Basic)
The [Debug] menu in PD79SIM contains the items for basic debugging such as starting and stopping
and one-step execution of the target program.
Menu
Menu options
Function
Shortcut keys
Debug
Go
Start target program.
Go
Run from current program counter.
Go Option...
Run from specified address.
GoFree
Free-run target program.
Come
Run to cursor position.
Step
Step execution.
Step
Execute one step.
Step Option...
Execute specified No. of steps.
Over
Over-step execution.
Over
Execute one over-step.
Over Option...
Execute specified No. of over-steps.
Return
Execute until return from current subroutine.
Break Point
Set break point.
−
F.1
−
−
F.2
−
F.3
−
−
F.4
−
F.5
−
S/W Break Point...
Open S/W Break Point Setting dialog box.
F.7
H/W Break Point...
Open H/W Break Point Setting dialog box.
Shift + F.7
Break
Set/cancel software break at cursor.
−
Reset
Reset target program.
F.8
Stop
Stop target program.
−
Scope…
Open Scope Setting dialog box
−
Entry…
Entry makefile
−
Make
Make target program
−
30
Window function of PD79SIM
1.1.3.6 Debugging (Option)
The extended menus in PD79SIM contains the items for operating the various PD79SIM windows.
The items on the extended menus differ according to which window is active. The functions of the
items on the extended menus are described under the respective windows.
Menu
Menu options
Option
Function
Shortcut keys
(This menu contains the extended menus for the
various PD79SIM windows.)
--
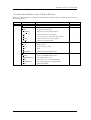
1.1.3.7 Window Operations
The [BasicWindow] menu has assigned to it the menus which among PD79SIM functions, are used to
control the display mode of each window provided by PD79SIM and to open the basic windows of
PD79SIM.
Menu
Menu options
Function
Shortcut keys
BasicWindow
Cascade
Cascade windows.
−
Tile
Tile windows.
−
Arrange Icon
Arrange icons.
−
Program Window
Make Program Window active.
−
Source Window
Open Source Window.
−
Register Window
Open Register Window.
−
Memory Window
Open Memory Window.
−
Dump Window
Open Dump Window.
−
RAM Monitor Window
Open RAM Monitor Window.
−
ASM Watch Window
Open ASM Watch Window.
−
C Watch Window
Open C (language-level) Watch Window.
−
C Watch Window
Open C Watch Window.
−
Local Window
Open Local Window.
−
File Local Window
Open File Local Window.
−
Global Window
Open Global Window.
−
Script Window
Open Script Window.
31
−
P D 7 9 S I M U s e r ’s M a n u a l
The [OptionalWindow] menu has assigned to it the menus which among PD79SIM functions, are used
to open windows of greater functionality.
Menu
Menu options
Function
Shortcut keys
Open IO Window.
−
GUI Input Window
Open GUI input Window.
−
GUI Output Window
Open GUI Output Window.
−
MR Window
Open MR Window.
−
Coverage Window
Open Coverage Window.
−
OptionalWindow IO Window
−
Custom Window
Option
Entry Custom Window
−
User definition menu
Open the custom window
−
1.1.3.8 Help
The [Help] menu contains the items for displaying PD79SIM help messages and the PD79SIM
version No.
Menu
Menu options
Function
Shortcut keys
Help
Index
Display help.
−
About...
Display version information about PD79SIM.
−
32
Window function of PD79SIM
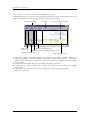
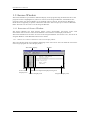
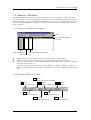
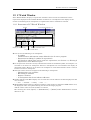
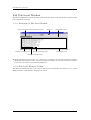
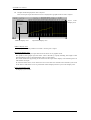
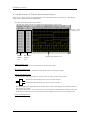
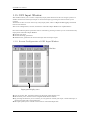
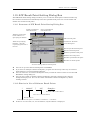
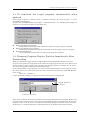
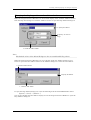
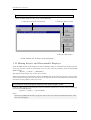
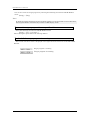
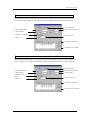
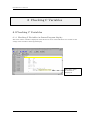
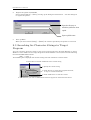
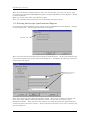
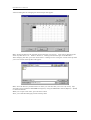
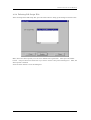
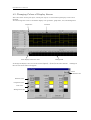
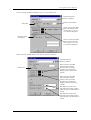
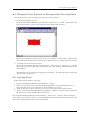
1.2 Program Window
The Program Window displays the machine code at the current program counter. The line at the
program counter is highlighted in yellow. The Program Window is automatically opened in the main
display area of the PD79SIM Window when you start PD79SIM. The Program Window can be used
for executing the target program up to the cursor position, set or cancel software breakpoints using
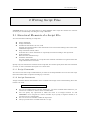
the mouse, and displaying reverse assembles of the target program, etc. Double-click the software
breakpoint display/setting area to set or cancel software breakpoints.
By choosing menus [Option] −> [Line Assemble] after clicking on a program display area, you can
perform line assemble beginning with the position you have clicked.
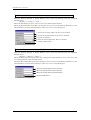
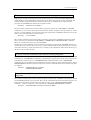
1.2.1 Structure of Program Window
The Program Window has three display modes: source, disassemble, and mixes source with
disassemble. The structure of the Program Window is described for each display mode below.
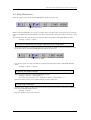
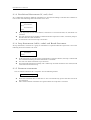
1.2.1.1 Structure of Program Window in Source Display Mode
The source display mode is provided for debugging at the source level. You can check the source files
of the target program in source display mode.
File name display
Source line
display area
Toolbar
Current program counter
Software breakpoint display/setting area
Program display area
Address display area
The line No. display area and address display area can be displayed or hidden by selecting or
canceling [Option] −> [Layout] −> [Line Area] and [Option] −> [Layout] −> [Address Area]. Note
that, by default, the address display area is hidden.
l Double-click the line No. display area to change the display source file.
l Double-click the address display area to change the display starting address or the display
starting line.
l The value of the C variable is displayed, when the mouse cursor stand still (about 0.5 seconds) on
the strings of the variable in the Program display.
l The result of the Coverage measurement is displayed by selecting [On] in the Menu
[Option] -> [Coverage].
l
33
P D 7 9 S I M U s e r ’s M a n u a l
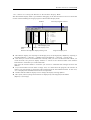
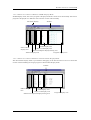
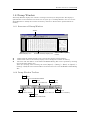
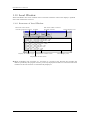
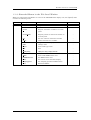
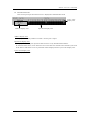
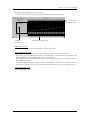
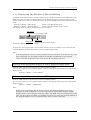
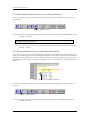
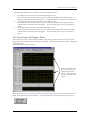
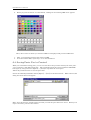
1.2.1.2 Structure of Program Window in MIX Display Mode
In MIX display mode, the source program is displayed with the results of its disassembly. The source
program is displayed in a different color from the results of disassembly.
File name display
Source line
display area
Toolbar
Current program counter
Object code display area
Software breakpoint display/setting area
Address display area
Program display area
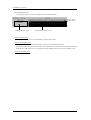
The line No. display area, address display area, and object code display area can be displayed or
hidden by selecting or canceling [Option] −> [Layout] −> [Line Area], [Option] −> [Layout] −>
[Address Area], and [Option] −> [Layout] −> [Code Area]. Note that, by default, the address display
area is hidden.
l Double-click the line No. display area to change the display source file.
l Double-click the address display area to change the display starting address or the display
starting line.
l The result of the Coverage measurement is displayed by selecting [On] in the Menu
[Option] -> [Coverage].
l
34
Window function of PD79SIM
1.2.1.3 Structure of Program Window in Disassemble Display Mode
The disassemble display mode is provided for debugging at the instruction level. You can check the
results of disassembling the target program in disassemble display mode.
Toolbar
Current program counter
Label display area
Address display
Object code display area
area
Software breakpoint display/setting area
l
l
l
l
l
Program display area
The address display area and object code display area can be displayed or hidden by selecting or
canceling [Option] −> [Layout] −> [Address Area] and [Option] −> [Layout] −> [Code Area].
Note that you cannot scroll backwards vertically until you have scrolled forwards. When you
scroll forwards, the previous display address is stored in the internal buffer. This address
information is used when you scroll backwards.
Note that the internal buffer is cleared if you execute a command that changes the first line
address.
If you disassemble an area (data or empty area, etc.) other than the program, the contents of
memory are interpreted as instruction code and displayed in disassembled format. In this case,
"???" is displayed for undefined instructions and operands.
Double-click the address display area to change the display starting address.
The result of the Coverage measurement is displayed by selecting [On] in the Menu
[Option] -> [Coverage].
35
P D 7 9 S I M U s e r ’s M a n u a l
1.2.2 Shortcut Menus of the Program Window
When you click the right mouse button in the Program Window, the shortcut menu opens. And you
can display the source file that contains the selected function, or you can register the selected variable
as C watch point.
Menu
Menu options
Function
Shortcut keys
Display the selected function
−
Open Source Window
Open Source Window Display the selected function
(opening the new Source Window)
−
Add C Watch…
Register the C watch point of the selected variable
−
Add C Watch Pointer…
Register the C watch point of the selected variable's pointer.
−
Add ASM Watch…
Register the ASM watch point of the selected symbol.
−
BitAdd ASM Watch…
Register the ASM watch point of the selected bit symbol.
−
Open Editor
Open the source file by the editor.
−
Entry Editor…
Register the editor to open the source files.
−
Line Assemble…
Open the Line Assemble Dialog Box.
−
Right Clicking Jump to function
1.2.3 Program Window Toolbar
SRC button
Displays the program in source mode.
MIX button
Displays the program in MIX mode.
DIS button
Displays the program in disassemble mode.
View button
Changes the part of the program being displayed.
You can specify a source file, a function, an address, or the position of
the program counter.
36
Window function of PD79SIM
1.2.4 Extended menu in the Program Window
When the Program Window is active in the PD79SIM main display area, the [Option] menu contains
the following items:
Menu
Menu options
Function
Shortcut keys
Option
Font...
Change font.
−
TAB...
Set source file display tabs.
−
Color...
Change display color
−
View
Change contents of display.
−
Source...
Display from specified source file or function.
−
Address...
Display from specified address or line No.
−
Program Counter
Display from current program counter.
−
Mode
Switch display mode.
−
Source mode
Switch to source display mode.
Ctrl + R
Mix mode
Switch to MIX display mode.
Ctrl + R
Disasm mode
Switch to disassemble display mode.
Ctrl + R
Layout
−
Set layout.
Line Area
Turn on/off line No. area.
−
Address Area
Turn on/off address area.
−
Code Area
Turn on/off object code area.
−
Line Assemble...
Open Line Assemble dialog.
Coverage
Set Coverage measurement .
Ctrl + L
−
On/Off
Turn on/off Measurement result.
−
Clear
Initialize coverage measurement result
−
Refresh
Update display of coverage measurement result
−
37
P D 7 9 S I M U s e r ’s M a n u a l
1.3 Source Window
The Source Window is provided for dedicated display of the program being checked. The line at the
program counter is highlighted in yellow. In contrast to the Program Window, which follows the
program counter, the Source Window is not updated until you specify. Use the Source Window to
check what is happening in specific subroutines and tasks. You can open up to 10 Source Windows.
Other functions are the same as in the Program Window.
1.3.1 Structure of Source Window
The Source Window has three display modes: source, disassemble, and mixes source with
disassemble. The structure of the Source Window is described for each display mode below.
The Source Window has the same structure as the Program Window. See Section 1.2.1, "Structure of
Program Window" under Window Functions for details.
1.3.1.1 Structure of Source Window in Source Display Mode
The source display mode is provided for debugging at the source level. You can check the source files
of the target program in source display mode.
Toolbar
File name display
Source line
display area
Software breakpoint display/setting area
Address display area
Program display area
38
Window function of PD79SIM
1.3.1.2 Structure of Source Window in MIX Display Mode
In MIX display mode, the source program is displayed with the results of its disassembly. The source
program is displayed in a different color from the results of disassembly.
File name display
Toolbar
Label display area
Source line
display area
Object code display area
Software breakpoint display/setting area
Address display area
Program display area
1.3.1.3 Structure of Source Window in Disassemble Display Mode
The disassemble display mode is provided for debugging at the instruction level. You can check the
results of disassembling the target program in disassemble display mode.
Toolbar
Address display
area
Label display area
Object code display area
Software breakpoint display/setting area
39
Program display area
P D 7 9 S I M U s e r ’s M a n u a l
1.3.2 Shortcut menus in the Source Window
The Source Window shortcut menus is similar to that of the Program Window. See Section 1.2.2, "
Shortcut Menus of the Program Window" under Window Functions for details.
1.3.3 Source Window Toolbar
The Source Window toolbar is the same as that in the Program Window. See Section 1.2.3, "Program
Window Toolbar" under Window Functions for details.
1.3.4 Extended Menus in the Source Window
When the Source Window is active in the PD79SIM main display area, extended menus for the Source
Window are allocated to the [Option] menus. The extended menus of the Source Window are identical
to those of the Program Window. See Section 1.2.4, "Extended menu in the Program Window" under
Window Functions for details.
40
Window function of PD79SIM
1.4 Register Window
The Register Window shows the contents of the registers and flags. The display is updated after each
command is executed. You can click the buttons corresponding to registers in the Register Window to
quickly change the values of the registers and flags.
1.4.1 Structure of Register Window
Register names
The value of the registers
Radix of the values
Register Display Area
You double-click to
change register
values. Display the
shot-cut menu when
clicked the right
button of the mouse.
Flag display area
You can click
these buttons to
change flag.
1.4.2
Extended Menus in the Register Window
When the Register Window is active in the PD79SIM main display area, the [Option] menu contains
the following items:
Menu
Menu options
Function
Shortcut keys
Option
Hide DPR1-3
Turn on/off DPR1-3 registers display area.
−
Layout
Set layout
−
Hide Radix
Turn on/off radix.
−
Hide FLAGs
Turn on/off flags display area.
−
Font...
−
Change font.
41
P D 7 9 S I M U s e r ’s M a n u a l
1.4.3 Shortcut Menu of the Register Window
Press the right button of the mouse on the register display area in Register Window to display
shortcut menu.
Menu
Menu options
Function
Right click
Hex
Display in hexadecimal.
−
Dec
Display in decimal.
−
Bin
Display in binary.
−
Hide DPR1-3
Turn on/off DPR1-3 registers display area.
−
Layout
Set layout.
−
Hide Radix
Turn on/off radix.
−
Hide FLAGs
Turn on/off flags display area.
−
Font...
l
Shortcut keys
−
Change font.
The value changed is displayed in red.
42
Window function of PD79SIM
1.5 Memory Window
The Memory Window displays the contents of contiguous memory in "address", "label", and "data
(contents of memory)" formats. The display is updated after each command is executed. Data can be
displayed in binary, decimal, hexadecimal, and ASCII. You can open up to 10 Memory Windows. You
can use the Memory Windows to modify the contents of memory, and also to fill and move specified
blocks of memory.
1.5.1 Structure of Memory Window
Toolbar
Displayed when the address
is S or DPR
Address display area
Contents of memory display area
Label display area
l
l
l
Double-click the address display area to change the display starting address.
Double-click a label or the memory display area to change the contents of memory.
The start and end address in the FILL and MOVE Dialog Box can be specified by selecting
data in the data display area.
After the selecting, when selecting the menu [Option] -> [Debug] -> [Move] or [Option] ->
[Debug] -> [Fill],the start and end address of selected area are set in the MOVE or FILL Dialog
Box.
1.5.2 Memory Window Toolbar
Hex button
Displays data in hexadecimal (default)
Bin button
Displays data in binary
Dec button
Displays data in decimal
SJIS button
Displays data in SJIS code
Refresh button
Refresh display.
JIS button
Displays data in JIS code
ASCII button
Displays data in ASCII code
43
Cache button
Use the cache of memory
P D 7 9 S I M U s e r ’s M a n u a l
1.5.3 Extended Menus in the Memory Window
When the Memory Window is active in the PD79SIM main display area, the [Option] menu contains
the following items:
Menu
Menu options
Function
Shortcut keys
Option
Font...
Change font.
--
View
Change contents of display.
--
Scroll Area...
Specify scroll range.
--
Address...
Specify display starting address.
--
S
Change display starting address to value of
--
S register.
DPR0
Change display starting address to value of
--
DPR0 register.
DPR1
Change display starting address to value of
DPR2
Change display starting address to value of
--
DPR1 register.
--
DPR2 register.
DPR3
Change display starting address to value of
--
DPR3 register.
Data Length
Specify data length.
--
Byte
Display in 1-byte units.
--
Word
Display in 2-byte units.
--
Dword
Display in 4-byte units.
--
Radix
Specify radix.
--
Bin
Display in binary.
--
Dec
Display in decimal.
--
Hex
Display in hexadecimal.
--
Ascii
Display as ASCII characters.
--
SJIS
Display as SJIS code.
−
JIS
Display as JIS ccode.
−
Refresh
Debug
Refresh display.
--
Set memory contents.
--
Set...
Set data at specified address.
--
Fill...
Fill specified memory block with data.
--
Move...
Move specified memory block to specified
--
address.
Cache On
Use the cache of memory
44
−
Window function of PD79SIM
1.6 Dump Window
The Dump Window displays the contents of contiguous memory in dump format. The display is
updated after each command is executed. You can open up to 10 Dump Windows. You can use the
Dump Windows to modify the contents of memory, and also to fill and move specified blocks of
memory.
1.6.1 Structure of Dump Window
Toolbar
Address display area
l
l
l
Contents of memory display area
ASCII code corresponding
to data
Double-click the address display area to change the display starting address.
Double-click a label or the memory display area to change the contents of memory.
The start and end address in the FILL and MOVE Dialog Box can be specified by selecting
data in the data display area.
After the selecting, when selecting the menu [Option] -> [Debug] -> [Move] or [Option] ->
[Debug] -> [Fill],the start and end address of selected area are set in the MOVE or FILL Dialog
Box.
1.6.2 Dump Window Toolbar
Hex button
Displays data in hexadecimal (default)
SJIS button
Displays data in SJIS code
Dec button
Displays data in decimal
Refresh button
Refresh display.
JIS button
Displays data in JIS code
ASCII button
Displays data in ASCII code
45
Cache button
Use the cache of memory
P D 7 9 S I M U s e r ’s M a n u a l
1.6.3 Extended Menus in the Dump Window
When the Dump Window is active in the PD79SIM main display area, the [Option] menu contains the
following items:
Menu
Menu options
Function
Shortcut keys
Option
Font...
Change font.
--
View
Change contents of display.
--
Scroll Area...
Specify scroll range.
--
Address...
Specify display starting address.
--
Data Length
Specify data length.
--
Byte
Display in 1-byte units.
--
Word
Display in 2-byte units.
--
Dword
Display in 4-byte units.
--
Radix
Specify radix.
--
Dec
Display in decimal.
--
Hex
Display in hexadecimal.
--
Ascii
Display as ASCII characters.
−
SJIS
Display as SJIS code.
−
JIS
Display as JIS code.
−
Refresh
Debug
Refresh display.
--
Set memory contents.
--
Set...
Set data at specified address.
--
Fill...
Fill specified memory block with data.
--
Move...
Move specified memory block to specified
--
address.
Cache On
Use the cache of memory
46
−
Window function of PD79SIM
1.7 RAM Monitor Window
The RAM Monitor Window displays the contents of memory in the RAM monitor area in dump format.
The display is updated at constant intervals (default = 100ms) during execution of the target program.
The PD79SIM have 1KB of RAM monitor memory area. You can set any contiguous address area as
the RAM monitor area.
1.7.1 Structure of RAM Monitor Window
Toolbar
Address display area
Data display area
ASCII code corresponding
to data
l Double-click the address display area to change the display starting address. If the specified
starting address is outside the RAM monitor area, the RAM monitor area also changes.
l The refresh rate during execution of the target program is displayed in the refresh rate display
area ("Address" is displayed when the target program is not running). Note that, due to the
operating conditions, the refresh rate may be slightly slower than that specified. The following
items have a great influence on the refresh rate:
– Performance of and load on the host computer
– Window size (amount of memory display)
– The number of rewrites required (the number of memory addresses at which values have
been changed)
l
The background color for the display of data and ASCII code changes according to the access
attribute, as follows (the background color is white if there is no access):
– Areas accessed by READ: Green
– Areas accessed by WRITE: Red
You can change the background color by selecting [Option] −> [Color]. The display of access
attributes is cleared (the addresses are displayed as if not accessed) when you select [Option] −>
[View] −> [Clear] and after downloading a target program.
47
P D 7 9 S I M U s e r ’s M a n u a l
Note:
l
The real-time RAM monitor function acquires the data of the bus access.
Therefore, changes in the RAM/SFR area without the access by the target program
are not reflected.
l
If you are displaying data in the RAM monitor area in 2-byte or 4-byte units (by selecting
Word or Dword under [Option] −> [View] −> [Data Length]), the memory access attribute
may differ for each of the bytes. If there are such mismatches in the access attributes
within one data item, the data item is displayed in parentheses, as shown below. Note that
the memory display background color is set to the color for the access attribute of the 1st
byte.
Display when access attribute is identical for all bytes of the data.
Display when access attributes are mismatched between
different bytes of the data.
1.7.2 RAM Monitor Window Toolbar
JIS button
Displays data in JIS code
Hex button
Displays data in hexadecimal (default)
Dec button
Displays data in decimal
SJIS button
Displays data in SJIS code
ASCII button
Displays data in ASCII code
Clear button
Clear access attribute.
Refresh button
Refresh display.
Area button
Set RAM monitor area.
48
Window function of PD79SIM
1.7.3 Extended Menus in the RAM Monitor Window
When the RAM Monitor Window is active in the PD79SIM main display area, the [Option] menu
contains the following items:
Menu
Menu options
Function
Shortcut keys
Option
Font...
Change font.
--
View
Change contents of display.
--
Address...
Display from specified address.
--
Data Length
Specify data length.
--
Byte
Display in 1-byte units.
--
Word
Display in 2-byte units.
--
Dword
Display in 4-byte units.
--
Radix
Specify radix.
--
Dec
Display in decimal.
Hex
Display in hexadecimal.
--
Ascii
Display as ASCII characters.
−
SJIS
Display as SJIS code.
−
Display as JIS code.
−
JIS
--
Refresh
Refresh display.
--
Clear
Clear access attribute.
--
Layout
Ascii
Set layout.
--
Turn on/off ASCII strings.
--
RAM Monitor Area...
Set RAM monitor area.
--
Color...
Set color of access attribute display.
--
Sampling period...
Set sampling period for RAM monitor.
--
49
P D 7 9 S I M U s e r ’s M a n u a l
1.8 ASM Watch Window
The ASM Watch Window allows you to check the values at any specified address. You can specify the
point to watch as an address (symbol or global variable), as an address and bit No., or as a bit symbol.
The display is updated after each command is executed.
1.8.1 Structure of ASM Watch Window
Data display area
Toolbar
Expression display area
Address/Bit No. display area
Radix display area
Data length display area
l The cursor position is indicated by a red mark in the address display area and data display area.
Click either area or use the “up” and “down” cursor keys to move the cursor.
l Double-click the radix (Rdx) display area to switch the current radix for the data displayed in that
area as follows:
−> hex −> decimal −> binary −> hex −>
l Provided the watchpoint is within the RAM monitor area, the contents of the display are regularly
updated while the target program is executing.
l Information about set watchpoints is stored in the Init file when you close the ASM Watch Window
or exit PD79SIM. When you re-open the ASM Watch Window, the previously set watch points are
automatically restored.
l In the case of the ASM Watch Window, the addresses of any previously set watchpoints are
recalculated when you download a target program and the memory referenced using the new
addresses. Thus there is no need to respecify the watchpoint addresses even when they change as a
result of changes in the program.
– When the addresses of inactive watchpoints (indicated by "--<not active>--") are
recalculated and the result is a valid address, the watchpoints automatically become
active again.
50
Window function of PD79SIM
1.8.2 ASM Watch Window Toolbar
Add button
Adds a watch point(address)
Dec button
Displays watch point in decimal
Set button
Sets specified watch point
Del button
Deletes specified watch point
Bin button
Displays watch point in binary
BitAdd button
Adds a watch point(bit)
Hex button
Displays watch point in hexadecimal
DelAll button
Deletes all watch points
51
P D 7 9 S I M U s e r ’s M a n u a l
1.8.3 Extended Menus in the ASM Watch Window
When the ASM Watch Window is active in the PD79SIM main display area, the [Option] menu
contains the following items:
Menu
Menu options
Function
Shortcut keys
Option
Font...
Change font.
Watch
Register / delete watch point.
---
Add...
Register watch point.
Ctrl + A
Bitadd...
Register bit-level watch point.
Ctrl + B
Set...
Set new data to be written to selected watch
Ctrl + S
point.
Del
Delete selected watch point.
DelAll
Delete all watch points.
Radix
Change display radix.
Ctrl + D
---
Bin
Display value at selected watch point in binary.
--
Dec
Display value at selected watch point in decimal.
--
Hex
Display value at selected watch point in hexadecimal.
--
Layout
Set layout.
--
Address Area
Turn on/off address/bit area.
--
Size Area
Turn on/off data size area.
--
RAM Monitor
Display RAM monitor.
--
Sampling period...
Set sampling period for RAM monitor.
--
Color...
Set color of access attribute display.
--
File
Watch point save/load.
--
Save…
Watch point save.
--
Load…
Watch point load.
--
52
Window function of PD79SIM
1.9 C Watch Window
The C Watch Window displays C expressions and their values (results of calculations). The C
expressions displayed in the C Watch Window are known as C watchpoints. The displays of the
results of calculating the C watchpoints are updated each time a command is executed.
1.9.1 Structure of C Watch Window
Toolbar
Display of variable type
C watch point display area
Dispaly of variable value
Dispaly of variable name
l You can use the following as C watchpoints:
– C symbols
Variable names and function names defined in the C source program.
– Expressions including C symbols (C expressions)
For details of tokens that can be used in C expressions, see Section 3.1, "Writing C
Expressions" in the Reference part.
l If a C expression cannot be correctly calculated (it includes an undefined symbol, for example), it is
recorded as an inactive C watchpoint. Inactive C watchpoints are not included in the display of
calculated results. However, if an inactive C watchpoint is recalculated and the result is valid, it
becomes an active C watchpoint.
l Note that values cannot be assigned in the following C watchpoints:
–
–
–
–
Floating point type variables
Bit field type variables
Register variables
C watchpoints that do not indicate addresses
l Double-click the radix (Rdx) display area to switch the current radix for the data displayed in that
area as follows:
... −> hex −> decimal −> binary −> hex −> ...
l When RAM monitor function is effective and the C watch points are within the RAM monitor area,
the displayed values are updated during execution of the target program.
And the values of the accessed variables are colored.
The selecting the menu [Option] -> [RAM Monitor] -> [Enable] makes RAM monitor function
effective or not.
53
P D 7 9 S I M U s e r ’s M a n u a l
l Information about set C watchpoints is stored in the C watchpoint information file when you close
the C Watch Window or exit PD79SIM. When you re-open the C Watch Window, previously set C
watchpoints are automatically restored.
– A C watchpoint information file is created for each loaded object file (and includes
information on the name of the loaded object file).
When you set a new C watchpoint, the program first searches for a C watchpoint
information file with information on a file with the same name as the currently
loaded object file. If an appropriate file is found, C watchpoints are restored from the
information in that file.
1.9.2 C Watch Window Toolbar
Set button
Sets specified C watch point
Add button
Del button
Adds a C watch point Deletes specified C watch point
Add* button
Adds a C watch point by pointer
Cancel button
Cancels specified C watch point
DelAll button
Delete all C watch points
Radix button
Switch of display cardinal number
l You can delete or set new values for C watchpoints selected by clicking in the C watchpoint display
area. You cannot delete only additional information such as the members of structures displayed
when recording C watchpoints.
l The addresses for pointers, etc., are displayed in hexadecimal regardless of the display radix. See
Section 3.2, "Display Format of C Expressions" in the Reference part for details of display formats.
54
Window function of PD79SIM
1.9.3 Extended Menus in the C Watch Window
When the C Watch Window is active in the PD79SIM main display area, the [Option] menu contains
the following items:
Menu
Menu options
Function
Shortcut keys
Option
Font...
Change font.
--
Watch
Register/delete C watch point.
--
Add...
Register C watch point.
--
Add Pointer...
Register C watch point (pointer).
--
Del
Delete selected C watch point.
--
Set...
Set new value for selected C watch point.
--
Cancel
Cancel selection of C watch point.
--
Del All
Delete all C watch points.
--
View
Change contents of display.
--
Radix
Change radix.
--
Layout
Turn on/off type name.
--
Sort
Sort.
--
Display String
Display the string / Display character.
−
RAM Monitor
Display RAM monitor.
−
Enable
Turn on/off RAM monitor area.
−
RAM Monitor Area...
Set RAM monitor area.
−
Color...
Set color of access attribute display.
−
Sampling period...
Set sampling period for RAM monitor.
−
Clear
Clear access attribute.
−
55
P D 7 9 S I M U s e r ’s M a n u a l
1.10 Local Window
The Local Window lists local variables in the C function with their values. The display is updated
after each command is executed.
1.10.1 Structure of Local Window
Function name which
contains program counter
Toolbar
Display of variable type
File name which contains
program counter
Dispaly of variable value
Scope display area
Data display area
Dispaly of variable name
l When performing step execution, etc., and there is a change in the function that includes the
address specified by the program counter, previously displayed variables are cleared and the local
variables in the new function are automatically displayed.
56
Window function of PD79SIM
1.10.2 Local Window Toolbar
Cwatch button
Adds specified variable name to C watch window
Set button
Sets specified watch point
Cwatch* button
Radix button
Switch of display cardinal number
Cancel button
Cancels specified watch point
Adds specified variable name to C watch window by pointer
l You can register variables selected by clicking in the data display area as C watchpoints in the C
Watch Window, or change their values. You can use C expressions to set the values. For details of
tokens that can be used in C expressions, see Section 3.1, "Writing C Expressions" in the Reference
part.
l The addresses for pointers, etc., are displayed in hexadecimal regardless of the display radix. See
Section 3.2, "Display Format of C Expressions" in the Reference part for details of display formats.
1.10.3 Extended Menus in the Local Window
When one of the Local Window is active in the PD79SIM main display area, the [Option] menu
contains the following items:
Menu
Menu options
Function
Option
Font...
Change font.
--
Watch
Operations related to C-function.
--
Cwatch
Shortcut keys
Register selected C variable as C watch
--
point.
Cwatch Pointer
Register pointer of selected C variable as
--
C watch point.
Set...
Set new value for selected C variable.
--
Cancel
Cancel selection of C variable.
--
View
Change contents of display.
--
Radix
Change radix.
--
Layout
Turn on/off type name.
--
Sort
Sort.
--
Display String
Display the string / Display character.
−
57
P D 7 9 S I M U s e r ’s M a n u a l
1.11 File Local Window
The File Local Window lists local variables in the C file with their values. The display is updated after
each command is executed.
1.11.1 Structure of File Local Window
File name which contains program counter
Display of variable type
Toolbar
Dispaly of variable value
Scope display area
Data display area
Dispaly of variable name
l When performing step execution, etc., and there is a change in the file that includes the address
specified by the program counter, previously displayed variables are cleared and the local variables
in the new source file are automatically displayed.
1.11.2 File Local Window Toolbar
The File Local Window toolbar is the same as that in the Local Window. See Section 1.10.2, "Local
Window Toolbar" under Window Functions for details.
58
Window function of PD79SIM
1.11.3 Extended Menus in the File Local Window
When one of the File Local Window is active in the PD79SIM main display area, the [Option] menu
contains the following items:
Menu
Menu options
Function
Option
Font...
Change font.
−
Watch
Operations related to C-function.
−
Cwatch
Shortcut keys
Register selected C variable as C watch
−
point.
Cwatch Pointer
Register pointer of selected C variable as
−
C watch point.
Set...
Set new value for selected C variable.
−
Cancel
Cancel selection of C variable.
−
View
Change contents of display.
−
−
Radix
Change radix.
Layout
Turn on/off type name.
Sort
Sort.
−
Display String
Display the string / Display character.
−
RAM Monitor
Display RAM monitor.
−
Enable
Turn on/off RAM monitor area.
−
RAM Monitor Area...
Set RAM monitor area.
−
Color...
Set color of access attribute display.
−
Sampling period...
Set sampling period for RAM monitor.
−
Clear
Clear access attribute.
−
59
P D 7 9 S I M U s e r ’s M a n u a l
1.12 Global Window
The Global Window lists C global variables and their values. The display is updated after each
command is executed.
1.12.1 Structure of Global Window
Mojule name
Toolbar
Scope display area
Display of variable name
Data display area
Display of variable type
Display of variable value
1.12.2 Global Window Toolbar
The Global Window toolbar is the same as that in the Local Window. See Section 1.10.2, "Local
Window Toolbar" under Window Functions for details.
1.12.3 Extended Menus in the Global Window
When the Global Window is active in the PD79SIM main display area, extended menus for the Global
Window are allocated to the [Option] menus. The extended menus of the Global Window are identical
to those of the Local Window. See Section 1.11.3, “Extended Menus in the File Local Window” under
Window Functions for details.
60
Window function of PD79SIM
1.13 Script Window
The Script Window displays the execution of text-format script commands and the results of that
execution. Script commands can be executed using a script file or interactively. You can also write
script commands in the script file so that they are automatically executed. The results of script
command execution can also be stored in a previously specified log file.
1.13.1 Structure of Script Window
Script file name display area
Toolbar
Log file name display area
Execution result display area
Command input area
Command history display area/Script file display area
l The Script Window has a view buffer that stores the results of executing the last 1000 lines. The
results of execution can therefore be stored in a file (view file) without specifying a log file.
l When a script file is opened, the command history area changes to become the script file display
area and displays the contents of the script file. When script files are nested, the contents of the
last opened script file are displayed. The script file display area shows the line currently being
executed in inverse vide.
l When a script file is open, you can invoke script commands from the command input area provided
the script file is not being executed.
l The Script Window can record the history of the executed commands to a file. This function is not
the same as the log function.
This function records not the result but only the executed commands, so the saved files can be used
as the script files.
61
P D 7 9 S I M U s e r ’s M a n u a l
1.13.2 Script Window Toolbar
Close button
Closes script file
Run button
Executes script file
LogOn button
Opens log file
Open button
Opens script file
Step button
Step executes script file
Clear button
Clears view buffer
RecOff button
Stop Recording the executed commands
View button
Saves view buffer
RecOn button
LogOff button
Closes log file
Record the executed commands to a file
1.13.3 Extended Menus in the Script Window
When the Script Window is active in the PD79SIM main display area, the [Option] menu contains the
following items:
Menu
Menu options
Function
Shortcut keys
Option
Font....
Change font.
--
Script
Script file operations.
--
Open...
Open script file.
--
Run
Run script file.
--
Stop
Stop execution of script file.
--
Step
One-step execution of script file.
--
Close
Close script file.
--
View
View buffer operations.
--
Save...
Save view buffer file.
--
Clear
Clear view buffer.
--
Log
Log file operations.
--
On...
Open log file (start output to file).
--
Off
Close log file (stop output to file).
--
Record
Record the executed commands.
−
On...
Record the executed commands to a file.
−
Off
Stop Recording the executed commands.
−
62
Window function of PD79SIM
1.14 I/O Window
This window is used to set and display virtual port input/outputs or virtual interrupts. Virtual port
inputs, virtual interrupt settings, and virtual port output results can be displayed for your reference
in numeric or graphic mode.
For details about virtual port input/outputs, and on how to set virtual interrupts, refer to "HIgh-end
Debugging" described later in this manual.
The functions, screen configuration, tool bar, and menus of the I/O Window are explained here.
l Up to a total of 20 virtual port inputs and virtual interrupts can be set. Up to 20 virtual port
outputs can be set.
1.14.1 Virtual Port Input
Virtual Port Input refers to a function that defines changes in the data that is input from external
sources to a specified memory address. Use of this function makes it possible to simulate data
inputs to the ports defined in the SFR.
The defined input data can be referenced by displaying it in chart, numeric (hexadecimal), or graphic
mode.
There are following three types of virtual port inputs:
(1)
Cycle synchronized input
The input data can be written to memory when program execution has reached a specified
number of cycles. The data size that can be input is one byte.
The diagram below shows an example of a virtual port input that is synchronized to machine
cycles.
Example where data is input to address 2
Data 20 is input in
Data FF is input in
Data 1D is input in
the 2,000th cycle.
the 5,000th cycle.
the 9,000th cycle.
1000
2000
3000
4000
5000
6000
7000
8000
9000
10000
Number of cycles executed
As shown above, data can be input to memory address 2 in any desired cycle as specified by
the user.
63
PD79SIM User's Manual
(2)
Read access synchronized input
Data can be input when the program accesses a specified memory location for read. The data
size that can be input is one byte.
The diagram below shows an example of a virtual port input that is synchronized to memory
accesses for read.
Shown in the sample program below is a function that reads data from port0 (address 2).
#pragma ADDRESS port0 2H
char port0;
read_port()
{
char key;
key = port0; /* Input from port 0 */
}
:
:
This function aims to assign the value of port 0 to variable key. In such a case, a value can be
assigned to variable key by entering it to port 0 when the program accesses port 0 (address 2)
for read.
To support processing of functions like this, PD79SIM provides a function that allows you to
define the data to be input according to a number of times the specified memory address is
read (a virtual input port synchronized to memory accesses for read). By using this function,
you can perform an operation where data 0x10 is input to memory address 3E0 when address
2 is read first and data 0x20 is input to said memory address when the address is read next.
Number of times the address 2 is read
First
Second
Third
:
:
64
Data input to address 2
0x10
0x20
0x30
:
:
Window function of PD79SIM
(3)
Interrupt synchronized input
Data can be input to a specified memory location when a virtual interrupt occurs. The data
size that can be input is one byte.
The diagram below shows an example of a virtual port input that is synchronized to
interrupts.
Shown in the sample program below is the case where data is read from port 1 (address 3)
using an interrupt handler routine (in this case, a timer interrupt handler routine).
#pragma ADDRESS port1 3H
char port1;
#pragma INTERRUPT
read_port
/* Interrupt handler for polling port 1 */
read_port()
{
char key;
key = port1; /* Input from port 1 */
}
:
:
This interrupt handler routine aims to assign the value of port 1 to variable key when a
virtual interrupt is generated. In such a case, a value can be assigned to variable key by
entering it to port 1 when a virtual interrupt (in this case, a timer interrupt) is generated.
It is assumed that timer interrupts are generated using a separately available virtual
interrupt function. (For details, refer to the virtual interrupt function described later in this
manual.)
To support processing of interrupt handlers like this, PD79SIM provides a function that
allows you to define the data to be input according to a number of times a virtual interrupt is
generated (a virtual input port synchronized to virtual interrupts). By using this function,
you can perform an operation where data 0xFF is input to memory address 3 when the virtual
interrupt occurs first and data 0xFE is input to said memory address when the virtual
interrupt occurs next time.
Number of times a virtual interrupt is
generated
First
Second
Third
:
:
65
Data input to address 3
0xFF
0xFE
0xFD
:
:
PD79SIM User's Manual
1.14.2 Virtual Port Output
Virtual Port Output is a function that when data is written to some memory address by the program,
allows the written data value to be recorded along with the cycle in which the data was written.
The recorded data can be displayed for your reference in chart, numeric, or graphic mode.
The maximum number of data that can be recorded by this function is 30,000 entries counted from
the beginning of program execution.
For example, if data is written to port 0 (address 2) by executing a program like the one shown below,
#pragma ADDRESS port0
char port0;
2H
out_port(char data)
{
port0 = data; /* Data is output to port 0 */
:
:
}
the data written to address 2 is recorded along with the cycle count in which the data was written.
1.14.3 Virtual Interrupt
This function defines interrupt generation. Using this function, you can generate timer interrupts
or AD conversion interrupts in a simulated manner without having to actually generate them.
There are following three types of virtual interrupts:
(1) Cycle synchronized interrupt
A specified virtual interrupt can be generated when program execution has reached a specified
number of cycles.
The diagram below shows an example of a virtual interrupt that is synchronized to machine
cycles.
Example where virtual interrupt of vector address 0xffec (timer A0) is defined
1000
Virtual interrupt is
Virtual interrupt is
Virtual interrupt is
generated in the
generated in the
generated in the
3,000th cycle
6,000th cycle
9,000th cycle
2000
3000
4000
5000
6000
7000
8000
9000
10000
Number of cycles executed
As shown above, virtual interrupts (in this case, timer A0 interrupt) can be generated in any
desired cycle.
66
Window function of PD79SIM
(2) Executed address synchronized interrupt
Virtual interrupts can be generated when the program has executed a specified address. The
diagram below shows an example of a virtual interrupt that is synchronized to executed
addresses.
Address
func()
{
Virtual interrupt is generated when
Processing;
:
:
F0000
}
program execution has moved into
address F0000.
As shown above, a specified virtual interrupt can be generated when program execution has
moved into address F0000.
By using this function, you can specify that a virtual interrupt be generated when address
F0000 is executed first by the program, and that no virtual interrupt be generated when the
address is executed next, as shown below.
Number of times the address
F0000 is executed
Whether virtual interrupt is
generated
First
Second
Third
Virtual interrupt is generated
Virtual interrupt is not
generated
Virtual interrupt is generated
:
:
:
:
67
PD79SIM User's Manual
1.14.4 Screen Configuration of I/O Window
This window is split into three sections, each displaying the setup contents of virtual port inputs, the
output results of virtual port outputs, and the setup contents of virtual interrupts.
Tool bar
Virtual port input
screen
Virtual port output
screen
Virtual interrupt
screen
Each screen is detailed in the pages to follow.
68
Window function of PD79SIM
1.14.5 Structure of Virtual Port Input Screen
1.14.5.1 Screen structure for cycle-synchronized inputs
If you've set virtual port inputs that are synchronized to machine cycles, they can be displayed in one
of the three modes shown below. The display modes can be changed from the Mode menu.
(1) Chart mode (displayed in units of bits)
The virtual port input that has been set is displayed in chart mode in units of bits.
Cycle count
display area
Address
display
area
Bit number
display
Input data display area
area
Address display area
It displays the memory address to which a virtual port is input.
Bit number display area
It displays bit numbers of memory to which a virtual port is input.
Input data display area
It displays the virtual port input data that has been set in chart mode in units of bits.
This means that memory bits are in the state of logic 1.
This means that memory bits are in the state of logic 0.
The short white lines appearing at the bottom of the input data display area indicate points at
which data are input.
To reference data values, move the mouse cursor into this area and the value and the cycle count
of the data at which the cursor is positioned will be displayed in the cycle count display area.
Cycle count display area
It displays cycle counts.
69
PD79SIM User's Manual
(2)
Graphic mode (displayed in units of bytes)
The virtual port input that has been set is displayed in graphic mode in units of bytes.
Cycle count
display area
Address display area
Input data display area
Address display area
It displays the memory address to which a virtual port is input.
Input data display area
It displays the virtual port input data that has been set in graphic mode.
The peaks in this graph represent data values derived by equally dividing the height of the
data-displaying area by 255 (maximum value of 1-byte data).
The short white lines appearing at the bottom of the input data display area indicate points at
which data are input.
To reference data values, move the mouse cursor into this area and the value and the cycle count
of the data at which the cursor is positioned will be displayed in the cycle count display area.
Cycle count display area
It displays cycle counts.
70
Window function of PD79SIM
(3)
Hexadecimal mode
The virtual port input that has been set is displayed in hexadecimal mode.
Cycle count
display area
Address display area
Input data display area
Address display area
It displays the memory address to which a virtual port is input.
Input data display area
It displays the virtual port input data that has been set by hexadecimal numbers.
To reference data values, move the mouse cursor into this area and the value and the cycle count
of the data at which the cursor is positioned will be displayed in the cycle count display area.
Cycle count display area
It displays cycle counts.
71
PD79SIM User's Manual
1.14.5.2 Screen structure for read access-synchronized inputs
When you've set virtual port inputs that are synchronized to memory accesses for read, a display
screen configured as shown below will appear.
Read access count
display area
Address
display
area
Read address display
area
Input data display area
Address display area
It displays the memory address to which a virtual port is input.
Read address display area
It displays the address to be monitored for read access.
Input data display area
It displays the virtual port input data that has been set by hexadecimal numbers.
To reference data values, move the mouse cursor into this area and the value and the read access
count of the data at which the cursor is positioned will be displayed in the read access count
display area.
Read access count display area
It displays read access counts.
72
Window function of PD79SIM
1.14.5.3 Screen structure for interrupt-synchronized inputs
When you've set virtual port inputs that are synchronized to virtual interrupts, a display screen
configured as shown below will appear.
Virtual interrupt
occurrence count
display area
Address
display
area
Vector
address
display area
Input data display area
Address display area
It displays the memory address to which a virtual port is input.
Vector address display area
It displays the virtual interrupt vector address to be monitored.
Input data display area
It displays the virtual port input data that has been set by hexadecimal numbers.
To reference data values, move the mouse cursor into this area and the value and the virtual
interrupt occurrence count of the data at which the cursor is positioned will be displayed in the
virtual interrupt occurrence count display area.
Virtual interrupt occurrence count display area
It displays virtual interrupt occurrence counts.
Virtual interrupt occurrence count display area
It displays virtual interrupt occurrence counts.
73
PD79SIM User's Manual
1.14.6 Structure of Virtual Port Output Screen
Virtual port output results can be displayed in one of the three modes shown below.
modes can be changed from the Mode menu.
The display
(1) Chart mode (displayed in units of bits)
Virtual port output results are displayed in chart mode in units of bits.
Cycle count
display area
Address
display
area
Bit number
display
area
Output data display area
Address display area
It displays the address to be monitored for virtual port output.
Bit number display area
It displays bit numbers of memory being monitored for virtual port output.
Output data display area
It displays the data as virtual port output results in chart mode in units of bits.
This means that memory bits are in the state of logic 1.
This means that memory bits are in the state of logic 0.
The short white lines appearing at the bottom of the output data display area indicate points at
which data are output.
To reference data values, move the mouse cursor into this area and the value and the cycle count
of the data at which the cursor is positioned will be displayed in the cycle count display area.
Cycle count display area
It displays cycle counts.
74
Window function of PD79SIM
(2) Graphic mode (displayed in units of bytes)
Virtual port output results are displayed in graphic mode in units of bytes.
Cycle count
display area
Address
display area
Output data display area
Address display area
It displays the address to be monitored for virtual port output.
Output data display area
It displays the data as virtual port output results in graphic mode in units of bytes.
The peaks [ ] in this graph represent data values derived by equally dividing the height of the
data-displaying area by 255 (maximum value of 1-byte data).
The short white lines appearing at the bottom of the output data display area indicate points at
which data are output.
To reference data values, move the mouse cursor into this area and the value and the cycle count
of the data at which the cursor is positioned will be displayed in the cycle count display area.
Cycle count display area
It displays cycle counts.
75
PD79SIM User's Manual
(3) Hexadecimal mode
Virtual port output results are displayed in hexadecimal mode.
Cycle count
display area
Address display area
Output data display area
Address display area
It displays the address to be monitored for virtual port output.
Output data display area
It displays the data as virtual port output results by hexadecimal numbers.
To reference data values, move the mouse cursor into this area and the value and the cycle count
of the data at which the cursor is positioned will be displayed in the cycle count display area.
Cycle count display area
It displays cycle counts.
76
Window function of PD79SIM
1.14.7 Structure of Virtual Interrupt Screen
1.14.7.1 Screen structure for cycle-synchronized interrupts
When you've set virtual interrupts that are synchronized to machine cycles, a display screen
configured as shown below will appear.
Cycle count
display area
Vector
Priority level
display area
address
display area
Virtual interrupt display area
Vector address display area
It displays the vector address of a virtual interrupt.
Priority level display area
It displays the priority level of a virtual interrupt.
Virtual interrupt display area
It displays timing at which the virtual interrupt you've set is generated.
This means that a virtual interrupt is generated.
This means that a virtual interrupt is not generated.
Cycle count display area
It displays cycle counts.
77
PD79SIM User's Manual
1.14.7.2 Screen structure for executed address-synchronized interrupts
When you've set virtual interrupts that are synchronized to executed addresses, a display screen
configured as shown below will appear.
Execution
count display
area
Executed
address
display
area
Vector
address
display
area
Priority level
display area
Virtual interrupt display area
Executed address display area
It displays the fetch address (the address where the program is executed) at which time a virtual
interrupt is generated.
Vector address display area
It displays the vector address of a virtual interrupt.
Priority level display area
It displays the priority level of a virtual interrupt.
Virtual interrupt display area
It displays timings by an asterisk (*) at which the virtual interrupt you've set is generated.
When an asterisk (*) is indicated, it means that a virtual interrupt is generated. When an
asterisk (*) is not indicated, it means that a virtual interrupt is not generated.
Execution count display area
It displays execution counts or a number of times the program has executed a specified address.
78
Window function of PD79SIM
1.14.8 I/O Window Tool Bar
Delete button
Deletes setup data.
Modify button
Changes setup data.
Mode button
Changes display mode.
Color button
Changes display color.
Setup button
Load button
Scale button
Sets virtual port input, Loads saved setup data Changes scale.
virtual port output,
or I/O script file.
or virtual interrupt.
I/O script button
Lists registered I/O
script files.
1.14.9 Extended Menu of I/O Window
If the I/O Window is active among the windows brought up in the main display area of PD79SIM, the
[Option] menu has the following menu items assigned to it.
Menu
Menu item
Function
Shortcut key
Option
Font......
Changes font.
−
Setup...
Sets virtual port input, virtual port output, or virtual interrupt.
−
Modify...
Changes set virtual port input or virtual interrupt.
−
Delete...
Deletes set virtual port input, virtual port output, or virtual
interrupt or user-created I/O script file.
−
Load...
Loads saved virtual port input, virtual port output, or virtual
interrupt or user-created I/O script file.
−
Mode...
Changes display mode.
−
Scale...
Changes display scale.
−
Color...
Changes display color.
−
79
PD79SIM User's Manual
1.15 GUI Input Window
This window allows you to create a simple key input panel (buttons) of the user target system in a
window and execute virtual port input or virtual interrupt by pressing one of the buttons you've
created.
For details on how to create and set up a key input panel, refer to "High-end Debugging" described
later in this manual.
The screen configuration, tool bar, and menus of the GUI Input Window are explained here.
One of the following three operations can be executed by pressing a button you've created in the key
input panel of the GUI Input Window.
l Virtual port input
l Virtual interrupt generation
l Simultaneous generation of virtual interrupt and virtual port input
1.15.1 Screen Configuration of GUI Input Window
Tool bar
Input panel display area
l You can create, edit, and move buttons in the input panel display area.
l The buttons you've created can be assigned labels (button names).
l By pressing the buttons you've created, you can generate virtual port input, virtual interrupt, or
virtual port input plus virtual interrupt.
l The input panel you've created can be saved to a file (GUI input file).
80
Window function of PD79SIM
1.15.2 Tool Bar of GUI Input Window
Grid button
Shows/hides grid line.
Make button
Creates button.
Set button
Edits or moves button.
Save button
Saves GUI input file.
Load button
Loads GUI input file.
1.15.3 Extended Menu of GUI Input Window
If the GUI Input Window is active among the windows brought up in the main display area of
PD79SIM, the [Option] menu has the following menu items assigned to it.
Menu
Menu item
Function
Shortcut key
Option
Set
Edits or moves button.
−
Del
Deletes button.
−
Copy
Copies button.
−
Paste
Pastes button.
−
Make Button
Creates button.
−
Display Grid Line
Shows/hides grid line.
−
Load...
Loads GUI input file.
−
Save...
Saves GUI input file.
−
81
PD79SIM User's Manual
1.16 GUI Output Window
This window allows you to implement a simple output panel of the user target system in a window.
The following parts can be arranged in this output panel:
l Label (character string)
User-specified character strings are displayed or erased when some value is written to a specified
memory address or according to logic 1 or 0 in a bit.
l LED
LEDs are lit when some value is written to a specified memory address or according to logic 1 or 0
in a bit.
For details on how to create and set up an output panel, refer to "High-end Debugging" described
later in this manual.
The screen configuration, tool bar, and menus of the GUI Output Window are explained here.
1.16.1 Screen Configuration of GUI Output Window
Tool bar
Output panel display area
l You can create, edit, or move labels and LEDs in the output panel display area.
l The output panel you've created can be saved to a file (GUI output file).
82
Window function of PD79SIM
1.16.2 Tool Bar of GUI Output Window
Grid button
Shows/hides grid line.
Label button
Creates label.
Save button
Saves GUI output file.
Load button
Loads GUI output file.
Set button
Edits or moves parts.
LED button
Creates LED.
1.16.3 Extended Menu of GUI Output Window
If the GUI Output Window is active among the windows brought up in the main display area of
PD79SIM, the [Option] menu has the following menu items assigned to it.
Menu
Menu item
Function
Shortcut key
Option
Set
Edits or moves parts.
−
Del
Deletes parts.
−
Copy
Copies parts.
−
Paste
Pastes parts.
−
Make Label
Creates label.
−
Make LED
Creates LED.
−
Display Grid Line
Shows/hides grid line.
−
Load...
Loads GUI output file.
−
Save...
Saves GUI output file.
−
83
PD79SIM User's Manual
1.17 MR Window
Use the MR Window to display the status of the real-time OS. You can only use the MR Window when
you have downloaded a program that uses the real-time OS (if the downloaded program does not use
the MR, nothing is displayed in the MR Window when it is opened.)
Note that MR Windows can be opened for each of the display modes (currently 9 max.).
Notes:
l
If the downloaded program does not use the MR, you cannot select a display mode from a
menu.
1.17.1 Structure of MR Window
The following shows the screen configuration of the MR Window.
Toolbar
1.17.2 MR Window Toolbar
The following table shows the information displayed in the MR Window when you click each of the
above buttons, respectively.
Button
TSK
RQ
TIM
FLG
SEM
Information displayed
Task status
Ready queue status
Timeout queue status
Event flag status
Semaphore status
Button
MBX
CYH
ALH
MPL
84
Information displayed
Mailbox status
Cyclic handler status
Alarm handler status
Memory pool status
Window function of PD79SIM
1.17.3 Extended Menus in the MR Window
When the MR Window is active in the PD79SIM main display area, the [Option] menu contains the
following items:
Menu
Menu options
Function
Option
Font...
Change font.
−
Mode
Task
Ready Q
Timeout Q
Event Flag
Switch display mode.
Display Task status.
Display Ready queue status.
Display Timeout queue status.
Display Event flag status.
−
−
−
−
−
Display Semaphore status.
Display Mailbox status.
Display Cycle handler status.
Display Alarm handler status.
−
−
−
−
Display Memory pool status.
−
−
−
Semaphore
Mailbox
Cyclic Handler
Alarm Handler
Memory Pool
MR
Context...
Layout
Status Bar
Shortcut keys
Display Context.
Set Layout.
Switch display or non-display of status bar.
85
−
−
PD79SIM User's Manual
1.18 Coverage Window
This window is used to measure the coverage (C0 coverage) of each function in the currently
downloaded C language program. There are two types of coverage windows: a coverage
window that allows you to reference the start/end addresses and the coverage of each
function and a coverage source window that allows you to reference for each source line
whether the target program has been executed or not.
1.18.1 Structure of Coverage Window
1.18.1.1 Structure of Coverage Window
Toolbar
Coverage scope display area
Function scope
display area
Functiion name display area
l
l
l
Coverage display
area
When the target program is executed using a GO or STEP command, the display in the Coverage
column changes to '--'. To update the display, press the Refresh button on the toolbar (or select
[Option] −> [Refresh] from the menu).
The coverage source window that allows you to reference for each source line whether the target
program has been executed or not can be opened by double-clicking on any desired line in the
Function column.
The function scope display area can be turned on or off by selecting or deselecting [Option] −>
[Layout] −> [Address Area] from the menu.
86
Window function of PD79SIM
1.18.1.2 Structure of Coverage Source Window
Program display area
Line No. display area
l
l
l
Address display area
The lines that have already been executed are displayed in light blue and those not executed are
displayed in gray. The lines where no code exist (e.g., comment lines) are displayed in white.
When executing the target program, the lines where code exist are displayed in gray.
The executed/non-executed information in the program display area is automatically updated
when the program has stopped. If you want to see some other function, double-click on the
desired function in the coverage window. (The window can be scrolled through functions
providing that they exist in the same source file.)
The line No. display area and address display area can be displayed or hidden by selecting or
canceling [Option] −> [Layout] −> [Line Area] and [Option] −> [Layout] −> [Address Area]. Note
that, by default, the address display area is hidden.
1.18.2 Coverage Window Toolbar
Refresh button
Update displayed coverage measurement
Clear
button
Initialize coverage measurement
87
PD79SIM User's Manual
1.18.3 Extended Menus in the Coverage Window
1.18.3.1 Extended Menus in the Coverage Window
When the Coverage Window is active in the PD79SIM main display area, the [Option] menu
contains the following items:
Menu
Menu options
Function
Shortcut keys
Option
Font...
Change font.
--
Refresh
Update displayed coverage measurement results.
--
Clear
Initialize coverage measurement results.
--
File
Save...
Load...
Input/output coverage measurement result files.
Save coverage measurement result file.
Load coverage measurement result file.
----
Layout
Address Area
Set layout.
Turn on/off address area.
---
1.18.3.2 Extended Menus in the Coverage Source Window
When the Coverage Source Window is active in the PD79SIM main display area, the
[Option] menu contains the following items:
Menu
Menu options
Function
Shortcut keys
Option
Font...
Change font.
--
TAB...
Set source file display tabs.
--
Layout
Line Area
Address Area
Set layout.
Turn on/off line No. area.
Turn on/off address area.
----
88
Window function of PD79SIM
1.19 S/W Break Point Setting Dialog Box
The S/W Break Point Setting dialog box allows you to set software break points. Software breaks stop
the execution of instructions immediately before the specified break point. You can also enable and
disable each of those break points.
1.19.1 Structure of S/W Break Point Setting Dialog Box
Loads a breakpoint
information file
Saves a breakpoint
information file
Field for specifying a
break address, if
specifying an address
Adds a break point
Searches for filename
Fields for specifying
filename + line No.
if specifying filename +
line No.
Closes dialog box
Deletes specified break point
Deletes all break points
Enables specified break point
Enables all break points
Disables specified break point
Disables all break points
Area for setting software break points
l
l
l
l
You can set up to 64 software break points in PD79SIM.
If you have set multiple software breakpoints, program execution stops when any one software
break address is encountered (OR conditions).
You can continue to set software breakpoints until you click the <Close> button to close the S/W
BreakPoint setting dialog box.
You can clear, enable or disable software breakpoints selected by clicking in the software
breakpoint display area. You can also enable and disable software breakpoints by doubleclicking on them.
1.19.2 Entries in List of Software Break Points
*
00801C
[
39]
Sample.c
Filename for break address
Line No. at break address
Break address
Indicates if break point is enabled(“*”=disabled, “ “=enabled)
l
If there is no source line, etc., for the address, only the address is displayed.
89
PD79SIM User's Manual
1.20 H/W Break Point Setting Dialog Box
The H/W Break Point Setting dialog box allows you to set hardware break points. Hardware breaks
are effected when data is written to or read from memory, or an instruction is fetched from memory.
1.20.1 Structure of H/W Break Point Setting Dialog Box
H/W break
enable/disable area
Pass count setting
area
Address setting area
Access condition
setting area
Size setting area
Check if no data
comparison is to be
performed
Comparison data
setting area
Comparison
condition setting
area
Add breakpoint
button
Hardware breakpoint
display area
Clear specified
breakpoint button
Button to clear
all breakpoints
Button for closing
dialog box
l
l
l
l
You can set up to 64 hardware break points in PD79SIM.
If you have set multiple hardware breakpoints, program execution stops when any one hardware
break address is encountered (OR conditions).
You can continue to set hardware breakpoints until you click the <Close> button to close the
H/W BreakPoint setting dialog box.
You can clear hardware breakpoints selected by clicking in the hardware breakpoint display
area.
1.20.2 Entries in List of Hardware Break Points
START
008000
Break address
Label for break address
001
BYTE
Pass count
40
READ
Comparison data
Data size
90
>
Comparison condition
Access condition
Basic Operation
91
92
Loading and Displaying the Target Program
1 Loading and Displaying the Target Program
1.1 Downloading
To download the target program, select the following from the PD79SIM Window:
[File] −> [Download] −> [Load module...]
The File Selection dialog box opens. Select the target program from the File Selection dialog box.
The file to be downloaded is in the IEEE-695 absolute file format (called an X79 file). X79 files have
the filename extension ".x79".
When downloading a target program, the memory is mapped automatically.
You can also press Shift+F1 to open the File Selection dialog box for downloading files.
1.Find the directory.
2.Double-click the
file name.
The opened directory in the dialog box is the directory where the last downloaded file exist. In the
first opening (just after installing PD79SIM), the opened directory is the current directory.
Note:
If you download the file X79 but the Program and Source Window does not switch to Source
Program mode, the file X79 may not contain source line information. Check the options that you
specified when compiling, assembling, and linking.
93
P D 7 9 S I M U s e r ’s M a n u a l
To download only machine language data
To download only machine language data, select the following from the PD79SIM Window menu:
[File] −> [Download] −> [Memory Image...]
The File Selection dialog box opens. Select the Motorola S format, then download the machine
language data.
To download only symbol data
To download only symbol data, select the following from the PD79SIM Window menu:
[File] −> [Download] −> [Symbol...]
Select file X79 from the file Selection dialog box, then download the symbol data. When you
download only symbol data, only the symbol data from the file X79 is read.
To reload a file
When downloading a previously downloaded file again, PD79SIM allows you to download it
without having to specify its file name. To reload a file, choose the PD79SIM window menus.
[File] −> [Reload]
The file is reloaded when these menus are selected.
1.2 To Reload the recent downloaded file
The recent downloaded files (maximum files of 4) are listed in the PD79SIM Window menu [File].
To reload the file, select the file name listed.
NOTE:
If the length of the file name with path is more than 25 characters, the display of the
upper directory is abbreviated.
94
Loading and Displaying the Target Program
1.3 To download the target program automatically when
updated
If the target program is updated when a command executing the target program, it can be
downloaded automatically.
To select the PD79SIM Window menu [File] -> [AutoDownLoad...], the AutoDownLoad dialog box
open. You can specify this function in this dialog box.
l
l
l
Enable AutoDownLoad (confirm)
Downloading automatically with confirmation when the target program is updated.
Enable AutoDownLoad (no-confirm)
Downloading automatically without confirmation when the target program is updated.
Disable AutoDownLoad
Not downloading automatically even if the target program is updated.
1.4 Changing Program Display Position Immediately After
Downloading
When you download a target program in PD79SIM , The Program Window displays the source
program at the position of the program counter after the target program has been reset. If there is no
source line data at this program counter position (the startup program, for example, has no source
line data), the program is displayed in disassemble mode.
If, after downloading a target program, you want to automatically display a source program such as
the "main" function, you must first specify the name of that function. From the PD79SIM Window
menu, select
[Environ] −> [StartUp...]
to open the StartUp Dialog box. Specify the name of the function to be displayed.
1. Specify the name of
the function.
2. Click the “OK” button.
Even when you display the function specified in the StartUp dialog box in the Program Window, the
program counter remains at the same value it held immediately after downloading. To advance the
program counter to the function you specified in the StartUp dialog box, perform "Come" execution.
See Section 2.4, "Program Execution to Specified Location" in the Basic Operation for details.
95
P D 7 9 S I M U s e r ’s M a n u a l
Note:
This setting is ignored if there is source line data at the position of the program counter
immediately after downloading.
1.5 Uploading
From the PD79SIM Window menu, select
[File] −> [Upload...]
to open the Upload dialog box. Enter the upload area and the name of the file to be saved. You can
specify files in the Motorola S format or Intel HEX format. To save a file in the Motorola S format,
specify the ".mot" attribute. To save a file in the Intel HEX format, specify the ".hex" attribute. If you
specify an existing filename, that file is overwritten.
1. Specify the starting address.
2. Specify the end
address.
3. Specify the
name of the file to
be saved.
4. Click the “OK” button.
1.6 Saving Results of Disassembly
From the PD79SIM Window menu, select
[File] −> [Save Disasm...]
to open the Save Disasm dialog box. Enter the area to be saved and the filename. You can specify any
filename and attribute. If you specify an existing filename, that file is overwritten.
1. Specify the starting address.
2. Specify the end
address.
3. Specify the
name of the file to
be saved.
4. Click the “OK” button.
96
Loading and Displaying the Target Program
1.7 Continuing to Display a Selected Program Position
The Program Window always displays the target program at the position of the program counter and
you cannot, therefore, choose to always display the same position. You can do so, however, in the
Source Window. To open the Source Window, select the following from the PD79SIM Window menu:
[Window] −> [Source Window]
1.8 Changing the Program Display Position
You can display the source program in the Program Window and in the Source Window. To change
the display position of the Program (or Source) Window, click on the "View" button in the toolbar of
the Program (or Source) Window to open the Disp Area dialog box. You can only change the display
position in the active window.
View button
Click the "View" button to open the Disp Area dialog box.
Source button
Change the
File/Function level
Address button
Change the Address/Line
No. level
PC button
Change the program counter
If no debugging information has been read in, no changes can be made at the file or function level, or
at the line No. level. Further, if the Program (or Source) Window is in disassemble display mode, no
changes can be made at the line No. level.
97
P D 7 9 S I M U s e r ’s M a n u a l
Changing the display position at the file/function level
Click the "Source" button in the Disp Area dialog box to open the Source dialog box. (The
"Source" button cannot be clicked if no debugging information has been read in.) The Source
dialog box shows the file structure of the downloaded target program plus data on functions.
Click the name of the file and the function name to be changed.
1. Select the file name.
3. Sets M and X flags.
2. Select the function name.
4. Click the “OK” button.
To open the Source dialog box, select the following from the PD79SIM Window menu:
[Option] −> [View] −> [Source...]
You can also double-click the line No. display area of the Program (Source) Window to open the
Source dialog box.
98
Loading and Displaying the Target Program
Changing the display position at the address level
When the Program (Source) Window is in disassemble display mode, click the "Address" button
from the Disp Area dialog box. Click the "Address" button to open the Disp Address dialog box.
1. Specify the address.
2.Specify "m" and "x"
flags.
3. Click the “OK” button.
Note:
The default values of the M and X flags are the current M and X flag values.
When the Program (Source) Window is in source display mode, the Address dialog box (see
below) is open. Click the Address button in the Address dialog box to enter the new address.
1. Click the Address button.
2. Specify the address.
3. Click the “OK” button.
To open the Disp Address dialog box, select the following from the PD79SIM Window menu:
[Option] −> [View] −> [Address...]
You can also double-click the address display area of the Program (Source) Window to open the
Disp Address dialog box.
99
P D 7 9 S I M U s e r ’s M a n u a l
Changing the display position at the line No. level
When the Program (Source) Window is in source display mode, click the "Address" button from
the Disp Area dialog box. Click the "Address" button to open the Address dialog box. Click the
Line button in the Address dialog box to enter the new line No.
1. Click the Line button.
2. Specify the line No.
3. Click the “OK” button.
To open the Address dialog box, select the following from the PD79SIM Window menu:
[Option] −> [View] −> [Address...]
You can also double-click the address display area of the Program (Source) Window to open the
Address dialog box.
Changing the position of the program counter
Click the "PC" button in the Disp Area dialog box. When you click the "PC" button, the display
position changes to the position of the program counter. Change the position of the program
counter, select the following from the PD79SIM Window:
[Option] −> [View] −> [Program Counter]
100
Loading and Displaying the Target Program
1.9 Checking Source Programs in Other Directories
You can specify the search path for source files. This is helpful when the source files for target
programs are stored in multiple subdirectories or not in the current directory. This function allows
you to check these source files and set software breakpoints, etc., from the Program (or Source)
Window. To open the Path dialog box and set the search path, select the following from the PD79SIM
Window menu:
[Environ] −> [Path...]
To add a search path, click the "Add" button in the Path dialog box. The File Selection dialog box
opens. Use the mouse to select the name of the file to be checked.
1. Click the “Add” button.
3. Click the “OK” button.
2. Specify the search path in the File Selection dialog box.
Note:
When displaying the source file in the program and source windows, PD79SIM
searches for the directory in order of the following priorities:
1.
Path written in debug information
2.
Path to target program
3.
Paths specified in search paths (in the order they are specified)
101
P D 7 9 S I M U s e r ’s M a n u a l
To delete a search path
Open the Path dialog box, then carry out the following:
1. Click the search path to be deleted.
2. Click the “Delete” button.
3. Click the “OK” button.
*Click “Delete All” to delete all search paths.
1.10 Mixing Source and Disassemble Displays
Click the "MIX" button on the Program (or Source) Window toolbar to simultaneously display both the
source file and the results of disassembly. You can also select the following from the PD79SIM
Window menu:
[ Option ] −> [ Mode ] −> [ MIX Mode ]
The display mode changes only in the active window.
The Program Window automatically switches to MIX display mode when the position of the program
counter when the target program stops in the area output in the source line information and does not
match the starting address of the source line.
To return to source program display from MIX display mode
Click the "SRC" button on the Program (or Source) Window toolbar. You can also select the following
from the PD79SIM Window:
[ Option ] −> [ Mode ] −> [ Source Mode ]
Note:
If the macro definitions include a program counter value, the yellow line indicating the PC value
may not be displayed.
102
Loading and Displaying the Target Program
1.11 Displaying the Results of Disassembling
To display disassembled results, click the "DIS" button (only disassembled results displayed) or the
"MIX" button (source lines and disassembled results displayed together) on the program (source)
window toolbar. To switch over the display mode, use the PD79SIM window menu commands shown
below:
[Option] -> [Mode] -> [Mix Mode]
..... Switch to the Mix display mode.
[Option] -> [Mode] -> [Disasm Mode] ..... Switch to the Disassemble display mode.
The display mode can only be changed in the active window.,
SRC button
Switches to source display mode.
MIX button
Switched to MIX display mode.
DIS button
Switches to disassemble display
mode.
If, when the target program stops, the program counter is in an area with no source line data, the
Program Window automatically switches to disassemble display mode.
Note:
If the beginning line of the currently displayed source file does not match the PC value
when switching over the display mode between Mix and Disasm in the program
(source) window, a dialog box for selecting the M and X flags appears.
To revert from disassemble display to source program display mode
Click the "SRC" button on the Program (or Source) Window toolbar.
You can also switch to source program display mode by selecting the following from the PD79SIM
Window menu:
[Option] −> [Mode] −> [Source Mode]
To revert from disassemble display to MIX display mode
Click the "MIX" button on the Program (or Source) Window toolbar.
You can also switch to source program display mode by selecting the following from the PD79SIM
Window menu:
[Option] −> [Mode] −> [MIX Mode]
Note:
If there is no source line data in the first line in the program display area of the
Program (or Source) Window, you cannot switch from disassemble display or MIX
display mode to source display mode (the "SRC" and “MIX” button is inoperable). In this
case, use the vertical scrollbar or Up/Down cursor keys to move the starting address of
the program display area to a position where there is source line data.
103
P D 7 9 S I M U s e r ’s M a n u a l
1.12 Changing Display Colors
To change display colors in the Program Window, when you select the menu [Option] -> [Color...], the
Color Setup Dialog Box open.
Note that this setting have effect on all Source Windows.
Character color
Background color
1.12.1
l
l
The functions of Color Setup Dialog Box
Pushing the button to the left of each color box make the Color Setup Dialog Box open. You can
change the display colors in this dialog box.
Pushing the Reset button set the colors default.
104
Starting and Stopping Target Program Execution
2 Starting and Stopping Target Program
Execution
2.1 Starting and Stopping
To start the target program
Click the "Go" button on the PD79SIM Window toolbar. You can also press the "F1" key.
Click the “Go” button.
You can also start the target program by selecting the following from the PD79SIM Window
menu:
[Debug] −> [Go]
The target program runs until it reaches a breakpoint.
Free-running the target program
Selecting the PD79SIM Window menu [Debug] -> [GoFree] make the target program executed with
software break points and hardware break points disabled.
To stop the target program
Click the "Stop" button on the PD79SIM Window toolbar.
Click the “Stop” button.
105
P D 7 9 S I M U s e r ’s M a n u a l
You can also start the target program by selecting the following from the PD79SIM Window
menu:
[Debug] −> [Stop]
Note:
If, when the target program stops, the program counter is in an area with no source line data,
the Program Window automatically switches to MIX display mode.
To start the target program from a specific address
Select the following from the PD79SIM Window menu:
[Debug] −> [Go] −> [Go Option...]
The Go dialog box opens. Enter the starting address.
To check if the target program is running
The current execution status is displayed at the right end of the status bar in the PD79SIM
Window.
Target program is running.
Target program is running.
106
Starting and Stopping Target Program Execution
2.2 Step Execution
Click the "Step" button on the PD79SIM Window toolbar. Or press F3.
Click the “Step” button.
When the Program Window is in source program mode, each line of the source program is executed,
step by step. When the Program Window is in disassemble mode, each instruction is executed, step by
step.
You can also start step execution by selecting the following from the PD79SIM Window menu:
[Debug] −> [Step] −> [Step]
To execute subroutines as single instructions in step mode
Executing subroutines as single instructions in step mode is called as over-step execution. Click
the "Over" button on the PD79SIM Window toolbar. Or press F4.
Click the “Over” button.
You can also start over-step execution by selecting the following from the PD79SIM Window
menu:
[Debug] −> [Over] −> [Over]
To specify the time of steps
Select the following from the PD79SIM Window menu:
[Debug] −> [Step] −> [Step Option...]
(For over-step execution, select [Debug] -> [Over] -> [Over Option...].)
Specify the time of steps in the displayed Step (or Over) dialog box.
To stop step execution
Click the "Stop" button on the toolbar. You can also stop step execution by selecting the following
from the PD79SIM Window menu:
[Debug] −> [Stop]
This also applies to over-step execution.
107
P D 7 9 S I M U s e r ’s M a n u a l
2.3 Returning from Current to Calling Routine
Click the "Return" button on the PD79SIM Window toolbar (called as Return execution). You can
also press F5.
Click the “Returen” button.
You can also return to a calling routine by selecting the following from the PD79SIM Window menu:
[Debug] −> [Return]
To stop return execution
Click the "Stop" button on the toolbar.
You can also stop return execution by selecting the following from the PD79SIM Window menu:
[Debug] −> [Stop]
2.4 Program Execution to Specified Location
To run the target program to the specified position (known as Come Execution), first click the line at
which you want the program to stop in the program display area of the Program (Source) Window to
specify the cursor position. Note, however, that Come Execution cannot be carried out if the cursor is
positioned on a line in which no software breakpoint can be set (comment lines, and data definition
lines, etc.).
Cursor position set by clicking the mouse.
To start Come execution, click the "Come" button on the PD79SIM Window toolbar. You can also
press F2.
Click the “Come” button.
You can also start Come execution by selecting the following from the PD79SIM Window menu:
[Debug] −> [Come]
108
Starting and Stopping Target Program Execution
To stop come execution
Click the "Stop" button on the toolbar.
You can also stop Come execution by selecting the following from the PD79SIM Window menu:
[Debug] −> [Stop]
2.5 Resetting the Program
To reset the target program, click the "Reset" button on the PD79SIM Window toolbar. You can also
press F8.
Click the “Reset” button.
You can also reset the target program by selecting the following from the PD79SIM Window menu:
[Debug] −> [Reset]
109
P D 7 9 S I M U s e r ’s M a n u a l
3 Checking and Setting Register Data and Memory
Contents
3.1 Checking the Contents of Registers
Open the Register Window to check the contents of the registers. The Register Window, which lists
the CPU registers, is opened from the PD79SIM Window menu by selecting the following:
[ Basic Window ] −> [Register Window ]
See Section 1.4, "Register Window" in the Window Functions for details of the Register Window.
To Change the Display Radix of the Register Value
The display radix can be changed for each register. This is done with the following procedure.
1.
2.
Click the right mouse button on the Name of the register whose display radix you want to
change.
Select the radix you want displayed from the menu.
A register value in HEX
A register value in DECIMAL
110
Checking and Setting Register Data and Memory Contents
3.2 Changing the Contents of Registers
To Change the Register Value
Register contents can be changed with the following procedure.
1.
2.
Either double-click on the register line you want
to change or select the line and press the Enter
key.
A dialog box for setting the register value and
radix will open up, therefore input the new
value and radix.
To change the values of flags
l
l
When flag window is open
Click on the button of the flag you want to change. The flag value will change ever time it is
clicked on. However, for flags like IPL whose size is larger than 1 bit, a dialog box for setting
the register value will open up.
When the flag window is not open
Flag values can be changed in the same way as register values.
Either click on the line where "FLG" is displayed or select the
line and press the Enter key.
To Change Register Window Layout
l
Changing window size
When window size is changed, the contents of the window are laid out to fit the new window
size.
A scroll bar is added
where necessary.
Flags are assigned
depending on window
and font size.
111
P D 7 9 S I M U s e r ’s M a n u a l
l
To hide the radix item
With the Register Window active, either select [Option] >> [Layout] >> [Hide Radix] from the
menus or click the right mouse button on the register window list area and select
[Layout] >> [Hide Radix].
l
To hide the DPR1-3 Register item.
With the Register Window active, either select [Option] >> [Layout] >> [Hide DPR1-3] from
the menus or click the right mouse button on the register window list area and select
[Layout] >> [Hide DPR1-3].
l
To hide the flag item
With the Register Window active, either select [Option] >> [Layout] >> [Hide FLAGs] from the
menus or click the right mouse button on the FLG line and select [Layout] >> [Hide FLAGs].
The radix in the flag item will not change.
Flag register item. The name
of the currently set flag is
displayed. Also, IPL is
displayed as a decimal
number.
The radix item does not appear in
the pop-up menu displayed over
the register window.
112
Checking and Setting Register Data and Memory Contents
l
To adjust column width
The width of each of the Name, Value and Radix columns in the register window can be
adjusted. Drag the separator to do so. Also, double-clicking on the separator will automatically
adjust the width to the length of the longest character string.
3.3 Checking Changes in RAM During Target Program
Execution
Use the RAM monitor function to check changes in the contents of memory while the target program
is running. Check the changes in memory during execution using the RAM Monitor Window. To open
the RAM Monitor Window, select the following from the PD79SIM Window menu:
[ Basic Window ] −> [ RAM Monitor Window ]
See Section 1.7, "RAM Monitor Window" in the Window Functions for details of the RAM Monitor
Window.
To change the RAM monitor area
PD79SIM has a 1KB RAM monitor area, which by default is mapped to 0 to 3FF16. If you want to
check another area, you must change the RAM monitor area. To do so, click the "Area" button on
the toolbar in the RAM Monitor Window, or make sure the RAM Monitor Window is active, then
select the following from the PD79SIM Window menu to open the RAM Monitor Area dialog box:
[ Option ] −> [ RAM Monitor Area... ]
Enter the starting address of the RAM monitor area.
The RAM monitor area is also changed when you double-click the address display area in the RAM
monitor window to change the display starting address. In this case, if the specified display
starting address is not within the current RAM monitor area, a confirmation dialog box is
displayed asking whether or not to adjust the RAM monitor area. Click the OK button to adjust the
area.
To change the sampling period
The contents of memory displayed in the RAM Monitor Window are automatically updated at
regular intervals. The default sampling period is 100[ms]. To change the sampling period, make
sure the RAM Monitor Window is active, then select the following from the PD79SIM Window
menu to open the Sampling Period dialog box.
[ Option ] −> [ Sampling Period... ]
However, depending on operating conditions, updating may be slower than specified.
113
P D 7 9 S I M U s e r ’s M a n u a l
3.4 Checking the Value at a Specified Address
Use the watch function to check the value at a specified address. Check the value at the specified
address in the ASM Watch Window. The address is called as the watch point. To open the ASM Watch
Window, select the following from the PD79SIM Window menu:
[ Basic Window ] −> [ ASM Watch Window ]
If the specified watch point is within the RAM monitor area, changes during program execution can
be monitored from the ASM Watch Window.
See Section 1.8, "ASM Watch Window" in the Window Functions for details of the ASM Watch
Window.
To register a watch point
Click the "Add" button in the menu bar in the ASM Watch Window to open the Add dialog box.
Input the address to monitor. You can register the watch points also in the pop-up menu [Add ASM
Watch] of the Program Window.
1. Click the “Add” button to open the following dialog box.
2. Specify the address to monitor.
3. It is possible to select either the
assembler’s global symbol or
local symbol.
4. Select the data length.
5. Select the data radix.
6. Click the "OK" button.
The registered watchpoint is added at the current cursor position in the ASM Watch Window.
The cursor position is indicated by a red mark in the address display area and data display area.
You can move the cursor by clicking on either area or using the Up and Down keys.
114
Checking and Setting Register Data and Memory Contents
To register a specific bit as a watch point
Click the "BitAdd" button in the menu bar in the ASM Watch Window to open the BitAdd dialog
box. Input the bit symbol or the address and bit No. to monitor.
You can register the watch points also in the pop-up menu [BitAdd ASM Watch] of the Program
Window.
1. Click the “BitAdd” button to open the following dialog box.
2. Specify the bit symbol. If none has
been defined, Specify the address
and bit No. in the next fields.
3. It is possible to select either the
assembler’s global symbol or
local symbol.
4. Click the "OK" button.
To change the value at a specified address
Select the watch point to change in the ASM Watch Window, then click the "Set" button on the
toolbar of the ASM Watch Window.
2. Click the "Set" button.
1. Click the watch point to be changed.
The Set dialog box opens. Enter the new value.
115
P D 7 9 S I M U s e r ’s M a n u a l
To delete a watch point
Select the watch point to be deleted in the ASM Watch Window, then click the "Del" button on the
toolbar of the ASM Watch Window.
2. Click the "Del" button.
1. Click the watch point to be deleted.
∗ To delete all watch points, click the “DelAll” button.
You can also click the watch point to be deleted, then press the Delete key.
To change the memory display format
You can change the radix in which data is displayed to select the watch point to be changed in the
ASM Watch Window, then clicking "Hex", "Dec", or "Bin" in the toolbar of the ASM Watch Window.
Click to display in Hexadecimal
Click to display in Binary
Click to display in Decimal
You can also double-click the radix display area in the ASM Watch Window.
116
Checking and Setting Register Data and Memory Contents
3.5 To switch scope
To set a Scope, open the Scope Setting dialog box by selecting [Scope…] under [Debug] from the
menu in the PD79SIM Window.
Selecting the object listed in this dialog box make change the scope to the object
.
3.6 Setting Data at a Specified Address
You can use the Memory Window or Dump Window to set data at a specified address. To use the
Memory Window, select the following from the PD79SIM Window menu:
[ Basic Window ] −> [ Memory Window ]
To use the Dump Window, select the following from the PD79SIM Window menu:
[ Basic Window ] −> [ Dump Window ]
See Section 1.5, "Memory Window" in the Window Functions for details of the Memory Window, and
Section 1.6, "Dump Window" in the Window Functions for details of the Dump Window.
To change data at a specified address
With the Memory Window or Dump Window active, select the following from the PD79SIM
Window menu:
[ Option ] −> [ Debug ] −> [ Set... ]
When the Set dialog box opens, enter the address to be changed and the new data.
1. Specify the address.
2. Specify the new data.
3. Select the data length (Byte, Word, or DWord).
4. Click the "OK" button.
You can also double-click the data display area in the Memory Window or Dump Window to open
the Set dialog box.
117
P D 7 9 S I M U s e r ’s M a n u a l
To fill a specified area with data
With the Memory Window or Dump Window active, select the following from the PD79SIM
Window menu:
[ Option ] −> [ Debug ] −> [ Fill... ]
When the Fill dialog box opens, enter the area to be filled and the fill data.
When the Fill Dialog Box open after selecting the area by mouse in the Memory Window or in the
Dump Window, the start and end address of the area are set in this Dialog box.
1. Specify the starting address of the area to be filled.
2. Specify the ending address of the area to be filled.
3. Specify the fill data.
4. Select the data length (Byte, Word, or Dword).
5. Click the "OK" button.
To move the contents of a specified area to another area
With the Memory Window or Dump Window active, select the following from the PD79SIM
Window menu:
[ Option] −> [ Debug] −> [ Move... ]
When the Move dialog box opens, enter the starting and ending addresses of the source area and
the starting address of the destination area.
When the Move Dialog Box open after selecting the area by mouse in the Memory Window or in the
Dump Window, the start and end address of the area are set in this Dialog box.
1. Enter the starting address of the source area.
2. Enter the ending address of the source area.
3. Enter the starting address of the destination.
4. Click the "OK" button.
118
Checking and Setting Register Data and Memory Contents
3.7 Updating the Memory Display
When you execute a command (setting, filling, moving memory, stopping execution, or step execution,
etc.) that changes the contents of memory, the memory display in the Memory Window and Dump
Window is automatically updated. However, if an area such as I/O, which is changed without any
relationship to MCU execution, is displayed, there may be a discrepancy between the data displayed
and the actual contents of memory.
In this case, you can display the latest contents of memory in the Memory Window by clicking the
"Refresh" button on the toolbar in the Memory Window, or making the Memory Window the active
window, then selecting the following from the PD79SIM Window menu:
[ Option ] −> [ View ] −> [ Refresh ]
To display the latest contents of memory in the Dump Window, click the "Refresh" button on the
toolbar in the Dump Window, or make the Dump Window the active window, then select the following
from the PD79SIM Window menu:
[ Option ] −> [ View ] −> [ Refresh ]
3.8 Checking and Changing Memory Map Data
Execute the map command (MAP) from the Script Window to check memory map data. For details of
using script commands, see Section 7.1, "Executing Script Commands" in the Basic Operation part.
To check memory map data
Simply enter the MAP command. Memory map data is then displayed in the Script Window.
>MAP
To change memory map data
Enter the following to map memory space from address F1000016 to F1100016:
>MAP F10000, F11000
The PD79SIM simulator divides the memory space between 00000016 and FFFFFF16 into sixteen
parts, so that memory can be in 64KB blocks. The above command therefore maps memory form
F1000016 to F1FFFF16.
Note:
Memory that has been mapped cannot be deleted.
3.9 To change the acquisition mode of the memory
The Memory Window and the Dump Window have internal cache storing the 512 Kbytes memory
data for quick displaying.
When the window is resized or scrolled within this 512 Kbytes memory area, the memory of the area
is not accessed.
To disable this caching, click the Cache button or select the menu [Option] -> [CacheOn].
When the memory cache is disabled, the memory out of the display is not accessed and if the display
area changes by scrolling and resizing the memory is accessed.
119
P D 7 9 S I M U s e r ’s M a n u a l
4 Software Breaks
Use a software break to break target program execution at a specified line (address). Use the S/W
Break Point Setting dialog box to set a software break point. When you set a software break,
execution of the target program stops immediately before the software break point.
l
l
You can set up to 64 software break points.
If you set multiple software break points, the target program stops as soon as execution
reaches any of the software break addresses.
4.1 Opening the S/W Break Point Setting Dialog Box
Click the "SW" button on the PD79SIM Window toolbar. Press function key F7 to open the software
breakpoint setting dialog box.
Click the “SW” button.
You can also open the S/W Break Point Setting dialog box by selecting the following from the
PD79SIM Window menu:
[Debug] −> [Break Point] −> [S/W Break Point...]
See Section 1.19, "S/W Break Point Setting Dialog Box" in the Introduction for the structure of the
S/W Break Point Setting dialog box.
120
Software Breaks
4.2 Setting a Break Point
To specify an address as a break point
In the S/W Break Point Setting dialog box, specify an address or label in the Address field, as
follows:
2. Specify the address.
1. Click the “Address” button.
3. Click the “Add” button.
4. Click the “Close” button.
To specify a line No. as a break point
In the S/W Break Point Setting dialog box, specify a filename and a line No, as follows:
1. Click the “Filename” button.
4. Click the “Add” button.
2. Specify the filename.
5. Click the “Close” button.
3. Specify the line No.
121
P D 7 9 S I M U s e r ’s M a n u a l
4.3 Deleting a Break Point
In the S/W Break Point Setting dialog box, delete the break point as follows:
3. Click the “Close” button.
2. Click the”Del” button.
1. Click the break point to be deleted.
*Click “DelAll” to delete all break points.
You can also click the breakpoint to be deleted, then press the Delete key.
4.4 Temporarily Disabling Break Points
In the S/W Break Point Setting dialog box, disable the break point as follows:
3. Click the “Close” button.
1. Click the break point to be disabled.
2. Click the “Disable” button.
*Click “AllDisable” to disable all break points.
You can also double-click the breakpoint to be disabled. (An asterisk (*) is displayed).
122
Software Breaks
4.5 Temporarily Enabling Break Points
In the S/W Break Point Setting dialog box, enable the break point as follows:
3. Click the “Close” button.
1. Click the break point to be enabled.
2. Click the “Enable” button.
*Click “AllEnable” to enable all break points.
You can also double-click the breakpoint to be enabled. (An asterisk (*) is deleted).
4.6 Setting a Break Point from Program (Source) Window
You can also set break points in the Program or Source Window. To do so, double-click the break
point setting display area (BRK column) (indicated by "-") for the line in which you want to set the
break.
Double-click here.
Lines in which a software break point have been set are marked by a "B" in place of the"-" in the
break point setting display area (BRK column). You can delete the break point by double-clicking
again in the BRK column.
123
P D 7 9 S I M U s e r ’s M a n u a l
4.7 Setting Breakpoints from the Toolbar
You can set breakpoints from the toolbar in the PD79SIM Window. In the Program (Source)
Window, click the program display area of the line in which you want to set the break (lines for
which "-" is displayed in the corresponding breakpoint display area).
To set the breakpoint, click the "Break" button in the PD79SIM Window toolbar.
Click the “Break” button.
You can also set a breakpoint by selecting the following from the PD79SIM Window menu:
[Debug] −> [Break Point] −> [Break]
The mark on the lines set as software breakpoints changes from "-" to "B" in the breakpoint display
area of the window. You can cancel a software breakpoint by again clicking the line indicated by "B"
then clicking the "Break" button.
4.8 Saving Breakpoints
Click on the Save button in the S/W breakpoint setup dialog box to bring up a file select dialog box.
When this dialog box appears, specify a file name in which you want software breakpoints to be saved.
If a file name extension is omitted, an extension ".brk" is automatically added.
4.9 Loading Saved Breakpoints
To load the saved breakpoints from a file, click on the Load button in the S/W breakpoint setup
dialog box. When a file select dialog box appears, specify the file you want to be loaded. The
breakpoints read from the file are added to the currently set breakpoints. If the total number of
software breakpoints exceeds 64, the 65th and following breakpoints are ignored.
124
Hardware Breaks
5 Hardware Breaks
Use hardware breaks to break target program execution when memory is accessed. Use the H/W
Break Point Setting dialog box to set a hardware break point. Hardware breaks are effected when
data is written to or read from memory, or an instruction is fetched.
l
l
You can set up to 64 hardware break points.
If you set multiple hardware break points, the target program stops as soon as execution
reaches any of the hardware break addresses.
5.1 Opening the H/W Break Point Setting Dialog Box
Click the "HW" button on the PD79SIM Window toolbar. Press function key Shift + F7 to open the
hardware breakpoint setting dialog box.
Click the “HW” button.
You can also open the H/W Break Point Setting dialog box by selecting the following from the
PD79SIM Window menu:
[Debug] −> [Break Point] −> [H/W Break Point...]
See Section 1.20, "H/W Break Point Setting Dialog Box" in the Introduction for the structure of the
S/W Break Point Setting dialog box.
125
P D 7 9 S I M U s e r ’s M a n u a l
5.2 Setting Hardware Breakpoints
To break when the instruction at a specified address is executed
The following example shows how to break when the instruction at address F000316 is executed.
Make the following settings in the H/W Break Point setting dialog box.
1. Select “Enable”.
2. Enter address “F0003”.
3. Select “Fetch”.
4. Click the “Add” button.
5. Click the “Close” button.
To break when data is read from the specified address
The following example shows how to break when data has been read twice from address 40016.
Make the following settings in the H/W Break Point setting dialog box.
1. Select “Enable”.
.2. Enter address “400”.
3. Select “Read”.
4. Enter a pass count of “2”.
5. Click the “Add” button.
6. Click the “Close” button.
126
Hardware Breaks
To break when the specified data is read from the specified address
The following example shows how to break when the specified data (1216) has been read twice
from address 40E16. Make the following settings in the H/W Break Point setting dialog box.
1. Select “Enable”.
2. Enter address “40E”.
3. Select “Read”.
4. Enter a pass count of “2”.
5. Deselect “Not Specify”.
6. Enter data “12”.
7. Select “==”.
8. Click the “Add” button.
9. Click the “Close” button.
To break when data is written to the specified address
The following example shows how to break when the specified data (123416) has been written five
times to address 41016. Make the following settings in the H/W Break Point setting dialog box.
1. Select “Enable”.
2. Enter address “410”.
3. Select “Write”.
4. Enter a pass count of “5”.
5. Select “Word”.
6. Deselect “Not
Specify”.
7. Enter data “1234”.
8. Select “==”.
9. Click the “Add” button.
10. Click the “Close” button.
127
P D 7 9 S I M U s e r ’s M a n u a l
To break when the specified data or greater is written to the specified
address
The following example shows how to break when the specified data (5616) or greater is written to
address 40616. Make the following settings in the H/W Break Point setting dialog box.
1. Select “Enable”.
2. Enter address “406”.
3. Select “Write”.
4. Deselect “Not
Specify”.
5. Enter data “56”.
6. Select “>=”.
7. Click the “Add” button.
8. Click the “Close” button.
To disable a hardware break
The following shows how to disable a hardware break. Make the following settings in the H/W
Break Point dialog box.
1. Select “Disable”.
2. Click the “Close” button.
128
Hardware Breaks
5.3 Deleting a Hardware Breakpoint
Make the following settings in the H/W Break Point dialog box.
2. Click the “Del” button.
1. Click the breakpoint to be
deleted.
3. Click the “Close” button.
*Click the “Del All” button to delete all breakpoints.
You can also click the breakpoint to be deleted, then press the Delete key.
129
P D 7 9 S I M U s e r ’s M a n u a l
6 Checking C Variables
6.1 Checking C Variables
6.1.1 Checking C Variables in Source/Program display
The value of the C variable is displayed, when the mouse cursor stand still (about 0.5 seconds) on the
strings of the variable in the Program display.
The value of the
C variable is
displayed
130
Checking C Variables
6.1.2 Checking C Variables in Cwatch display
PD79SIM has four windows for checking the C variables declared in the target program.
l
Local Window:
l
File Local Window:
l
Global Window:
l
C Watch Window:
The Local Window displays the values of variables that are valid only within a function. To open the
Local Window, select the following from the PD79SIM Window menu:
[ Basic Window ] −> [ C Watch Window ] −> [ Local Window ]
The File Local Window displays the values of variables that are valid only within the file.
To open the File Local Window, select the following from the PD79SIM Window menu:
[ Basic Window ] −> [ C Watch Window ] −> [ File Local Window ]
The Global Window displays the values of global variables. To open the Global Window, select the
following from the PD79SIM Window menu:
[ Basic Window ] −> [ C Watch Window ] −> [ Global Window ]
The C Watch Window displays the values of any variables. To open the C Watch Window, select the
following from the PD79SIM Window menu:
[ Basic Window ] −> [C Watch Window ] −> [C Watch Window ]
You cannot select the referenced C variables in the Local Window, File Local Window, or Global
Window. The variables displayed in the respective windows change with the current position of
execution of the target program.
Local Window
The variables displayed change according to the function currently being executed.
File Local Window
The variables displayed change according to the currently executing source file.
Global Window
This lists the C global variables regardless of the execution position.
Use the C Watch Window to check C variables.
l
l
l
Use the C Watch Window to check C variables.
Note:
There is a possibility that compiler arranges a different variable in the same address for
optimization.
131
P D 7 9 S I M U s e r ’s M a n u a l
To register the C watch point
(Method 1: Registering a C Watch Point from the C Watch Window)
Click the "Add" button on the toolbar in the C Watch Window to open the Add dialog box, then
enter the C language expression (C variables, expressions, etc.). To register a C expression as a
pointer, click the "Add*" button on the toolbar in the C Watch Window. This registers the C
expression as a C watch point.
1. Click the "Add" button to register the C watch point.
1. Click the “Add*” button to register the C watch point as a pointer.
2. Specify the C expression.
3. Click the "OK" button.
(Method 2: Registering a C Watch Point from the Local, File Local, or Global Window)
You can register variables displayed in the Local Window, File Local Window, and Global
Window as C watch points. Click the variable to be registered, then click the "Cwatch" button on
the toolbar. To register the variable as a pointer, click the "Cwatch*" button.
2. Click the “Cwatch” button.
1. Click the C variable to be registered.
Note:
There is a possibility that compiler arranges a different variable in the same address for
optimization.
132
Checking C Variables
6.2 To change the value of a C variable
You can change the values of C variables in the Local Window, File Local Window, Global Window, or
C Watch Window. Click the variable to be changed, then click the "Set" button on the toolbar to open
the Set dialog box. Enter the new value for the variable.
1. Specify the new value.
2. Click the "OK" button.
133
P D 7 9 S I M User's Manual
7 Script Commands
7.1 Executing Script Commands
Script commands are executed from the Script Window. To open the Script Window, select the
following from the PD79SIM Window menu:
[Window] -> [Script Window]
Enter script commands in the Command input area in the Script window. Click the Command input
area to locate the cursor in that field, then enter the script command. After executing the command,
the results are output to the execution result display area.
Execution result display area
Command history display area
/Script file display area
Command input area
To re-execute a previously executed command
The history of command execution is displayed in the command history display area. Double-click
the command you want to execute again.
To quit a script command that is executing
Click the STOP button, which is displayed only while the command is being executed.
134
Script Commands
7.2 Logging the Results of Executing Script
Commands
Use the logging function to log the results of executing script commands. Before executing the script
command, click the "LogOn" button on the toolbar of the Script Window.
Clicking the "LogOn" button opens the File Selection dialog box. Specify the name of the file to be
saved. The default file attribute, if omitted, is ".log".
Click “LogOn” to start logging.
You can also select the following from the PD79SIM Window menu (when the Script Window is
active):
[ Option ] −> [ Log ] −> [ On... ]
l
l
l
If, after starting PD79SIM, you open and close a log file, then re-open it, the new data is
appended to the data already in that file. However, if you re-open a log file that was created
before starting PD79SIM, the contents of that file will be overwritten.
The file list in the File Selection dialog box starts with files with the ".log" attribute. However,
you can enter a full filename (including the attribute) directly into the filename input area to
open a log file with an attribute other than ".log".
You can nest log files up to 8 levels.
To quit logging the results of executing script commands
Click the "LogOff" button on the toolbar of the Script Window.
Click “LogOff” to stop logging.
You can also select the following from the PD79SIM Window menu (when the Script Window is
active):
[ Option ] −> [ Log ] −> [ Off ]
l
When log files are nested, output to the current log file stops, but output to the next higherlevel log file resumes.
135
P D 7 9 S I M User's Manual
To save the results of executing script commands after execution
PD79SIM has a View Buffer that stores the results of executing the last 1000 lines of command
results. To save the contents of the view buffer, click "View" on the toolbar of the Script Window.
Clicking "View" opens the File Selection dialog box. Specify the name of the file to be saved. The
default file attribute, if omitted, is ".viw".
Click “View” to save the contents of the view buffer.
You can also select the following from the PD79SIM Window menu (when the Script Window is
active):
[ Option] −> [ View ] −> [ Save... ]
l
l
When you specify an existing filename, the contents of the view buffer are appended to the
existing file.
The file list in the File Selection dialog box starts with files with the ".viw" attribute. However,
you can enter a full filename (including the attribute) directly into the filename input area to
open a view file with an attribute other than ".viw".
To clear the results of execution from the screen
Click the "Clear" button on the menu in the Script Window to clear the contents of the command
display.
Note that the contents of the View buffer are cleared at the same time as the command display.
Click the “Clear” button to clear the command display.
You can also select the following from the PD79SIM Window menu (when the Script Window is
active):
[ Option ] −> [ View ] −> [ Clear ]
136
Script Commands
To record the executed commands…
PD79SIM have the function recording the history of executed commands to a file.
This function records not the result but only the executed commands, so the saved files can be used
as the script files.
To record the executed commands, click the "RecOn" button in the Script Window toolbar.
Clicking "RecOn" opens the File Selection dialog box. Specify the name of the file to be
saved. The default file attribute, if omitted, is ".scr".
Click “RecOn” to record the executed commands.
You can also select the following from the PD79SIM Window menu (when the Script
Window is active):
[ Option ] −> [ Record ] −> [ On...]
l
The file list in the File Selection dialog box starts with files with the ".scr" attribute.
However, you can enter a full filename (including the attribute) directly into the
filename input area to open a view file with an attribute other than ".scr".
To stop recording the executed commands…
To stop recording the executed commands, click the "RecOff" button in the Script Window toolbar.
Clicking the "RecOff" button make the commands saved file closed.
Click “RecOff” to stop recording the executed commands
You can also select the following from the PD79SIM Window menu (when the Script
Window is active):
[ Option ] −> [ Record ] −> [ Off...]
137
P D 7 9 S I M User's Manual
7.3 Executing Script Commands in Batch Mode
You can execute script commands in batches. To do so, use an editor to write the commands to be
executed in a script file. Script files take the ".scr" attribute.
Script files are opened from the Script Window. Click the "Open" button on the Script Window
toolbar.
When the file selection dialog box opens, select the script file to be executed.
Click the “Open” button to open a script file.
You can also select the following from the PD79SIM Window menu (when the Script Window is
active):
[ Option ] −> [ Script ] −> [ Open... ]
l
l
The file list in the File Selection dialog box starts with files with the ".scr" attribute. However,
you can enter a full filename (including the attribute) directly into the filename input area to
open a script file with an attribute other than ".scr".
You can nest script files up to 5 levels.
When a script file is read in, the command history display in the Script Window changes into the
script file display.
To execute the contents of the script file as a batch, click "Run" on the toolbar of the Script Window.
Batch execution starts and the script file is then closed after all the commands have been executed.
Click the “Run” button to execute all the commands in the script file in batch mode.
You can also select the following from the PD79SIM Window menu (when the Script Window is
active):
[ Option ] −> [ Script ] −> [ Run ]
To stop execution of a script file
Click the STOP button displayed in the Running script dialog box.
Execution of the script file stops before the next line.
138
Script Commands
To independently execute each command in a script file
Click the "Step" button on the Script Window toolbar (for step execution of the script).
A command is executed each time you click the "Step" button.
Click the "Step" button for step execution of the script file.
You can also select the following from the PD79SIM Window menu (when the Script Window is
active):
[ Option ] −> [ Script ] −> [ Step ]
To close a script file
Click the "Close" button on the Script Window toolbar.
Click the "Close" button to close the script file.
You can also close a script file by selecting the following (when the Script Window is active) from
the PD79SIM Window menu:
[ Option ] −> [ Script ] −> [ Close ]
l
If the script files are nested, the current script file is closed and the next higher level script file
is opened.
To execute a script file on PD79SIM startup
Specify the name of the script file to be executed on startup in the Init dialog box which is displayed
when you start PD79SIM.
Specify the name of the script file to be
executed on startup.
139
P D 7 9 S I M User’s manual
8 Exiting PD79SIM
8.1 Exiting PD79SIM
Select the following from the PD79SIM Window menu:
[ File ] −> [ Exit ]
A confirmation dialog box is displayed. Click OK to exit.
Click the "OK" button.
140
Miscellaneous
9 Miscellaneous
9.1 Line Assemble
There are two methods for line-assembling the source program, one using a line assemble dialog box
and one using a script command.
9.1.1 Line Assembling from Dialog Box
Click on a position in the Program (Source) Window that you want to be line-assembled and choose
menus [Option] −> [Line Assemble]. A line assemble dialog box like the one shown below will appear.
(If you do not specify a position, input the desired address in this dialog box after it is open.)
Warning output
NOP insertion
Address input field
Code input field
X flag
M flag
Program display area
l
l
l
l
Input the address you want to be line-assembled and the assemble instruction in the address
input and the code input fields, then hit the return key. The line that is highlighted in the
program display area of this dialog box is the address to be line-assembled.
−
If the number of instruction bytes input is fewer than that of instruction bytes before the
change, insert a NOP instruction to make the number of bytes matched.
−
If the number of instruction bytes input is greater than that of instruction bytes before
the change, a warning dialog box is opened. Press the OK button in this dialog box and
the instruction you have input will be written to the program. If you press the Cancel
button, PD79SIM abandons writing the instruction.
If NOP insertion is turned off, no NOP instruction is inserted even when the number of
instruction bytes input is fewer than that of instruction bytes before the change.
If warning output is turned off, the instruction you have input is forcibly written to the
program without bringing up a warning dialog box.
By clicking on a line in the program display area of this dialog box, you can choose the line to
be line-assembled.
141
PD79SIM User's Manual
9.1.2 Line Assembling from Assemble Command
Execute the assemble command (Assemble(A)) from the Script Window for line assembling. Specify
the address for line assembling after the command.
>Assemble assemble-address
On execution of the Assemble command, the command input area of the Script Window changes to a
mnemonic input field.
See Section 7.1, "Executing Script Commands" in the Basic Operation for details of how to use script
commands. Enter the mnemonic for line assembling. The following shows the Script Window when
waiting for a mnemonic to be input.
Mnemonic input field
To exit the line assemble mode
Specify "Enter" in the mnemonic input area. The Script Window changes back to the status in
which it waits for a script command to be entered.
142
Miscellaneous
9.2 Starting Up Make
The operation conventionally used to Make the target program after entering commands from the
DOS window can be performed from PD79SIM.
The following shows the procedure for performing Make in PD79SIM.
1.
Create a pif file.
Follow the procedure below to create the pif file.
(a) Create a keyboard shortcut for command.com located in the Windows directory.
(b) For the keyboard shortcut thus created, assign a file name xxxx.pif (xxxx denotes a name
specified by the user) and copies the file into the directory that contains makefile. This file
becomes a pif file. Don't specify a suffix (.pif), when changing a file name.
(c) Open a property dialog box for this file and input the same command in the command line of
this dialog box that was input from the DOS window.
Input a command line
Uncheck
To open the property dialog box, choose [Property] from the menu that is displayed when you
click the right mouse button after selecting a pif file using the explorer, etc.
143
PD79SIM User's Manual
2.
Register the pif file in PD79SIM.
Choose menus [Debug] −> [Entry] to bring up the dialog box shown below.
to register the pif file.
Use this dialog box
Input the directory to
which the pif file has been
copied.
Input a pif file name.
3.
Start up Make.
When you choose menus [Debug] −> [Make], the contents specified by the pif file are executed.
9.3 Searching for Character Strings in Target
Program
You can search for character strings in the target program when the Program Window or Source
Window is active. Make sure the target Program or Source Window is active, then select the following
from the PD79SIM Window menu:
[ Edit ] −> [ Find... ]
The Find dialog box is displayed. Enter the search string, then click "Find Next" to start the search.
3. Check here to include wildcards in the search string.
1. Specify the search string.
4. Click "Down" to search the program forwards,
or "Up" to search backwards.
5. Click "Find Next" to start the search.
2. Check here if you want to differentiate between uppercase and lowercase letters.
144
Miscellaneous
9.4 Changing Window Proportions
You can change the proportions of the Program Window, Source Window, Memory Window and ASM
Watch Window using the mouse as described below.
l
Program Window and Source Window
When in disassemble display mode, you can change the relative proportions of the object
code display area (<Objcode>) and the two parts (<Label> and <Mnemonic>) of the Program
display area.
Drag to resize.
l
Memory Window
You can change the relative proportions of the label display area (<LABEL>) and the
memory content display area (<DATA>).
Drag to resize.
l
ASM Watch Window
You can change the relative proportion of the expression display area (<Expr>).
Drag to resize.
l
Coverage Window
You can change the relative proportion of the function name display area (<Function>).
Drag to resize.
145
PD79SIM User's Manual
9.5 Switching Over Active Windows
PD79SIM requires that the window to be operated on is active. In addition to using the mouse to
switch over the active windows by clicking on a desired window, you can switch over the active windows
from the keyboard.
To switch over the active windows from the keyboard, enter the keys as follows:
[Ctrl] + [TAB]
Hold down the Shift key while you enter the above keys, and the active windows will be switched over
in reverse order.
9.6 Displaying the Version of PD79SIM
Select the following from the PD79SIM Window menu:
[ Help ] −> [ About... ]
The About dialog box, which shows the PD79SIM version is displayed.
PD79SIM Version
Press "OK" to close the About dialog box.
9.7 To Configure the operation of the PD79SIM
Select the following from the PD79SIM Window menu:
[ Environ ] −> [ Customize…]
The Customize dialog box, to configure the operation of the PD79SIM.
l
l
l
l
Open the confirmation dialog box, when exit.
Exit debugger, when the error occurs.
Display full-path name in Program/Source Window.
Try to change your selected display mode on the program window, when stop.
146
Miscellaneous
9.8 To Open the Editor
The following show how to open the editor which you usually use.
1. Registering the Editor
Select the pop-up menu [Entry Editor] in the Program window and specify the editor program and
their parameters in the following dialog box.
You can specify the parameters of %F as the file name and %L as the line number to the editor if
the editor is possible.
About parameters of the editor you use, refer the manual of the editor.
Specify the editor.
Specify the parameter.
2. Opening the Editor
Select the pop-up menu [Open Editor] in the program window.
147
PD79SIM User's Manual
[ MEMO ]
148
High-end Debugging
149
150
Setting Virtual Port Inputs in I/O Window
1 Setting Virtual Port Inputs in I/O Window
1.1 Overview
The Virtual Port Input function allows you to simulate data inputs and similar other operations
performed on the ports defined in the SFR.
Data can be input to memory at one of the following timings:
1.
If you want data to be input to some memory location with the lapse of time
Data can be input when program execution has reached a specified number of cycles.
In this case, set cycle-synchronized inputs.
2.
If you want data to be input when some memory location is read
Data can be input when the program accesses a specified memory location for read. For
example, this method can be used in cases where you want a variable (e.g., global variables
located at fixed addresses) to be assigned a value when it is read.
In this case, set read access-synchronized inputs.
3.
If you want data to be input when some virtual interrupt occurs
Data can be input when a specified virtual interrupt is generated. For example, this method
can be used in cases where memory for the SFR is referenced in an interrupt handler.
In this case, set interrupt-synchronized inputs.
1.2 Setting Cycle-synchronized Inputs
To set cycle-synchronized virtual port inputs, choose the I/O Window menus [Option] −> [Setup] (or
the Setup button). The dialog box shown below will appear.
Set this item.
151
P D 7 9 S I M U s e r ’s M a n u a l
Here, choose the item Set Virtual Port Input and press the Next button. (Or press the Cancel button
if you want cancel the setup session and close the dialog box.) A dialog box for setting up virtual port
input timings will appear.
Expressions can
be input here.
First, choose Cycle in the Data Input Timing column. Next, enter an address for virtual port input
in the Input Address column (the address to which you want data to be input) using a hexadecimal
number. Then enter the cycles at which you want the virtual port input to be started and ended for
Start cycle and End cycle, respectively, using decimal numbers. Then press the Next button. (Or
press the Prev button here if you want to return to the previous dialog box.)
152
Setting Virtual Port Inputs in I/O Window
A matrix dialog box for setting the virtual port input data will appear.
Finds the previous
data you've set (UP)
or the next data
(DOWN).
The setup example
in this element
specifies that "data
0x22 be set at the
10,016th cycle".
Double-click on an
element you want
and set the desired
input value in it.
In this dialog box, set the data you want to be actually input to memory.
Follow the procedure below to set data:
1. Move the mouse cursor to the "cycles" location (called an element) where you want data to be
set, then double-click the left mouse button. (Or you can scroll the screen to go to the
desired location.)
2. Input data in the selected place using a hexadecimal number. The data size that can be
input is one byte (from 0x0 up to 0xFF).
3. Repeat steps 1 and 2 as many times as the number of data you want to set.
When you finished entering all data, press the Next button.
A dialog box for saving the virtual port input data you've set to a file (virtual port input file) will
appear.
153
P D 7 9 S I M U s e r ’s M a n u a l
Here, enter the directory and file names in which you want the data you've set to be saved. The
saved file can be loaded into PD79SIM back again by using the I/O Window menus [Option] −> [Load]
(or the Load button).
When you've input a file name, press the Save button.
Thus, you've finished setting the cycle-synchronized virtual port inputs.
1.3 Setting Read Access-synchronized Inputs
To set read access-synchronized virtual port inputs, choose the I/O Window menus [Option] −>
[Setup] (or the Setup button). The dialog box shown below will appear.
Set this item.
Here, choose the item Set Virtual Port Input and press the Next button. (Or press the Cancel button
if you want cancel the setup session and close the dialog box.) A dialog box for setting up virtual port
input timings will appear.
Expressions can
be input here.
First, choose Read Access in the Data Input Timing column. Next, enter an address for virtual port
input in the Input Address column (the address to which you want data to be input) using a
hexadecimal number. Then enter the address to be accessed for read (to read data from memory) in
the Read Address column. (Virtual port inputs are executed when the memory address you've
specified here is accessed for read.)
Then press the Next button. (Or press the Prev button here if you want to return to the previous
dialog box.)
154
Setting Virtual Port Inputs in I/O Window
A matrix dialog box for setting the virtual port input data will appear.
Read access counts
Finds the previous
data you've set (UP)
or the next data
(DOWN).
The setup example
in this element
specifies that "data
0x90 be set when
memory is
accessed for read
9 times".
Double-click on an
element you want
and set the desired
input value in it.
In this dialog box, set the data you want to be actually input to memory.
Follow the procedure below to set data:
1. Move the mouse cursor to the "read access counts" location (called an element) where you
want data to be set, then double-click the left mouse button. (Or you can scroll the screen to
go to the desired location.)
2. Input data in the selected place using a hexadecimal number. The data size that can be
input is one byte (from 0x0 up to 0xFF).
3. Repeat steps 1 and 2 as many times as the number of data you want to set.
When you finished entering all data, press the Next button.
A dialog box for saving the virtual port input data you've set to a file (virtual port input file) will
appear.
155
P D 7 9 S I M U s e r ’s M a n u a l
Here, enter the directory and file names in which you want the data you've set to be saved. The
saved file can be loaded into PD79SIM back again by using the I/O Window menus [Option] -> [Load]
(or the Load button).
When you've input a file name, press the Save button.
Thus, you've finished setting the read access-synchronized virtual port inputs.
1.4 Setting Interrupt-synchronized Inputs
To set interrupt-synchronized virtual port inputs, choose the I/O Window menus [Option] −> [Setup]
(or the Setup button). The dialog box shown below will appear.
Set this item.
Here, choose the item Set Virtual Port Input and press the Next button. (Or press the Cancel button
if you want cancel the setup session and close the dialog box.) A dialog box for setting up virtual port
input timings will appear.
Expressions can
be input here.
First, choose Interrupt in the Data Input Timing column. Next, enter an address for virtual port
input in the Input Address column (the address to which you want data to be input) using a
hexadecimal number. Then enter the vector address of a virtual interrupt that signals timing for
virtual port input in the Vector column. (Or press the Prev button here if you want to return to the
previous dialog box.)
156
Setting Virtual Port Inputs in I/O Window
A matrix dialog box for setting the virtual port input data will appear.
Virtual interrupt counts
Finds the previous
data you've set (UP)
or the next data
(DOWN).
The setup example
in this element
specifies that "data
0xFF be set when
virtual interrupt
occurs 7 times".
Double-click on an
element you want
and set the desired
input value in it.
In this dialog box, set the data you want to be actually input to memory.
Follow the procedure below to set data:
1. Move the mouse cursor to the "virtual interrupt counts" location (called an element) where
you want data to be set, then double-click the left mouse button. (Or you can scroll the
screen to go to the desired location.)
2. Input data in the selected place using a hexadecimal number. The data size that can be
input is one byte (from 0x0 up to 0xFF).
3. Repeat steps 1 and 2 as many times as the number of data you want to set.
When you finished entering all data, press the Next button.
A dialog box for saving the virtual port input data you've set to a file (virtual port input file) will
appear.
157
P D 7 9 S I M U s e r ’s M a n u a l
Here, enter the directory and file names in which you want the data you've set to be saved. The
saved file can be loaded into PD79SIM back again by using the I/O Window menus [Option] −> [Load]
(or the Load button).
When you've input a file name, press the Save button.
Thus, you've finished setting the virtual interrupt-synchronized virtual port inputs.
158
Setting Virtual Port Outputs in I/O Window
2 Setting Virtual Port Outputs in I/O Window
2.1 Overview
The Virtual Port Output function allows data values written to some memory address by a program to
be recorded along with cycles at which data was written. The recorded data can be displayed for
verification in graphic or numeric form.
The maximum number of data that can be recorded by this function is 30,000 entries counted from
the beginning of program execution.
2.2 Setting Virtual Port Outputs
To set virtual port outputs, choose the I/O Window menus [Option] −> [Setup] (or the Setup button).
The dialog box shown below will appear.
Select this item.
159
P D 7 9 S I M U s e r ’s M a n u a l
Here, choose the item Set Virtual Port Output and press the Next button. (Or press the Cancel
button if you want cancel the setup session and close the dialog box.) A dialog box for setting the
address you want to be monitored for virtual port output will appear.
Input the
address you
want to be
monitored for
output.
Input the address you want to be monitored for virtual port output in the Output Address column.
Then press the Next button.
A dialog box for specifying a file (virtual port output file) to which you want the virtual port output
results to be saved (recorded) will appear. (PD79SIM saves the virtual port output results that have
occurred during program execution to this file and references it when the program stops running.)
Here, input the directory and file names in which you want the virtual port output file to be saved.
When you've input a file name, press the Save button.
Thus, you've finished setting virtual port outputs.
160
Setting Virtual Interrupts in I/O Window
3 Setting Virtual Interrupts in I/O Window
3.1 Overview
The Virtual Interrupt function allows you to generate interrupts in a simulated manner without
having to actually generate them. Using this function you can generate timer interrupts or AD
conversion interrupts in a simulated manner.
Virtual interrupts can be generated at one of the following timings:
1.
If you want virtual interrupts to be generated with the lapse of time
Virtual interrupts can be generated when program execution has reached a specified
number of cycles.
In this case, set cycle-synchronized interrupts.
2.
If you want virtual interrupts to be generated when the program executes a specified
address
Use this method if you want virtual interrupts to be generated when some specific function
is executed.
In this case, set executed address-synchronized interrupts.
3.2 Setting Cycle-synchronized Interrupts
To set cycle-synchronized virtual interrupts, choose the I/O Window menus [Option] −> [Setup] (or
the Setup button). The dialog box shown below will appear.
Select this item.
161
P D 7 9 S I M U s e r ’s M a n u a l
Here, choose the item Set Virtual Interrupt and press the Next button. (Or press the Cancel button
if you want cancel the setup session and close the dialog box.) A dialog box for setting up virtual
interrupt timings will appear.
Expression can
be input here.
First, choose Cycle in the Interrupt Generation Timing column. Next, specify the cycles at which
you want a virtual interrupt to be started and ended for Start cycle and End cycle, respectively, using
decimal numbers. Then specify the vector address of the virtual interrupt to be generated in
hexadecimal and the interrupt priority in decimal for Vector and Priority, respectively. Then press
the Next button. (Or press the Prev button here if you want to return to the previous dialog box.)
162
Setting Virtual Interrupts in I/O Window
A matrix dialog box for setting virtual interrupts will appear.
Finds the previous
data you've set (UP)
or the next data
(DOWN).
The setup example
in this element
specifies that
"virtual interrupt
be generated at
the 10,007th
cycle".
Point to the desired
element and click
the mouse button.
The selected
element is marked
by an asterisk (*).
In this dialog box, set the virtual interrupts you want to be actually generated.
Follow the procedure below to set virtual interrupts:
1. Move the mouse cursor to the "cycles" location (called an element) where you want a virtual
interrupt to be generated, then click the left mouse button. (Or you can scroll the screen to
go to the desired location.)
2. The element is marked by an asterisk (*) when you've clicked. Click at the same place again
if you want the virtual interrupt you've set to be canceled. In this case, the asterisk goes
out.
3. Repeat steps 1 and 2 as many times as the number of virtual interrupts to be generated.
When you finished setting all virtual interrupts, press the Next button.
A dialog box for saving the virtual interrupts you've set to a file (virtual interrupt file) will appear.
163
P D 7 9 S I M U s e r ’s M a n u a l
Here, enter the directory and file names in which you want the data you've set to be saved. The
saved file can be loaded into PD79SIM back again by using the I/O Window menus [Option] −> [Load]
(or the Load button).
When you've input a file name, press the Save button.
Thus, you've finished setting cycle-synchronized virtual interrupts.
3.3 Setting Executed Address-synchronized Interrupts
To set executed address-synchronized virtual interrupts, choose the I/O Window menus [Option]
−> [Setup] (or the Setup button). The dialog box shown below will appear.
Select this item.
Here, choose the item Set Virtual Interrupt and press the Next button. (Or press the Cancel button
if you want cancel the setup session and close the dialog box.) A dialog box for setting up virtual
interrupt timings will appear.
Expression can
be input here.
First, choose Executed Address in the Interrupt Generation Timing column. Next, specify the
executed address (i.e., the address at which a virtual interrupt is generated when it is executed) for
Executed Address. Then specify the vector address of the virtual interrupt to be generated in
hexadecimal and the interrupt priority in decimal for Vector and Priority, respectively. Then press
the Next button. (Or press the Prev button here if you want to return to the previous dialog box.)
164
Setting Virtual Interrupts in I/O Window
A matrix dialog box for setting virtual interrupts will appear.
Finds the previous
data you've set (UP)
or the next data
(DOWN).
The setup example in
this element specifies
that "virtual
interrupt be
generated when a
specified address is
executed 7 times".
Point to the desired
element and click
the mouse button.
The selected
element is marked
by an asterisk (*).
In this dialog box, set the virtual interrupts you want to be actually generated.
Follow the procedure below to set virtual interrupts:
1. Move the mouse cursor to the "cycles" location (called an element) where you want a virtual
interrupt to be generated, then click the left mouse button. (Or you can scroll the screen to
go to the desired location.)
2. The element is marked by an asterisk (*) when you've clicked. Click at the same place again
if you want the virtual interrupt you've set to be canceled. In this case, the asterisk goes
out.
3. Repeat steps 1 and 2 as many times as the number of virtual interrupts to be generated.
When you finished setting all virtual interrupts, press the Next button.
A dialog box for saving the virtual interrupts you've set to a file (virtual interrupt file) will appear.
Here, enter the directory and file names in which you want the data you've set to be saved. The
saved file can be loaded into PD79SIM back again by using the I/O Window menus [Option] −> [Load]
(or the Load button).
When you've input a file name, press the Save button.
Thus, you've finished setting executed address-synchronized virtual interrupts.
165
P D 7 9 S I M U s e r ’s M a n u a l
4 Other Functions of I/O Window
4.1 Changing Setup Data of Virtual Port Inputs and Virtual
Interrupts
The data for virtual port inputs or virtual interrupts you've set using the Setup menu can be changed.
4.1.1 Changing Setup Data of Virtual Port Inputs
To change the setup data, choose the menus [Option] −> [Modify] (or the Modify button).
box like the one shown below will appear.
Select this item.
166
A dialog
Other Functions of I/O Window
Here, choose the item Modify Virtual Port Input and press the Next button. (Or press the Cancel
button if you want cancel the session and close the dialog box.) A dialog box for selecting the virtual
port input whose settings you want to be changed will appear.
First, choose the type of virtual port input you want to be changed in the Data Input Timing column.
When selected, the currently set virtual port inputs are listed in the Select Data column. Here,
choose the virtual port input you want to be changed. Then press the Next button. (Or press the
Prev button here if you want to return to the previous dialog box.)
167
P D 7 9 S I M U s e r ’s M a n u a l
A matrix dialog box for changing virtual port inputs will appear.
Here, change the data for the selected virtual port input as necessary. Data can be changed in the
same way that data is set. (Refer to Section 1., "Setting Virtual Port Inputs in I/O Window.")
After changing the data, press the Next button.
A dialog box for saving the virtual port input data you've set (virtual port input file) will appear.
Here, enter the directory and file names in which you want the data you've set to be saved. The
saved file can be loaded into PD79SIM back again by using the I/O Window menus [Option] −> [Load]
(or the Load button).
When you've input a file name, press the Save button.
Thus, you've finished changing virtual port input data.
168
Other Functions of I/O Window
4.1.2 Changing Setup Data of Virtual Interrupts
To change the setup data, choose the menus [Option] −> [Modify] (or the Modify button).
box like the one shown below will appear.
A dialog
Select this item.
Here, choose the item Modify Virtual Interrupt and press the Next button. (Or press the Cancel
button if you want cancel the session and close the dialog box.) A dialog box for selecting the virtual
interrupt whose settings you want to be changed will appear.
First, choose the type of virtual interrupt you want to be changed in the Interrupt Generation Timing
column. When selected, the currently set virtual interrupts are listed in the Select Data column.
Here, choose the virtual interrupt you want to be changed. Then press the Next button. (Or press
the Prev button here if you want to return to the previous dialog box.)
169
P D 7 9 S I M U s e r ’s M a n u a l
A matrix dialog box for changing virtual interrupts will appear.
Here, change the data for the selected virtual interrupt as necessary. Data can be changed in the
same way that data is set. (Refer to Section 3., "Setting Virtual Interrupts in I/O Window.")
After changing the data, press the Next button. A dialog box for saving the virtual interrupt data
you've set (virtual interrupt file) will appear.
Here, enter the directory and file names in which you want the data you've set to be saved. The
saved file can be loaded into PD79SIM back again by using the I/O Window menus [Option] −> [Load]
(or the Load button).
When you've input a file name, press the Save button.
Thus, you've finished changing virtual interrupt data.
170
Other Functions of I/O Window
4.2 Deleting Virtual Port Inputs, Virtual Port Outputs,
Virtual Interrupts, or I/O Script Files Set
The virtual port inputs, virtual port outputs, virtual interrupts, or I/O script files you've set using the
Setup menu can be deleted.
To delete one of these settings, choose the menus [Option] -> [Delete] (or the Delete button). A
dialog box like the one shown below will appear.
l
l
l
l
To delete virtual port inputs that have been set, choose Delete Virtual Port Input.
To delete virtual port outputs that have been set, choose Delete Virtual Port Output.
To delete virtual interrupts that have been set, choose Delete Virtual Interrupt.
To delete I/O script files that have been set, choose Delete I/O Script File.
When you've selected one, follow the procedure below to delete.
171
P D 7 9 S I M U s e r ’s M a n u a l
4.2.1 Deleting Virtual Port Input
After selecting Delete Virtual Port Input, press the Next button to bring up the dialog box shown
below.
First, choose the type of virtual port input you want to be deleted in the Data Input Timing column.
When selected, the currently set virtual port inputs are listed in the Select Data column. Here,
choose the virtual port input you want to be deleted. Then press the Delete button. (Or press the
Prev button here if you want to return to the previous dialog box.) Thus, the virtual port input is
deleted.
Press the Close button to close the dialog box.
172
Other Functions of I/O Window
4.2.2 Deleting Virtual Port Output
After selecting Delete Virtual Port Output, press the Next button to bring up the dialog box shown
below.
Here, choose the virtual port output you want to be deleted. Then press the Delete button. (Or
press the Prev button here if you want to return to the previous dialog box.) Thus, the virtual port
output is deleted.
Press the Close button to close the dialog box.
173
P D 7 9 S I M U s e r ’s M a n u a l
4.2.3 Deleting Virtual Interrupt
After selecting Delete Virtual Interrupt, press the Next button to bring up the dialog box shown
below.
First, choose the type of virtual interrupt you want to be deleted in the Interrupt Generation Timing
column. When selected, the currently set virtual interrupts are listed in the Select Data column.
Here, choose the virtual interrupt you want to be deleted. Then press the Delete button. (Or press
the Prev button here if you want to return to the previous dialog box.) Thus, the virtual interrupt is
deleted.
Press the Close button to close the dialog box.
174
Other Functions of I/O Window
4.2.4 Deleting I/O Script File
After selecting Delete I/O Script File, press the Next button to bring up the dialog box shown below.
Here, choose the I/O script file you want to be deleted from registration. Then press the Delete
button. (Or press the Prev button here if you want to return to the previous dialog box.) Thus, the
I/O script file is deleted.
Press the Close button to close the dialog box.
175
P D 7 9 S I M U s e r ’s M a n u a l
4.3 Changing Display Mode of Virtual Port Input, Virtual Port
Output, or Virtual Interrupt
The display modes of the virtual port inputs, virtual port outputs, or virtual interrupts you've set
using the Setup menu can be changed.
To change the display modes, choose the menus [Option] −> [Mode] (or the Mode button). A dialog
box like the one shown below will appear.
The following explains how to change each display mode.
4.3.1 Changing Display Mode of Virtual Port Input
1.
2.
3.
For cycle-synchronized inputs
Choose Cycle in the Select Input Display Mode column. Then choose the desired display
mode in the Style column.
l
Choose Chart if you want the selected input to be displayed in chart mode.
l
Choose Hex if you want the selected input to be displayed in hexadecimal mode.
l
Choose Graph if you want the selected input to be displayed in graphic mode.
For read access-synchronized inputs
Choose Read Access in the Select Input Display Mode column.
For interrupt-synchronized inputs
Choose Interrupt in the Select Input Display Mode column.
4.3.2 Changing Display Mode of Virtual Port Output
Choose your desired display mode from Style in the Select Output Display Mode column.
l
Choose Chart if you want the selected output to be displayed in chart mode.
l
Choose Hex if you want the selected output to be displayed in hexadecimal mode.
l
Choose Graph if you want the selected output to be displayed in graphic mode.
176
Other Functions of I/O Window
4.3.3 Changing Display Mode of Virtual Interrupt
1.
2.
For cycle-synchronized interrupts
Choose Cycle in the Select Interrupt Display Mode column.
For executed address-synchronized interrupts
Choose Executed Address in the Select Interrupt Display Mode column.
4.4 Changing Scale of Display Screen
The scale of the virtual port input, virtual port output, or virtual interrupt display screen can be
changed. This means changing the number of cycles that can be displayed in one screen.
To change the display scale, choose the menus [Option] −> [Scale] (or the Scale button). A dialog box
like the one shown below will appear.
The following explains how to change the scale of each display screen.
1.
2.
3.
To change the scale of the virtual port input display screen, slide the scroll bar in the Input
column until the scale you want is reached.
To change the scale of the virtual port output display screen, slide the scroll bar in the Output
column until the scale you want is reached.
To change the scale of the virtual interrupt display screen, slide the scroll bar in the Interrupt
column until the scale you want is reached.
The display scale can be changed in the range of 1 to 10,000 [cycles].
For example, if you change the scale to 50 when displaying a virtual port input in chart mode, the
data is displayed for 50 cycles in one screen.
Note, however, that when displayed in numeric form, the maximum scale is 50.
177
P D 7 9 S I M U s e r ’s M a n u a l
4.5 Changing Colors of Display Screen
The colors of the virtual port input, virtual port output, or virtual interrupt display screen can be
changed.
You can change four colors in each data display area: grid lines, graph lines, text, and background.
Graph line
Grid line
Text (display characters "00")
Background
To change the display colors, choose the menus [Option] -> [Color] (or the Color button).
like the one shown below will appear.
A dialog box
Reset
to default color
Grid line color
Graph line color
Text color
Background color
178
Other Functions of I/O Window
The following explains how to change colors in each display screen.
1.
2.
3.
To change the colors of the virtual port input display screen
Press the button for the item whose color you want to be changed in the Input column. A
dialog box for selecting colors will appear. Use this dialog box to choose your desired colors.
To change the colors of the virtual port output display screen
Press the button for the item whose color you want to be changed in the Output column.
A dialog box for selecting colors will appear. Use this dialog box to choose your desired
colors.
To change the colors of the virtual interrupt display screen
Press the button for the item whose color you want to be changed in the Interrupt column.
A dialog box for selecting colors will appear. Use this dialog box to choose your desired
colors.
4.6 Searching for Display Data
The virtual port input or virtual interrupt data or the output result of virtual port output can be
displayed at the left edge of the window after searching. However, the last data of each is displayed
at the right edge.
The following shows how to search.
Point to somewhere in
one of these areas and
click the right mouse
button. A popup menu
for searching data will
appear.
Move the mouse cursor to a position in one of the display areas where you want search for data to
begin, then click the right mouse button. A popup menu like the one shown below will appear.
179
P D 7 9 S I M U s e r ’s M a n u a l
When you choose Before data here, data is searched backward from the position you've specified by
clicking the mouse button. If you choose Next data here, data is searched forward from the position
you've specified by clicking the mouse button.
4.7 Listing Registered I/O Script Files
The registered I/O scrip files can be listed on the screen.
Chapter 7, "I/O Script Functions")
The following shows how to list.
(For details about I/O script files, refer to
Click here, and I/O script files will be listed.
4.8 Regarding Evaluation Timings of Virtual Port Inputs,
Virtual Interrupts, and I/O Script Files Set
The virtual port inputs, virtual interrupts, and I/O script files you've set are evaluated at the
following timings:
Evaluation timings
l
When program is executed (continuously); when come is executed
l
When program is single-stepped
l
When program is overstepped
l
When control is returned
Processing when program is reset
The virtual port inputs, virtual interrupts, and I/O script files that you've set are reevaluated.
Namely, when a program is reset, the virtual port inputs, virtual interrupts, and I/O script files
you've set are set newly again.
Processing when I/O Window is closed
If the I/O Window is closed, the virtual port inputs, virtual interrupts, and I/O script files that
you've set are not evaluated. This case is the same as when their settings have been deleted.
180
Setting GUI Input Window
5 Setting GUI Input Window
5.1 Overview
The GUI Input Window allows you to create a simple key input panel (buttons) of the user target
system in a window and execute virtual port inputs or virtual interrupts by pressing the buttons
you've created.
Here, we'll explain how to create buttons.
5.2 Creating Buttons
Follow the procedure below to create buttons.
1. Choose the GUI Input Window menus [Option] −> [Make] (or the Make button).
2. Next, move the mouse cursor into the GUI Input Window's input panel display area, at which
time the mouse cursor will have its shape changed to a cross (+).
3. While in this state, click the left mouse button at a position where you want a button to be
created. Hold down the left mouse button while you move the mouse cursor to expand its size
and release the left mouse button where the size is what you want.
Choose this button.
Input panel display area
Drag the cross
cursor to
determine the
size of the
button.
+
181
P D 7 9 S I M U s e r ’s M a n u a l
4. A button will be created as shown below.
5. Next, double-click on the button you've created.
[CAUTION]
Before double-clicking on the button you've created, check to see that the arrow on the tool bar
is selected. If not selected, choose the arrow before double-clicking on the button you've
created.
6. A dialog box for setting the action to be performed by the button like the one shown below will
appear. For this button action, set one of virtual port input, virtual interrupt, or virtual port
input plus virtual interrupt.
Input a button name.
Specify the action to be performed
when you press the button.
Input the address to which virtual
port is input.
Input data for virtual port input.
Input the vector address of virtual
interrupt.
Input the priority of virtual
interrupt.
(1) Assign the button a name.
(Input your desired name in the Button Name column.)
182
Setting GUI Input Window
(2) Specify the action to be performed when you press the button in the Select Button Type
column.
l
Choose Input for virtual port input.
l
Choose Interrupt for virtual interrupt.
l
Choose Input and interrupt for simultaneous generation of virtual port input and
virtual interrupt.
(3) If you've selected virtual port input, enter the address to which you want data to be
input and the data to be input in the Input column.
If you've selected virtual interrupt, enter the vector address and the priority (IPL) of
the virtual interrupt in the Interrupt column.
7. Press the OK button in the dialog box. Thus, you've finished creating and setting a button.
8. To create another button, repeat steps 1 to 7 above.
5.3 Saving Buttons You've Created
When you've finished creating buttons, you can save the data (setup contents and layout) of the
buttons you've created to a file (GUI input file). The saved GUI input file can be loaded into
PD79SIM back again by using the menus [Option] −> [Load].
Follow the procedure below to save the button data.
Choose the GUI Input Window menus [Option] −> [Save] (or the Save button).
dialog box shown below will appear.
When selected, the
Here, enter the directory and file names in which you want the button data to be saved. When
you've input a file name, press the Save button.
183
P D 7 9 S I M U s e r ’s M a n u a l
5.4 Changing Button Position or Settings after Creating
Button
After creating buttons, you can change their positions or setup contents.
1. To change the position of a button
Choose the GUI Input Window menus [Option] −> [Set] (or the <− button). Then point to the
button whose position you want to be changed and click the left mouse button.
The button is placed in a selected state when you've clicked, as shown above. When in this
state, hold down the left mouse button while you drag the button to a position where you want
it.
184
Setting GUI Input Window
2. To change the setup contents of a button
Choose the GUI Input Window menus [Option] −> [Set] (or the <− button), as in 1 above. Then
point to the button whose setup contents you want to be changed and double-click the left
mouse button. The dialog box shown below will appear.
Input a button name.
Specify the action to be performed
when you press the button.
Input the address to which virtual
port is input.
Input data for virtual port input.
Input the vector address of virtual
interrupt.
Input the priority of virtual
interrupt.
Here, change the setup contents of the selected button.
5.5 Copying buttons
Follow the procedure below to copy buttons.
1. Choose the GUI Input Window menus [Option] −> [Copy].
2. Next, move the mouse cursor into the GUI Input Window's input panel display area, at which
time the mouse cursor will have its shape changed to a cross (+).
3. While in this state, point to the button you want to copy and click the left mouse button.
4. Next, choose the GUI Input Window menus [Option] −> [Paste]. A new button will be copied on
to the button you've selected with the left mouse button.
Or choose the GUI Input Window menus [Option] −> [Set] (or the <− button). After choosing the menu,
point to the button you want to copy and click the left mouse button to select it. Then press the Ctlr +
C key combination and Ctrl + V key combination.
185
P D 7 9 S I M U s e r ’s M a n u a l
5.6 Deleting buttons
Follow the procedure below to delete buttons.
1. Choose the GUI Input Window menus [Option] −> [Del].
2. Next, move the mouse cursor into the GUI Input Window's input panel display area, at which
time the mouse cursor will have its shape changed to a cross (+).
3. While in this state, point to the button you want to delete and click the left mouse button.
Or choose the GUI Input Window menus [Option] −> [Set] (or the <− button). After choosing the menu,
point to the button you want to delete and click the left mouse button to select it. Then press the
Delete key.
5.7 Displaying Grid Lines
The GUI Input Window has a function to display grid lines at a position where buttons can be located.
Use this function when you place buttons.
To display grid lines, choose the menus [Option] −> [Display Grid Line] (or the Grid button).
selected, grid lines like the one shown below are displayed.
Grid line
186
When
Setting GUI Output Window
6 Setting GUI Output Window
6.1 Overview
The GUI Output Window allows you to implement the user target system's simple output panel in a
window.
The following parts can be arranged in this output panel:
l
Label (character string)
User-specified character strings are displayed or erased when some value is written to a
specified memory address or according to logic 1 or 0 in a bit.
l
LED
LEDs are lit when some value is written to a specified memory address or according to logic 1
or 0 in a bit.
Maximum number of parts that can be arranged
l
l
The total number of addresses that can be set for the parts created is 20, including addresses
of all parts. Therefore, if the addresses set for each part all are different, the maximum
number of parts that can be arranged in the output panel is 20.
If the number of addresses set for each part is less than 20, there is, in effect, no limit to the
maximum number of parts that can be arranged.
The following explains how to create parts for the GUI Output Window.
187
P D 7 9 S I M U s e r ’s M a n u a l
6.2 Creating Labels
Follow the procedure below to create labels.
1. Choose the GUI Output Window menus [Option] −> [Make Label] (or the Label button).
2. Next, move the mouse cursor into the GUI Output Window's output panel display area, at
which time the mouse cursor will have its shape changed to a cross (+).
3. While in this state, click the left mouse button at a position where you want to create a label.
Hold down the left mouse button while you move the mouse cursor to expand its size and
release the left mouse button where the size is what you want.
Choose this button.
Output panel display area
Drag the cross
cursor to
determine the
size of the label.
+
4. When a frame in which to display the label appears, double-click somewhere in the frame.
[CAUTION]
Before double-clicking on the label you've created, check to see that the arrow <− on the tool bar
is selected. If not selected, choose the arrow <− before double-clicking on the label you've
created.
5. A dialog box for setting a label like the one shown below will appear.
Here, you can specify one of the following two methods for monitoring outputs:
- Display/erase a user-specified character string according to logic 1 or 0 in memory
bit
- Display/erase a character string when some value is written to memory
188
Setting GUI Output Window
(1) For displaying/erasing a user-specified character string according to logic 1 or 0 in
memory bit
Input the desired
memory address.
Memory bit number.
Select Bit.
ON
OFF
Input the character
string to be displayed
when memory bit = 1
(or 0 if you selected
Negative).
Specify Positive
or Negative.
Input the character
string to be displayed
when memory bit = 0
(or 1 if you selected
Negative).
(2) For displaying/erasing a character string when some value is written to memory
Input the desired
memory address.
Input the character string
to be displayed when
memory value coincides
with the one specified for
Display Name1 in the Data
column.
Select Data.
ON
OFF
Input the character string
to be displayed when
memory value coincides
with the one specified for
Display Name2 in the Data
column.
The character string in the
Name1 column is displayed
when the data specified here is
output.
The character string in the
Name2 column is displayed
when the data specified here is
output.
6. Press the OK button in the dialog box. Thus, you've finished creating and setting a label.
7. To create another label, repeat steps 1 to 6 described above.
189
P D 7 9 S I M U s e r ’s M a n u a l
6.3 Creating LEDs
Follow the procedure below to create LEDs.
1. Choose the GUI Output Window menus [Option] −> [Make LED] (or the LED button).
2. Next, move the mouse cursor into the GUI Output Window's output panel display area, at
which time the mouse cursor will have its shape changed to a cross (+).
3. While in this state, click the left mouse button at a position where you want to create an LED.
Hold down the left mouse button while you move the mouse cursor to expand its size and
release the left mouse button where the size is what you want.
Choose this button.
Output panel display area
+
Drag the cross
cursor to
determine the
size of the LED.
4. When a frame in which to display the LED appears, double-click somewhere in the frame.
[CAUTION]
Before double-clicking on the LED you've created, check to see that the arrow <− on the tool bar
is selected. If not selected, choose the arrow <− before double-clicking on the LED you've
created.
5. A dialog box for setting an LED like the one shown below will appear.
Here, you can specify one of the following two methods for monitoring outputs:
- Turn on LED according to logic 1 or 0 in memory bit
- Turn on LED when some value is output to memory
190
Setting GUI Output Window
(1) For turning on LED according to logic 1 or 0 in memory bit
Input the desired
memory address.
Memory bit number.
Select Bit.
Select color for the LED
that is displayed when
memory bit = 1 (or 0 if
you selected Negative).
Specify Positive
or Negative.
Select color for the LED
that is displayed when
memory bit = 0 (or 1 if
you selected Negative).
(2) For turning on LED when some value is output to memory
Input the desired
memory address.
Select color for the LED
that is displayed when
memory value coincides
with the one specified for
Display Color1 in the Data
column.
Select Data.
Select color for the LED
that is displayed when
memory value coincides
with the one specified for
Display Color2 in the Data
column.
The LED is lit in the color
selected in the Color1 column
when the data specified here is
output.
The LED is lit in the color
selected in the Color2 column
when the data specified here is
output.
191
P D 7 9 S I M U s e r ’s M a n u a l
6.
When you press the Color1 or Color2 button, a dialog box for selecting LED colors appears.
Here, choose colors in which you want the LEDs to be displayed and press the OK button.
7.
8.
Thus, you've finished creating and setting an LED.
To create another LED, repeat steps 1 to 7 described above.
6.4 Saving Parts You've Created
When you've finished creating parts, you can save the data (setup contents and layout) of the parts
you've created to a file (GUI output file). The saved GUI output file can be loaded into PD79SIM
back again by using the menus [Option] −> [Load] to reproduce the saved parts.
Follow the procedure below to save the parts data.
Choose the GUI Output Window menus [Option] −> [Save] (or the Save button).
dialog box shown below will appear.
When selected, the
Here, enter the directory and file names in which you want the parts data to be saved.
input a file name, press the Save button.
192
When you've
Setting GUI Output Window
6.5 Changing Parts Position or Settings after Creating Parts
After creating parts, you can change their positions or setup contents.
1. To change the position of a part
Choose the GUI Output Window menus [Option] −> [Set] (or the <− button). Then point to the
part whose position you want to be changed and click the left mouse button.
The button is placed in a selected state when you've clicked, as shown above. When in this
state, hold down the left mouse button while you drag the part to a position where you want it.
2.
To change the setup contents of a part
Choose the GUI Output Window menus [Option] −> [Set] (or the <− button), as in 1 above.
Then point to the part whose setup contents you want to be changed and double-click the left
mouse button.
The dialog box you've used when creating parts will appear.
settings of the selected part.
Use this dialog box to change the
6.6 Copying Parts
Follow the procedure below to copy parts.
1. Choose the GUI Output Window menus [Option] −> [Copy].
2. Next, move the mouse cursor into the GUI Output Window's output panel display area, at
which time the mouse cursor will have its shape changed to a cross (+).
3. While in this state, point to the part you want to copy and click the left mouse button.
4. Next, choose the GUI Input Window menus [Option] −> [Paste]. A new part will be copied on to
the part you've selected with the left mouse button.
Or choose the GUI Output Window menus [Option] −> [Set] (or the <− button). After choosing the
menu, point to the button you want to copy and click the left mouse button to select it. Then press the
Ctlr + C key combination and Ctrl + V key combination.
193
P D 7 9 S I M U s e r ’s M a n u a l
6.7 Deleting Parts
Follow the procedure below to delete parts.
1. Choose the GUI Output Window menus [Option] −> [Del].
2. Next, move the mouse cursor into the GUI Output Window's output panel display area, at
which time the mouse cursor will have its shape changed to a cross (+).
3. While in this state, point to the part you want to delete and click the left mouse button.
Or choose the GUI Output Window menus [Option] −> [Set] (or the <− button). After
choosing the menu, point to the part you want to delete and click the left mouse button to
select it. Then press the Delete key.
6.8 Displaying Grid Lines
The GUI Output Window has a function to display grid lines at a position where parts can be located.
Use this function when you place parts.
To display grid lines, choose the menus [Option] −> [Display Grid Line] (or the Grid button).
selected, grid lines like the one shown below are displayed.
Grid lines
194
When
I/O Script Function
7 I/O Script Function
7.1 Overview
Settings of virtual port inputs or virtual interrupts can be written to a file in script form. This script
is called the "I/O script." Also, the files that contain a description of I/O scripts are called the "I/O
script file."
Using I/O scripts, you can set virtual port inputs and virtual interrupts in a more flexible manner
than can be set from the I/O Window. For example, you can make the following settings that cannot
be made from the I/O Window:
l
l
l
If you want to generate a cyclic virtual interrupt like timer interrupts, you can use the while
statement to specify a repetition of virtual interrupt generation.
You can specify that the priority levels set in the interrupt control register's interrupt priority
level select bits be referenced to resolve the interrupt priority of virtual interrupts generated.
As conditions for entering virtual port inputs or generating virtual interrupts, you can specify a
combination of program fetch, memory access for read/write, or memory comparison.
In addition to the above, various other I/O settings are possible.
7.2 Method for Writing I/O Script
This section explains the method for defining virtual port inputs, virtual interrupts, and other I/Os to
be written in I/O script by using definition examples.
To define an I/O script, write a procedure for it. Enclose a procedure with braces "{ }" as you write
it. Multiple procedures can be written in one file.
In each procedure, write settings, timings, etc. of virtual port inputs or virtual interrupts.
Each of the multiple procedures thus defined are processed in parallel with program execution.
However, the order in which each procedure is evaluated is indeterminate.
Register the I/O script file you've created in PD79SIM using the I/O Window menus [Option] −>
[Load] (or the Load button). Multiple I/O script files can be registered. However, the total number
of procedures that can be registered is limited to 20.
l
Procedure 1 in the example below defines the timer mode of timer A0.
In this example, a timer A0 interrupt is generated every divide-by-ratio (number of cycles)
specified for the timer A0. The value specified in the interrupt control register is referenced to
determine the priority of this timer interrupt.
l
Procedure 2 in the example below defines a cycle-synchronized virtual port input.
In this example, data is input from virtual port to memory when the program has been executed
10,000 cycles. Although the I/O Window supports virtual port inputs in only bytes, I/O scripts
allow for virtual port inputs in words or long words.
195
P D 7 9 S I M U s e r ’s M a n u a l
; Definition example of I/O script file
−> Comment statement
; Definition of procedure 1 (example for virtual interrupt)
{
−> Beginning of procedure 1.
set %mr_A0_cnt = 0
−> Initializes divide-by cycle setup variable.
while(1){
pass #iswrite:0x40, 1
−> Keeps execution waiting until a write to count start
flag is performed.
if(([0x40].b & 0x01) == 0x01){
−> Checks timer A0’s count start flag
break
}
}
if(([0x45].b & 0x03) == 0x0){
−> Selects timer A clock divide-by value that is set in
timer A clock division specifying register.
if(([0x56].b & 0xc0) == 0x0)
−> Selects count source that is set in timer A0 mode
register.
set %mr_A0_cnt = 2
−> Selects f2.
else if(([0x56].b & 0xc0) == 0x40)
set %mr_A0_cnt = 16
−> Selects f16.
else if(([0x56].b & 0xc0) == 0x80)
set %mr_A0_cnt = 64
−> Selects f64.
else
set %mr_A0_cnt = 512
−> Selects f512.
}else if(([0x45].b & 0x03) == 0x1){
if(([0x56].b & 0xc0) == 0x0)
set %mr_A0_cnt = 1
−> Selects f1.
else if(([0x56].b & 0xc0) == 0x40)
set %mr_A0_cnt = 16
−> Selects f16.
else if(([0x56].b & 0xc0) == 0x80)
set %mr_A0_cnt = 64
−> Selects f64.
else
set %mr_A0_cnt = 4096
−> Selects f4096.
}else if(([0x45].b & 0x03) == 0x2){
if(([0x56].b & 0xc0) == 0x0)
set %mr_A0_cnt = 1
−> Selects f1.
else if(([0x56].b & 0xc0) == 0x40)
set %mr_A0_cnt = 64
−> Selects f64.
else if(([0x56].b & 0xc0) == 0x80)
set %mr_A0_cnt = 512
−> Selects f512.
else
set %mr_A0_cnt = 4096
−> Selects f4096.
}
while(1){
−> while statement.
if(([0x40].b & 0x01) == 0x01){
−> Checks timer A0's count start flag.
waitc [0x46].w * %mr_A0_cnt + 1
−> Keeps execution of I/O script waiting for
the number of cycles equal to the
divide-by-ratio that is set for timer A0.
int 0xffec,[0x75].b & 0x7
−> Generates a timer A0 virtual interrupt.
(Interrupt control register is referenced to
determine priority.)
}else{
waiti 100
−> Keeps execution of I/O script waiting for
100 instructions.
}
}
}
−> Terminates procedure 1.
196
I/O Script Function
; Definition of procedure 2 (example for virtual port input)
{
−> Beginning of procedure 2.
waitc 10000
−> Keeps execution of I/O script waiting for 10,000
cycles.
set [0x2] = 0x20
−> Inputs 0x20 in address 0x2.
waitc 10000
set [0x2].w = 0x4143
−> Inputs 2-byte data 0x4143 from address 0x2.
}
−> Terminates procedure 2.
7.3 Composition of I/O Script
Following statements can be written in I/O script:
l
l
l
l
l
Procedure
I/O script statement
Judgment (if, else)
Execution statements are branched off by judging the evaluation result of expression.
Repeat statement (while) and Break statement
Statements are executed repeatedly by judging the evaluation result of expression.
Comment statement
Comments can be written in I/O script. Comment statements are ignored when executing I/O
script.
When creating I/O scripts, write one statement in one line.
one line or one statement in multiple lines.
You cannot write multiple statements in
7.3.1 Procedure
Procedures specify a definition block of an I/O script. Multiple procedures can be written in one file.
However, the number of procedures that can be defined is limited to 20. (If procedures are defined in
multiple files, this limit means that up to 20 of such procedures can be defined.) The following
shows a description format.
{
Statements
}
{
Statements
}
In the same way, multiple procedures can be defined below.
:
197
P D 7 9 S I M U s e r ’s M a n u a l
7.3.2 I/O Script Statements
Following five statements can be used in I/O script:
(1) waiti statement
Format: waiti number of machine instructions
Function:
Execution of the next statement is kept waiting for a specified number of machine instructions.
Right-side expressions can be used to specify the number of machine instructions. (Specification
of right-side expressions is described later.)
For example, if following statements are written
waiti 100
set [0x800] = 0x10
the set statement is executed only after executing 100 machine instructions.
(2) waitc statement
Format: waitc number of cycles
Function:
Execution of the next statement is kept waiting for a specified number of cycles.
Right-side expressions can be used to specify the number of cycles. (Specification of right-side
expressions is described later.)
For example, if following statements are written
waitc 10000
set [0x800] = 0x10
the set statement is executed only after executing the program 10,000 cycles.
(3) int statement
Format: int vector address , priority
Function:
The virtual interrupt of a specified vector address is generated in a specified order of priority.
Right-side expressions can be used to specify the vector address and priority. (Specification of
right-side expressions is described later.)
For example, if following statements are written
int 0xffec , 5
a timer A0 (vector address 0xffec) interrupt is generated at priority level 5.
(4) set statement
There are following three formats for the set statement:
Format 1: set memory address = input value
Function:
The input value is input to a specified memory address (virtual port input to memory).
Left-side expressions can be used to specify the memory address, and right-side expressions can be
used to specify the input value. (Specifications of left-side and right-side expressions are
described later.)
For example, if following statements are written
set [0x2] = 0x1d
data 0x1d is input to memory address 0x2.
198
I/O Script Function
Format 2: set condition expression, memory address = input value 1,input value 2, ...
Function:
The input value 1, input value 2, etc. are sequentially input to a specified memory address each
time the conditional expression is established.
Left-side expressions can be used to specify the memory address, and right-side expressions can be
used to specify the conditional expressions and input values. (Specifications of left-side and
right-side expressions are described later.)
For example, if following statements are written
set #isfetch:0xf0000 , [0x3] = 0x10 , 0x20
; #isfetch becomes true (established) when the program executes a specified
address.
data 0x10 and 0x20 are sequentially input to memory address 0x3 each time the program executes
address 0xf0000.
Namely, data 0x10 is input to memory address 0x3e1 when address 0xf0000 is executed first, and
data 0x20 is input when the address is executed next.
Format 3: set % macro variable = right-side expression
Function:
The right-side expression is placed in a specified macro variable. (Specification of macro variables
is described later.)
For example, following macro variables can be written:
set %val = 10; Macro variable val is initialized to 10.
set %val = %val + 1; Value of the macro variable is incremented by 1.
(5) pass statement
Format: pass conditional expression, pass count
Function:
Execution of the next statement is skipped a number of times as specified by the pass count until
the conditional expression is met.
Right-side expressions can be used to specify the conditional statement and pass count.
(Specification of right-side expressions is described later.)
For example, if following statements are written
pass #isint:0xffec , 3
; #isint becomes true (established) when a specified virtual interrupt is
generated.
set [0x800] = 0x10
the set statement is executed only after a timer A0 interrupt (vector address 0xffec) occurs three
times.
199
P D 7 9 S I M U s e r ’s M a n u a l
7.3.3 Judge Statements (if, else)
Judge statements judge the results of expressions, thereby causing the statements to be executed to
branch off. The following shows a description format.
if (conditional expression) {
Statement 1
} else if (conditional expression) {
Statement 2
} else {
Statement 3
}
l
l
l
l
l
When if (conditional expression) is true (not 0) statement 1 is executed. If the conditional
expression is false (= 0), else if (conditional expression) is evaluated to see whether it is true or
false. If the conditional expression is true, statement 2 is executed. Otherwise, statement 3,
the else statement, is executed.
The else if and else statements can be omitted.
The if statement can be nested in up to 32 levels.
Right-side expressions can be used for the conditional expression.
The conditional expressions written in I/O script are calculated as unsigned type. Therefore,
if negative values are compared in an if statement, the operation to be performed by
PD79SIM is indeterminate.
7.3.4 Repeat Statement (while) and break Statement
Repeat statements judge the results of expressions, thereby executing statements repeatedly.
following shows a description format.
The
while (conditional expression ) {
statement or break statement
}
l
l
l
l
l
If the conditional expression is true, the statement is executed repeatedly. If the conditional
expression is false, program execution exits from the loop.
The while statement can be nested in up to 32 levels.
A break statement is used if it is necessary to forcibly exit the while statement. If the while
statement is nested, program execution exits from the innermost loop.
Right-side expressions can be used for the conditional expression.
The conditional expressions written in I/O script are calculated as unsigned type. Therefore,
if negative values are compared in an while statement, the operation to be performed by
PD79SIM is indeterminate.
7.3.5 Comment Statements
Comment statements are used to write comments in I/O script.
format.
The following shows a description
; character string
l
l
l
A comment statement starts from a semicolon (;).
A range of statement from the semicolon (;) till the end of the line is handled as a comment.
Lines of comment statements are ignored when executing I/O scripts.
200
I/O Script Function
7.4 Method for Writing Right-side Expressions
Right-side expressions can be used to write the number of machine instructions or cycles, vector
addresses, priority levels, input values, conditional expressions, or pass counts in I/O script
statements, as well as write expressions in if and while statements. The following shows an
example of an I/O script statement written using right-side expressions.
waitc LABEL
waiti [0x800] + 20
if( [0x1ff] == 0x30 )
while( #isfetch:0xf0000 )
7.4.1 Composition of Right-side Expressions
Right-side expressions may be composed of the following:
l
l
l
l
l
l
l
Constant
Symbol and label
Macro variable
Memory variable
Character constant
Operator
#isfetch, #isint, #isread, #iswrite
Each part of right-side expressions are described below.
7.4.2 Constants
Binary, decimal, and hexadecimal numbers can be input.
a symbol added at the beginning of a numeric value.
Beginning
Example
The radix of numerals is discriminated by
Hexadecimal
Decimal
Binary
0x,0X
0xAB24
None
1234
%
%10010
7.4.3 Symbols and Labels
The global symbols and global labels defined in the target program can be used.
l
l
l
l
l
Symbol and label names may consist of alphanumeric characters, underscore (_), period (.),
and question mark (?). However, numbers cannot be used at the beginning of symbol and
label names.
Symbol and label names can be written in up to 255 characters.
Symbol and label names are discriminated between uppercase and lowercase letters.
The structured instructions, pseudo-instructions, macro-instructions, and reserved op-code
words of assembler as79 cannot be used in symbol and label names. (These, for example,
include .SECTION, .BYTE, switch, and if.)
Character strings that begin with ".." cannot be used in symbol and label names.
201
P D 7 9 S I M U s e r ’s M a n u a l
7.4.4 Macro Variables
Macro variables are used by adding "%" at the beginning of each variable name.
l
l
l
l
Variable names following the percent character (%) may consist of alphanumeric characters
and underscore (_). However, numbers cannot be used at the beginning of macro variable
names.
Register names cannot be used in variable names.
Variable names are discriminated between uppercase and lowercase letters.
Up to 32 macro variables can be defined. Once defined, the macro variables remain effective
until PD79SIM is terminated.
7.4.5 Memory Variables
Memory variables are used when using memory values in expressions.
format of memory variables.
The following shows a
[address].data-size
l
l
Expressions can be written in address. (Memory variables also can be used.)
Specify data size as shown in the table below.
For byte size
For word (2-byte) size
For long word (4-byte) size
l
B or b
W or w
L or l
If specification of data size is omitted, the data size is assumed to be byte long.
Example 1: To reference memory contents at address 800016 in bytes
[0x8000].B or [0x8000]
Example 2: To reference memory contents at address 800016 in words
[0x8000].w
Example 3: To reference memory contents at address 800016 in long words
[0x8000].L
7.4.6 Character Constants
Specified characters or character strings are handled as constants after being converted into ASCII
code.
l
l
l
Characters must be enclosed with single quotations.
Character strings must be enclosed with double quotations.
Character strings must be within 2 characters (16 bits in length).
If a character string consists of more than two characters, only the last two characters written
in the string are operated on. For example, if you write "ABCD," only the last two characters
in this string, i.e., "CD," are operated on, the value of which is 434416.
202
I/O Script Function
7.4.7 Operators
The following lists the operators that can be written in expressions.
l
The priorities of operators are such that level 1 is the highest, and level 12, the lowest. If
operators in an expression have the same priority, they are calculated sequentially from left
to right.
Operator
Meaning
Priority
()
+, -, ~
*, /
+, >>, <<
<, <=, >, >=
==, !=
&
^
|
&&
||
Parentheses
Unary plus, unary minus, unary logical negation
Binary multiplication, binary division
Binary addition, binary subtraction
Shift right, shift left
Binary comparison
Binary comparison
Binary logical AND
Binary exclusive OR
Binary logical OR
Logical AND
Logical OR
Level 1
Level 2
Level 3
Level 4
Level 5
Level 6
Level 7
Level 8
Level 9
Level 10
Level 11
Level 12
7.4.8 #isfetch, #isint, #isread, #iswrite
These statements are used in conditional expressions of I/O script statements and if and while
statements.
(1) #isfetch expression
Format: #isfetch: address
Function:
The value of the expression becomes true (= 1) when the program's PC value goes to a
specified address. Otherwise, the expression is false (= 0).
For example, the if statement below
if ( #isfetch:0xfc000)
becomes true (= 1) when the program's address (PC value) becomes 0xfc000.
(2) #isint expression
Format: #isint: vector address
Function:
The value of the expression becomes true (= 1) immediately after a virtual interrupt of a
specified vector address is generated. Otherwise, the expression is false (= 0).
For example, the if statement below
if ( #isint:0xffee)
becomes true (= 1) if a virtual interrupt of vector address 0xffee had occurred immediately
before the if statement was evaluated.
(3) #isread expression
Format: #isread: address
Function:
The value of the expression becomes true (= 1) immediately after a specified memory address
is accessed for read (to read data from memory). Otherwise, the expression is false (= 0).
For example, the if statement below
if ( #isread:0x800)
becomes true (= 1) if memory at address 0x800 had been accessed for read immediately before
the if statement was evaluated.
203
P D 7 9 S I M U s e r ’s M a n u a l
#iswrite expression
Format: #iswrite: address
Function:
The value of the expression becomes true (= 1) immediately after a specified memory address
is accessed for write (to write data to memory). Otherwise, the expression is false (= 0).
For example, the if statement below
if ( #iswirte:0x800)
becomes true (= 1) if memory at address 0x800 had been accessed for write immediately before
the if statement was evaluated.
7.5 Method for Writing Left-side Expressions
Left-side expressions can be written in memory addresses and macro variables of the set statement in
I/O script statements. The following shows an example of an I/O script statement using left-side
expressions.
set [0x2] = 0x1a
set %val = 10
7.5.1 Composition of Left-side Expressions
Left-side expressions may be composed of the following:
l
Macro variable
l
Memory variable
Each part of left-side expressions are described below.
7.5.2 Macro Variables
Macro variables are used by adding "%" at the beginning of each variable name.
l
Variable names following the percent character (%) may consist of alphanumeric characters
and underscore (_). However, numbers cannot be used at the beginning of macro variable
names.
l
The values that can be handled by an expression that is substituted for macro variables are
integers in the range of 0 to FFFFFFFF16. If negative numbers are used, they are handled as
2's complements.
When specifying a repeat count for the while statement, use of macro variables should prove
convenient.
set %val = 0
; Macro variable %val is assigned 0.
while(%val < 10){
; while statement is repeated until %val = 10.
waitc 10000
int 0xffee,5
set %val = %val + 1 ; %val is incremented by 1.
}
7.5.3 Memory Variables
This variable is used when writing values in memory.
variables.
The following shows a format of memory
[address].data-size
l
Expressions can be written in address. (Memory variables cannot be used.)
204
I/O Script Function
l
Specify data size as shown in the table below.
For byte size
For word (2-byte) size
For long word (4-byte) size
l
B or b
W or w
L or l
If specification of data size is omitted, the data size is assumed to be byte long.
Example 1: When writing to memory at address 0x8000 in bytes
set [0x8000].B = 0x10 or set [0x8000] = 0x10
Example 2: When writing to memory at address 0x8000 in words
set [0x8000].w = 0x1234
Example 3: When writing to memory at address 0x8000 in long words
set [0x8000].L = 0x12345678
205
P D 7 9 S I M U s e r ’s M a n u a l
8 Coverage Information
8.1 Referencing Coverage
To reference the coverage (C0 coverage) of each function in the downloaded C language program, open
the coverage window. The coverage window can be opened by selecting the following from the
PD79SIM window menu.
[Optional Window] −> [Coverage Window]
Coverage window for checking the execution rate of each function
Double-click on the line of the
function you want to check.
A coverage source window will open
up.
Coverage source window for checking for each line whether the
target program has been executed or not
8.2 Updating Coverage Display
When the target program is executed using a GO or STEP command, the coverage display area of the
coverage window changes to '--'. The display is not automatically updated. If you want to update it,
press the Refresh button on the toolbar (or select [Option] −> [Refresh] from the menu).
The display of the coverage source window is automatically updated when the program has stopped.
8.3 Initializing Coverage
To initialize the coverage measurement information, press the Clear button on the toolbar (or select
[Option] −> [Clear] from the menu). All coverage figures are cleared to 0%.
206
Coverage Information
8.4 Saving/Loading Coverage Measurement Information
The coverage measurement information can be saved to a file and the saved information can be loaded
from a file into the computer. In this way, measurement can be started immediately following the
previous one.
To save coverage measurement information
To save coverage information, select the following from the PD79SIM window menu when the
coverage window is active.
[Option] −> [File] −> [Save...]
A coverage save dialog box will appear when the above are selected from the menu.
l
l
l
l
l
A path can be added to the file name that is specified here.
If a file name extension is omitted, the default file extension ".cov" is added.
If an existing file name is specified for the file name here, the file will be overwritten.
A file selection dialog box appears when you click on the <Refer> button. A file name can be
specified in this dialog box also.
The coverage information is saved to the specified file when you click <OK>.
To load coverage measurement information
To load data from a file that contains the coverage measurement results saved by the "Save" menu
command into the computer, select the following from the PD79SIM window menu when the coverage
window is active.
[Option] −> [File] −> [Load...]
A file selection dialog box will appear when the above are selected from the menu.
l
l
l
A path can be added to the file name that is specified here.
If a file name extension is omitted, the default file extension ".cov" is added.
After entering a file name (or single-clicking on it in the file list), press the <Open> button or
double-click on the file name in the file list. Coverage information will be loaded from the
specified file into the computer.
207
P D 7 9 S I M U s e r ’s M a n u a l
9 Customize Function
9.1 About Customize Function
The Customize Function allows you to add your own original functions to PD79SIM.
By loading custom command and custom window programs to PD79SIM, you can extend the standard
functions of PD79SIM.
To create custom command and custom window programs
A special software called " CB79SIM (Custom Builder for PD79SIM)" is included with PD79SIM.
Use it to create custom command and custom window programs. The custom command and custom
window programs created with CB79SIM can be made available to use by registering them to
PD79SIM using a MACRO command. For details on how to create custom command and custom
window programs, refer to the "CB79SIM User's Manual.
To use custom window programs
There are two methods to show in the following to use the custom window made with CB79SIM.
1. Register the custom window in the menu, and open from the menu.
2. Register the custom window with the MACRO command, and open with the MACRO
command.
Show the way of registering to the menu in the following.
Refer to the following "To use custom command and custom window programs..." for the
registration with the MACRO command and the open.
208
Customize Function
How to register for the menu
To register the custom window in the menu, select the following from the PD79SIM Window
menu:
[Optional Window] −> [Custom Window] −> [Option...]
Then, the following dialog opens.
1 Open the custom window
registration dialog
Custom window launcher dialog
2.Input the program file name(with
the extension ".p") of the custom
window with absolute pass.
3.Input the title of menu.
4.Choose display / non-display to the menu.
5.Click OK button
Custom window registration dialog
Note:
If you want to start the Custom window from the Script window, register the Custom
window with the macro command in advance.
209
P D 7 9 S I M U s e r ’s M a n u a l
The change of contents of registration
To change contents of registration, open the custom window registration dialog with
the following process . Then, change contents of registration.
1.Select the custom window which
changes contents of registration.
2.Open the custom window
registration dialog
Click the Delete button to remove
registration.
Change the turn of the display of the menu.
The open of custom window
The menu to open the custom window when it is registered is added.
1.Choose the custom window to open.
The custom window can be opened when the custom window is chosen with the custom
window launcher dialog and it clicks on the Run button.
210
Customize Function
To use custom command and custom window programs
Register the custom command and custom window programs created with CB79SIM from the
Script Window using a MACRO command. Specify as the parameter the custom command and
custom window program file names (with the extension ".p" omitted) when registering the
programs to PD79SIM. This makes the programs usable.
Example: >MACRO custom<RET>
For the custom command and custom window programs registered to PD79SIM by a MACRO
command, you can execute the program and open the window using the same procedure as used to
execute a script command. To execute the program registered by a MACRO command, use its file
name as the command name as shown below.
Example: >custom<RET>
The custom command and custom window programs registered by a MACRO command remain
intact until they are deleted from PD79SIM by a DELMACRO or DELMACROALL command.
(They are retained even when you quit PD79SIM.)
To find the custom command or custom window program thus registered, PD79SIM searches its
current directory (one that has been set by a script command CD). If these programs are stored in
some other directory, specify that directory according to an explanation of the search directory in
the later section of this manual.
To delete custom command and custom window programs
To delete the custom command and custom window programs registered to PD79SIM by a MACRO
command, use a DELMACRO command by specifying the registered file name of the program (not
including the extension) in it or a DELMACROALL command. When using a DELMACRO
command, only the specified custom command or custom window program is deleted. When using a
DELMACROALL command, all of the registered custom command and custom window programs
are deleted.
Example: >DELMACRO custom<RET>
>DELMACROALL<RET>
To set the search directory of custom command and custom window
programs
The custom command and custom window programs registered by a MACRO command are loaded
into PD79SIM when they are executed. The custom command and custom window programs to be
loaded are searched for from the directory that has been set by a MACROPATH (MPATH)
command. Only one directory can be specified by a MACROPATH (MPATH) command.
Example: >MACROPATH c:¥usr¥project¥custom<RET>
211
P D 7 9 S I M U s e r ’s M a n u a l
[ MEMO ]
212
Real-time OS Debugging
213
214
Executing MR79 Application Programs
1 Executing MR79 Application Programs
When executing application programs in PD79SIM that have been created using the real-time OS
(MR79), the following setup is required before you can execute the program.
1.1 Setting Timer Interrupts
The MR79 sets the system clock referenced by cyclic and alarm handlers, get_tim and dly_tsk system
calls, etc. Therefore, please specify the timers used by MR79 and intervals at which timer
interrupts are generated in the configuration file as shown below.
clock{
};
mpu_clock
timer
IPL
unit_time
initial_time
=
=
=
=
=
10MHz;
A0;
4;
1ms;
0:0:0;
// ms
In this example, timer A0 is used for the system's timer interrupt, and intervals at which the timer
A0 interrupt is generated are set to 1ms.
Before executing the MR79 application programs in PD79SIM , you need to set up the timers used by
MR79 (in this case, timer A0). This can be accomplished by writing the necessary settings in an I/O
script.
The following shows an example of a script description.
215
P D 7 9 S I M U s e r ’s M a n u a l
; Example of a definition of timer A0
{
set %mr_A0_cnt = 0
while(1){
pass #iswrite:0x40, 1
if(([0x40].b & 0x01) == 0x01){
break
}
}
if(([0x45].b & 0x03) == 0x0){
if(([0x56].b & 0xc0) == 0x0)
}
−> Comment statement.
−> Beginning of procedure.
−> Initializes divide-by cycle setup variable.
−> Keeps execution waiting until a write to count start
flag is performed.
−> Checks timer A0’s count start flag
−> Selects timer A clock divide-by value that is set in
timer A clock division specifying register.
−> Selects count source that is set in timer A0 mode
register.
−> Selects f2.
set %mr_A0_cnt = 2
else if(([0x56].b & 0xc0) == 0x40)
set %mr_A0_cnt = 16
−> Selects f16.
else if(([0x56].b & 0xc0) == 0x80)
set %mr_A0_cnt = 64
−> Selects f64.
else
set %mr_A0_cnt = 512
−> Selects f512.
}else if(([0x45].b & 0x03) == 0x1){
if(([0x56].b & 0xc0) == 0x0)
set %mr_A0_cnt = 1
−> Selects f1.
else if(([0x56].b & 0xc0) == 0x40)
set %mr_A0_cnt = 16
−> Selects f16.
else if(([0x56].b & 0xc0) == 0x80)
set %mr_A0_cnt = 64
−> Selects f64.
else
set %mr_A0_cnt = 4096
−> Selects f4096.
}else if(([0x45].b & 0x03) == 0x2){
if(([0x56].b & 0xc0) == 0x0)
set %mr_A0_cnt = 1
−> Selects f1.
else if(([0x56].b & 0xc0) == 0x40)
set %mr_A0_cnt = 64
−> Selects f64.
else if(([0x56].b & 0xc0) == 0x80)
set %mr_A0_cnt = 512
−> Selects f512.
else
set %mr_A0_cnt = 4096
−> Selects f4096.
}
while(1){
−> while statement.
if(([0x40].b & 0x01) == 0x01){
−> Checks timer A0's count start flag.
waitc [0x46].w * %mr_A0_cnt + 1−> Keeps execution of I/O script waiting for the
number of cycles equal to the divide-by-ratio that
is set for timer A0.
int 0xffec,[0x75].b & 0x7
−> Generates a timer A0 virtual interrupt.
(Interrupt control register is referenced to
determine priority.)
}else{
waiti 100
−> Keeps execution of I/O script waiting for
100 instructions.
}
}
−> Terminates procedure.
Once this I/O script is registered in PD79SIM using the I/O window menus [Option] −> [Load], you
can simulate the MR79 applications.
216
Real-time OS Debugging Function
2 Real-time OS Debugging Function
2.1 Checking Real-time OS Information
To check the Real-time OS information, either open the MR Window or execute the MR command
from the Script Window. See Section 7.1, "Executing Script Commands" in the Basic Operation Guide
for details of using script commands.
Note:
Please use the startup file(crt0mr.a79/start.a79) whose contents matches with the version of
MR79, when you make downloaded program.
The MR window and MR command will not run properly if the startup file you uses don't match
with the version of MR79.
The following shows the configuration of the MR Window.
217
P D 7 9 S I M U s e r ’s M a n u a l
To display the task status
Click "TSK" on the toolbar in the MR Window, or select the following from the menu:
[Option] −> [Mode] −> [Task]
The following shows the configuration of the MR Window in task status mode.
The following items are displayed in TSK mode.
displayed in order of their ID Nos.
ID
StaAddr
(name)
Pri
Status
wup_count
timeout
flg_ptn
flg_mode
All tasks defined during configuration are
Task ID
Starting address of task
Task name
Priority
Task status
Wake-up count
If task is waiting for time, it indicates its timeout value (reckoned from current
time).
Wait bit pattern of event flag
Wait cancellation condition of event flag
In TSK mode, the status bar indicates the following:
Current Run Task:
Task ID and task name of the currently executing task. ("nothing"
is displayed when idle.)
218
Real-time OS Debugging Function
The following are displayed in the Status area:
Display
Status
RUN
RDY
SUS
DMT
WAI(SLP)
WAI(SLP)-SUS
WAI(DLY)
WAI(DLY)-SUS
WAI (FLG)
WAI (FLG)-SUS
WAI (SEM)
WAI (SEM)-SUS
WAI (MBX)
WAI (MBX)-SUS
WAI(SLP-TMO)
WAI(SLP-TMO)-SUS
WAI(FLG-TMO)
WAI(FLG-TMO)-SUS
WAI(SEM-TMO)
WAI(SEM-TMO)-SUS
WAI(MBX-TMO)
WAI(MBX-TMO)-SUS
Run status
Ready status
Suspend status
Dormant status
Sleep state
Sleep state (WAIT−SUSPEND)
Time wait state due to dly_tsk
Time wait state due to dly_tsk (WAIT−SUSPEND)
Event flag wait status
Event flag wait status (WAIT−SUSPEND)
Semaphore wait status
Semaphore wait status (WAIT−SUSPEND)
Message wait status
Message wait status (WAIT−SUSPEND)
Sleep state with time-out
Sleep state with time-out (WAIT−SUSPEND)
Event flag wait state with time-out1
Event flag wait state with time-out (double wait)1
Semaphore wait state with time-out1
Semaphore wait state with time-out (double wait)1
Message wait state with time-out1
Message wait state with time-out (double wait)1
The following are displayed in the flg_mode area:
flg_mode
Status
TWF_ANDW
Waiting for all bits specified in wait bit pattern to be set (AND wait)
TWF_ANDW + TWF_CLR When an AND wait has occurred and the task is in the wait status,
the event flag is cleared to 0.
TWF_ORW
Waiting for any bit specified in wait bit pattern to be set (OR wait)
TWF_ORW + TWF_CLR When an OR wait has occurred and the task is in the wait status, the
event flag is cleared to 0.
Each display area can have its display width changed by dragging the mouse to the desired
position.
In TSK mode, the horizontal scroll bar is not displayed.
In TSK mode, you can double-click the mouse in the Real-time OS status area to display the
Context dialog box. The Context dialog box contains context information about the task of the line
in which the mouse was double-clicked.
See "To display task context" for details of the Context dialog box.
1
These states are supported by MR79 V.2.00 or later. These states are not displayed for the target programs using
earlier versions of MR79 than that.
219
P D 7 9 S I M U s e r ’s M a n u a l
To display the status of the ready queue
Click the "RQ" button on the toolbar of the MR Window, or select the following from the menu:
[Option] −> [Mode] −> [Ready Q]
The following shows the configuration of the MR Window in ready queue status mode.
The following items are displayed in RQ mode. Of the priorities defined in configuration, the items
are displayed in order of priority only for those tasks in the ready queue.
Pri:
RdyQ:
Shows priority
Shows the ID Nos. and task names of tasks in the ready queue
In RQ mode, the status bar shows the following information:
Current Run Task:
Number of Priority:
ID and task name of currently running task
Maximum value of priority
Task names displayed in the RdyQ area are indicated in up to 8 characters each.
consists of more than 8 characters, the extra characters are omitted.
If a task name
When you move the mouse pointer to the data position displayed in the RdyQ area, a window like
the one shown below appears, showing information about the task (same contents as shown in TSK
mode).
Window to display detail
information on task
Each display area can have its display width changed by dragging the mouse to the desired
position.
In RQ mode, the horizontal scroll bar is displayed simultaneously when data is displayed.
this scroll bar to scroll the data contents displayed in the RdyQ area.
220
Use
Real-time OS Debugging Function
To display the status of the timeout queue
Click the "TIM" button on the toolbar of the MR Window, or select the following from the menu:
[Option] −> [Mode] −> [Timeout Q]
The following shows the configuration of the MR Window in timeout queue status mode.
The following items are displayed in TIM mode. The items are displayed in ascending order of
timeout values for the tasks currently in the wait status.
Value:
ID (name):
Shows the timeout value of each task
Shows the ID No. and task name of the tasks in the timeout queue
And, the character strings that show wait state are as follows.
Character string
[slp]
[dly]
[flg]
[sem]
[mbx]
Wait status
Wait by tslp_tsk
Wait by dly_tsk
Wait due to twai_flg.2
Wait due to twai_sem.2
Wait due to trcv_msg.2
In TIM mode, the status bar is not displayed.
If the tasks in the timeout queue are also in the suspended wait state (WAIT−SUSPEND), an "[s]"
is displayed after the character string in the ID(name) field to indicate that it is also in the
WAIT−SUSPEND state.
Normal display:
Display when in WAIT−SUSPEND:
2
26(_task26)[dly]
26(_task26)[dly][s]
These states are supported by MR79 V.2.00 or later. These states are not displayed for the target programs using
earlier versions of MR79 than that.
221
P D 7 9 S I M U s e r ’s M a n u a l
When you move the mouse pointer to the data position displayed in the ID(name) area, a window
like the one shown below appears, showing information about the task (same contents as shown in
TSK mode).
Window to display detail
information on task
Each display area can have its display width changed by dragging the mouse to the desired
position.
In TIM mode, the horizontal scroll bar is not displayed.
To display the event flag status
Click the "FLG" button on the toolbar of the MR Window, or select the following from the menu:
[Option] −> [Mode] −> [Event Flag]
The following shows the configuration of the MR Window in event flag status mode.
The following items are displayed in FLG mode. The items are displayed in order of ID No. for all
event flags defined in configuration.
ID
flg_ptn
flagQ
ID No. of event flag
Bit pattern of each event flag
Task ID Nos. and task names in the event flag queue
In FLG mode, the status bar is not displayed.
If the task pending in an event flag queue is further placed in a wait state with time-out (wait
state due to twai_flg), a character string "[tmo]" to indicate a wait state with time-out is added
after the character string displayed in the flagQ area (for the targets using MR79 V.2.00 or
later).
Normal display:
Display when event flag wait state with time-out
222
26 (_task26)
26 (_task26)[two].
Real-time OS Debugging Function
If the tasks in the flag event queue are also in the suspended wait state (WAIT−SUSPEND), an
"[s]" is displayed after the character string in the ID(name) field to indicate that it is also in the
WAIT−SUSPEND state.
Normal display:
Display when in WAIT−SUSPEND:
Display when in WAIT−SUSPEND with time out:3
26 (_task26)
26 (_task26)[s].
26 (_task26)[tmo][s].
Task names displayed in the flagQ area are indicated in up to 8 characters each.
If a task name consists of more than 8 characters, the extra characters are omitted.
When you move the mouse pointer to the data position displayed in the flagQ area, a window like
the one shown below appears, showing information about the task (same contents as shown in TSK
mode).
Window to display detail
information on task
Each display area can have its display width changed by dragging the mouse to the desired
position.
In FLG mode, the horizontal scroll bar is displayed simultaneously when data is displayed.
this scroll bar to scroll the data contents displayed in the flagQ area.
Use
To display the semaphore status
Click the "SEM" button on the toolbar of the MR Window, or select the following from the menu:
[Option] −> [Mode] −> [Semaphore]
The following shows the configuration of the MR Window in semaphore status mode.
3
These states are supported by MR79 V.2.00 or later. These states are not displayed for the target programs using
earlier versions of MR79 than that.
223
P D 7 9 S I M U s e r ’s M a n u a l
The following items are displayed in SEM mode. The items are displayed in order of ID No. for all
semaphores defined in configuration.
ID
Def_cnt
Count
semQ
ID No. of semaphore
Default value of semaphore counter
Semaphore count
Task ID Nos. and task names in the semaphore queue
In SEM mode, the status bar is not displayed.
If the task pending in a semaphore queue is further placed in a wait state with time-out (wait
state due to twai_sem), a character string "[tmo]" to indicate a wait state with time-out is added
after the character string displayed in the semQ area (for the targets using MR79 V.2.00 or
later).
Normal display:
Display when in semaphore wait state with time-out
26 (_task26)
26 (_task26)[two].
If the tasks in the semaphore queue are also in the suspended wait state (WAIT−SUSPEND), an
"[s]" is displayed after the character string in the flagQ field to indicate that it is also in the
WAIT−SUSPEND state.
Normal display:
Display when in WAIT−SUSPEND:
Display when in WAIT−SUSPEND with time out:4
26 (_task26)
26 (_task26)[s].
26 (_task26)[tmo][s].
Task names displayed in the semQ area are indicated in up to 8 characters each.
consists of more than 8 characters, the extra characters are omitted.
If a task name
When you move the mouse pointer to the data position displayed in the semQ area, a window like
the one shown below appears, showing information about the task (same contents as shown in TSK
mode).
Window to display detail
information on task
Each display area can have its display width changed by dragging the mouse to the desired
position.
In SEM mode, the horizontal scroll bar is displayed simultaneously when data is displayed.
this scroll bar to scroll the data contents displayed in the semQ area.
4
Use
These states are supported by MR79 V.2.00 or later. These states are not displayed for the target programs using
earlier versions of MR79 than that.
224
Real-time OS Debugging Function
To display the mailbox status
Click the "MBX" button on the toolbar of the MR Window, or select the following from the menu:
[Option] −> [Mode] −> [Mailbox]
The following shows the configuration of the MR Window in mailbox status mode.
The following items are displayed in MBX mode. The items are displayed in order of ID No. for all
mailboxes defined in configuration.
ID
Msg_cnt
MAXmsg
Wait QUEUE (Message)
ID No. of mailbox
Number of messages in each mailbox
Maximum number of messages that can be
contained in each mailbox
The messages stored in the mailbox or ID No. and
task name of tasks waiting for messages
In MBX mode, the status bar is not displayed.
The contents displayed in the WaitQueue (Message) area are as follows:
l
l
If a message is stored (when Msg_cnt above is not 0), a character string "Msg" is displayed,
followed by the message that is stored in the mailbox.
If no message is stored (when Msg_cnt above is 0) and any task waiting for a message exists,
a character string "Task" is displayed, followed by the ID number and the name of the task
that is waiting for a message.
If the task pending in a mailbox queue is further placed in a wait state with time-out (wait state
due to trcv_msg), a character string "[tmo]" to indicate a wait state with time-out is added after
the character string displayed in the WaitQueue (Message) area (for the targets using MR79
V.2.00 or later).
Normal display:
Display when mailbox wait state with time-out
225
26 (_task26)
26 (_task26)[two].
P D 7 9 S I M U s e r ’s M a n u a l
If the task pending in a mailbox queue is further placed in a forced wait state (double wait state), a
character string "[s]" to indicate a double wait state is added after the character string displayed in
the WaitQueue (Message) area.
Normal display:
Display when in WAIT−SUSPEND:
Display when in WAIT−SUSPEND with time out:5
26 (_task26)
26 (_task26)[s].
26 (_task26)[tmo][s].
Task names displayed in the WaitQueue (Message) area are indicated in up to 8 characters each. If
a task name consists of more than 8 characters, the extra characters are omitted.
When you move the mouse pointer to the data position displayed in the WaitQueue (Message) area,
a window like the one shown below appears, showing information about the task (same contents as
shown in TSK mode).
Window to display detail
information on task
Each display area can have its display width changed by dragging the mouse to the desired
position.
In MBX mode, the horizontal scroll bar is displayed simultaneously when data is displayed. Use
this scroll bar to scroll the data contents displayed in the WaitQueue (Message) area.
To display the cycle handler status
Click the "CYH" button on the toolbar of the MR Window, or select the following from the menu:
[Option] −> [Mode] −> [Cyclic Handler]
The following shows the configuration of the MR Window in cycle handler status mode.
The following items are displayed in CYH mode. The items are displayed in order of ID No. for all
cycle handlers defined in configuration.
ID
StaAddr
(name)
interval
5
ID No. of cycle handler
Starting address of cycle handler
Name of cycle handler
Interrupt interval
These states are supported by MR79 V.2.00 or later. These states are not displayed for the target programs using
earlier versions of MR79 than that.
226
Real-time OS Debugging Function
count
Status
Interrupt count
Activity status of cycle start handler
In CHY mode, the status bar is not displayed.
The following are displayed in the Status area:
TCY_ON
TCY_OFF
Cycle handler enabled
Cycle handler disabled
Each display area can have its display width changed by dragging the mouse to the desired
position.
In CYH mode, the horizontal scroll bar is not displayed.
To display the alarm handler status
Click the "ALH" button on the toolbar of the MR Window, or select the following from the menu:
[Option] −> [Mode] −> [Alarm Handler]
The following shows the configuration of the MR Window in alarm handler status mode.
The following items are displayed in ALH mode. The items are displayed in order of starting time
for all alarm handlers defined in configuration that have currently not been started.
ID
StaAddr
(name)
AlarmTime
ID No. of alarm handler
Starting address of alarm handler
Name of alarm handler
Starting time of alarm handler
In ALH mode, the status bar shows the following:
Remain Handler
The number of alarm handlers waiting to be started and the
current system clock count
Each display area can have its display width changed by dragging the mouse to the desired
position.
In ALH mode, the horizontal scroll bar is not displayed.
227
P D 7 9 S I M U s e r ’s M a n u a l
To display the memory pool status
Click the "MPL" button on the toolbar of the MR Window, or select the following from the menu:
[Option] −> [Mode] −> [Memory Pool]
The following shows the configuration of the MR Window in memory pool status mode.
The following items are displayed in MPL mode. The items are displayed in order of ID No. for all
memory pools defined in configuration (fixed length first, followed by variable length).
ID
BaseAddr
Blk_size
Total Blk_cnt
Free Blk_cnt (map)
ID No. of memory pool
Base address of memory pool
Block size of memory pool
Total block count of memory pool
Number of unused blocks and information on unused
memory blocks (bit information)
In MPL mode, the status bar is not displayed.
Because of the differences between fixed length and variable length, the contents of the ID area
differ as follows:
l
l
Fixed length: "[F]" is displayed with the memory pool ID No.
Variable length: "[V]" is displayed with the block ID NO. In this case, the block ID is
enclosed in parentheses("()").
In the case of variable-length memory pools, nothing is shown in the Total Blk_cnt area ("—" is
displayed). No bit information is shown in the Free Blk_cnt(map) area either.
In this case of fixed-length memory pools, each bit of memory block information in the Free
Blk_cnt(map) area is formatted as follows:
'0'
'1'
'-'
memory block in use (busy)
Memory block not in use (ready)
No memory block
Each display area can have its display width changed by dragging the mouse to the desired
position.
In MPL mode, the horizontal scroll bar is not displayed.
228
Real-time OS Debugging Function
To display task context
Select the following from the menu:
[Option] −> [MR] −> [Context]
or double click the data area in TSK mode to open the Context dialog box. Use the Context dialog
box to check and set context information for specified tasks.
The following shows the configuration of the Context dialog box.
Enter the task ID No. in the Task ID: area, then click the <View> button (or press the Enter key) to
display the context for the specified task in the Context: area.
No context is displayed when the task specified in the Task ID: area is in the RUN or DMT state
(only the task ID and task status is displayed in the Context: area).
An error dialog box is displayed if you specify a non-existent task ID in the Task ID: area.
You can also enter a task ID No. in the Task ID: area, then click the <Set...> button to open the Set
Context dialog box. Use the Set Context dialog box to set the context values of the specified task.
When you close the Set Context dialog box, the Context: area is updated to show the context
information with the new settings. See "To change the task context..." for details of the Set Context
dialog bog.
An error dialog box is displayed when the task entered in the Task ID: area is in the RUN or DMT
state, or you specify the ID No. of a task that does not exist.
Click the <Close> button to close the Context dialog box.
229
P D 7 9 S I M U s e r ’s M a n u a l
To change the task context
Enter the task ID No. in the Task ID: area of the Context dialog box, then click the <Set> button to
open the Set Context dialog box.
Use the Set Context dialog box to change the value of the specified context register of the specified
task.
The following shows the configuration of the Set Context dialog box.
The task ID No. you entered in the Task ID: area of the Context dialog box is already displayed in
the Task ID: area of the Set Context dialog box when it is opened.
Specify the name of the register for which the value is to be set in the Register: area. Select a
context register name from the list of context registers for the specified task from the list in the
combo box.
Enter the value to be set in the context register in the Value: area.
After making the necessary settings, click the <OK> button (or press the Enter key) to set the
specified data in the specified context register of the specified task, and simultaneously close the
Set Context dialog box.
An error dialog box is displayed if an error is detected in the expression set in the Value: area, or if
the value exceeds the allowable range for the specified register.
To cancel the settings in each field and close the Set Context dialog box, click the <Cancel> button.
2.2 Measuring Sizes of System and Task Stacks Used
PD79SIM allows you to measure the size of the system stack used when executing a program and the
size of the stack used for each task during this program execution. The system/task stack
measurement function is implemented by a script command. The command name is MR STK.
Note:
Please use the startup file(crt0mr.a79/start.a79) whose contents matches with the
version of MR79, when you make downloaded program.
The MR STK command will not run properly if the startup file you uses don't match
with the version of MR79.
230
Real-time OS Debugging Function
[Input format]
Format 1 MR STK, SYS
Format 2 MR STK, TSK {, task ID number}
Format 3 MR STK, BASE
Format 4 MR STK, CLEAR
[Function]
Format 1
Format 2
Format 3
Format 4
Displays the result of system stack usage measurement.
Displays the result of task stack usage measurement.
Prepares for measuring the stack usage.
Initializes the result of stack usage measurement.
To measure the sizes of the system/task stacks used
(1) Prepare for measuring the stack usage using Format 3.
To do this preparation, input a command as follows:
MR STK, BASE
(2) Initialize the result of stack usage measurement using Format 4.
To do this initialization, input a command as follows:
MR STK, CLEAR
(3) Execute the target program.
Then when the program execution is stopped, PD79SIM measures the size of stacks used
immediately after the previous measurement result is initialized.
To reference the size of the system stack used
(1) Measure the size of the system stack used.
(2) Display the result of system stack usage measurement using Format 1.
To do this display, input a command as follows:
MR STK, SYS
Displaying measurement results
Following contents are displayed.
First line:
Second line:
Third line:
The start and end addresses of the system stack
area and the result of stack usage measurement
(indicated in percent)
The size of the actually used stack in bytes
The size of the entire stack area in bytes
>mr stk, sys<RET>
System Stack
( 00052H-000921H):
Stack size( used) is 15 bytes.
Stack size(whole) is 1024 bytes.
>
231
1.46%
P D 7 9 S I M U s e r ’s M a n u a l
If the measurement result is 100%, a comment is displayed to the right of the stack usage
measurement result (indicated in percent) to the effect that the stack may have overflowed.
>mr stk, sys<RET>
System Stack
( 000522H-000921H):
Stack size(used) is 1024 bytes.
Stack size(whole) is 1024bytes.
>
100.00% ##overflow?##
If the system stack area is out of the scope of stack usage measurement, no stack usage
measurement result is displayed.
>mr stk, sys<RET>
System Stack
( 000522H-000921H):
>
*****%
To reference the size of the stack used for each task
(1) Measure the size of the stack used for each task.
(2) Display the result of task stack usage measurement using Format 2.
To do this display, input a command as follows:
MR STK, TSK
To display the measured size of the stack used for a specific task only, input a command as
shown below. Note that the data in the third argument is handled as being represented in
decimal.
MR STK, TSK, task ID number
<Displaying measurement results>
If the third argument (task ID number) is omitted, the measured sizes of the stacks used for all
tasks are displayed. If a task ID number is specified in the third argument, the measured size of
the stack used for the specified task is displayed.
If the third argument is omitted (i.e., measurement results displayed for all tasks), the
measurement results being displayed can be finished in the middle by pressing the STOP button.
Following contents are displayed.
However, if the third argument is omitted (i.e., measurement results displayed for all tasks),
information on only the first line is displayed.
First line:
Second line:
Third line:
Task ID number, task name, the start and end
addresses of the task stack area, and the result of
stack usage measurement (indicated in percent)
The size of the actually used stack in bytes
The size of the entire stack area in bytes
232
Real-time OS Debugging Function
> mr stk, tsk <RET>
[ 1] _main
( 000922H-000985H ) :
[ 2] _task2
( 000986H-0009E9H ) :
[ 3] _task3
( 0009EAH-000A4DH ) :
[ 4] _task4
( 000A4EH-000AB1H ) :
[ 5] _task5
( 000AB2H-000B15H ) :
> mr stk, tsk, 3 <RET>
[ 3] _task3
( 0009EAH-000A4DH ) :
Stack size(used) is 32 bytes.
Stack size(whole) is 100 bytes.
>
20.00%
56.00%
32.00%
22.00%
0.00%
32.00%
If the measurement result is 100%, a comment is displayed to the right of the stack usage
measurement result (indicated in percent) to the effect that the stack may have overflowed.
> mr stk, tsk <RET>
[ 1] _main
( 000922H-000985H ) :
100.00% ##overflow?##
[ 2] _task2
( 000986H-0009E9H ) :
56.00%
[ 3] _task3
( 0009EAH-000A4DH ) : 100.00% ##overflow?##
[ 4] _task4
( 000A4EH-000AB1H ) : 22.00%
[ 5] _task5
( 000AB2H-000B15H ) :
0.00%
> mr stk, tsk, 3 <RET>
[ 3] _task3
( 0009EAH-000A4DH ) : 100.00% ##overflow?##
Stack size(used) is 100 bytes.
Stack size(whole) is 100 bytes.
>
If the task stack area is out of the scope of stack usage measurement, no stack usage
measurement result is displayed.
> mr stk, tsk <RET>
[ 1] _main
( 000922H-000985H ) :
[ 2] _task2
( 000986H-0009E9H ) :
[ 3] _task3
( 0009EAH-000A4DH ) :
[ 4] _task4
( 000A4EH-000AB1H ) :
[ 5] _task5
( 000AB2H-000B15H ) :
> mr stk, tsk, 3 <RET>
[ 3] _task3
( 0009EAH-000A4DH ) :
>
******%
******%
******%
******%
******%
******%
If a nonexistent task ID number is specified in the third argument, an error message "Task ID is
out of range" will be displayed.
> mr stk, tsk <RET>
[ 1] _main
( 000922H-000985H ) :
[ 2] _task2
( 000986H-0009E9H ) :
[ 3] _task3
( 0009EAH-000A4DH ) :
[ 4] _task4
( 000A4EH-000AB1H ) :
[ 5] _task5
( 000AB2H-000B15H ) :
> mr stk, tsk, 6 <RET>
ERROR 1221: Task ID is out of range.
>
233
20.00%
56.00%
32.00%
22.00%
0.00%
P D 7 9 S I M U s e r ’s M a n u a l
[ MEMO ]
234
Reference
235
236
Table of Script Commands
1 Table of Script Commands
1.1 Input Format
l
The format for entering PD79SIM script commands is as follows:
1.
2.
l
Insert one or more spaces or tabs between the command and its parameter(s).
You can use uppercase and lowercase letters and numerics for the command.
Description of symbols used in command format
Parameter
Command format
XXXX
[ XXXX ]
{ X1 | X2 | X3 }
[ { X1 | X2 | X3 } ]
XXXX must be input
XXXX is optional
One of X1, X2, or X3 must be input
Input can be omitted, or you can input one of X1, X2, or X3
237
P D 7 9 S I M U s e r ’s M a n u a l
1.2 Tables of Commands
In the following tables of commands, commands shown with half-tone screening can be executed at
run time.
The abbreviated forms of commands are shown in parenthesis after the full command.
See the PD79SIM on-line help for details of each command. To display on-line help, enter the
following from the PD79SIM Window menu:
[ Help ] −> [ Index ]
1.2.1 Execution Commands
Command
Command format
Summary
Go(G)
GoFree(GF)
STOP
STATUS
Go [ start address ]
GoFree [ start address ]
STOP
STATUS
Step(S)
StepInstruction(SI)
Step [ number of steps ]
StepInstruction [ number of steps ]
OverStep(O)
OverStepInstruction (OI)
OverStep [ number of steps ]
OverStepInstruction [ number of steps ]
RETurn(RET)
RETurnInstruction(RETI)
RETurn
RETurnInstruction
RESET
RESET
Run target program.
Free-run target program.
Stop target program.
Display status of target program
execution.
Step execution at source level.
Step execution at machine language
level.
Over-step execution at source level.
Over-step execution at machine
language level.
Return execution at source level.
Return execution at machine language
level.
Reset target program.
1.2.2 File Operation Commands
Command
Command format
Summary
Load(L)
LoadHex(LH)
LoadMot(LM)
LoadSymbol(LS)
UploadHex(UH)
Load filename [.x79]
LoadHex filename [ .hex ]
LoadMot filename [ .mot ]
LoadSymbol filename [ .x79 ]
UploadHex start address, end address, filename
UploadMot(UM)
UploadMot start address, end address, filename
Download x79 file.
Download hex file.
Download mot file.
Download debugging information.
Output contents of specified memory
area to hex file.
Output contents of specified memory
area to mot file.
1.2.3 Register Operation Commands
Command
Command format
Summary
Register(R)
(1) Register [ register name ]
(2) Register register name, set value
(1) Check value of specified register.
(2) Set value of specified register.
238
Table of Script Commands
1.2.4 Memory Operation Commands
Command
Command format
Summary
DumpByte(DB)
DumpWord(DW)
DumpDword(DD)
SetMemoryByte(MB)
DumpByte [ start address [, end address ] ]
DumpWord [ start address [, end address ] ]
DumpDword [ start address [, end address ] ]
setMemoryByte address [, set value [, ... ] ]
SetMemoryWord(MW)
setMemoryWord address [, set value [, ... ] ]
SetMemoryDword(MD)
setMemoryDword address [, set value [, ... ] ]
FillByte(FB)
FillByte start address, end address, set value
FillWord(FW)
FillWord start address, end address, set value
FillDword(FD)
FillDword start address, end address, set value
MOVE
MOVE start address1, end address, start address2
MOVEWord(MOVEW)
MOVEWord start address1,end address, start
address2
Display contents of memory in 1-byte units.
Display contents of memory in 2-byte units.
Display contents of memory in 4-byte units.
Change contents of memory at specified address
in 1-byte units. Enter "." to stop.
Change contents of memory at specified address
in 2-byte units. Enter "." to stop.
Change contents of memory at specified address
in 4-byte units. Enter "." to stop.
Write specified data to specified address range in
1-byte units.
Write specified data to specified address range in
2-byte units.
Write specified data to specified address range in
4-byte units.
Move contents of specified memory range to
destination address.
Move contents of specified memory range to
destination address in 2-byte units..
1.2.5 Assemble/Disassemble Commands
Command
Command format
Summary
Assemble(A)
DisAssemble(DA)
MODule(MOD)
SCOPE
Assemble [ address ]
DisAssemble [start address[,end address [,m,x]]]
MODule
(1) SCOPE
(2) SCOPE module name
SECTION
(1) BIT
(2) BIT { GLOBAL | G } [, bit symbol ]
(3) BIT { LOCAL | L } [, bit symbol ]
(4) BIT { GLOBAL | G }, bit symbol, data
Assemble line-by-line from specified address.
Display result of disassembling specified area.
Display all modules (object names).
(1) Display current scope.
(2) Set scope to specified module.
Display section information.
(1) Display all bit symbols.
(2) Display global bit symbols.
(3) Display local bit symbols.
(4) Set value of bit showed by specified global bit
symbol.
(5) Set value of bit showed by specified local bit
symbol.
(1) Display all symbols.
(2) Display global symbols.
(3) Display local symbols.
Display value of specified assembler expression.
SECtion(SEC)
BIT
(5) BIT { LOCAL | L }, bit symbol, data
SYMbol(SYM)
EXPress(EXP)
(1) SYMbol
(2) SYMbol { GLOBAL | G } [, symbol ]
(3) SYMbol { LOCAL | L } [, symbol ]
EXPress assembler expression
239
P D 7 9 S I M U s e r ’s M a n u a l
1.2.6 Software Break Setting Commands
Command
Command format
Summary
SoftwareBreak(SB)
(1) SoftwareBreak
(1) Display currently set software
break points.
(2) Set software break point at
specified address.
Delete software break point at
specified address.
Delete all software break points.
(2) SoftwareBreak address
SoftwareBreakClear(SBC)
SoftwareBreakClear address
SoftwareBreakClearAll
(SBCA)
SoftwareBreakDisable
(SBD)
SoftwareBreakDisableAll
(SBDA)
SoftwareBreakEnable
(SBE)
SoftwareBreakEnableAll
(SBEA)
BREAKAT
SoftwareBreakClearAll
BREAKIN
BREAKIN function name [ ,module name ]
SoftwareBreakDisable address
Disable software break point at
specified address.
Disable all software break points.
SoftwareBreakDisableAll
SoftwareBreakEnable Address
Enable software break point at
specified address.
Enable all software break points.
SoftwareBreakEnableAll
BREAKAT line No. [ ,source filename ]
Set software break point at
specified line No.
Set software break point at start of
specified function.
1.2.7 Hardware Break Setting Commands
Command
Command format
Summary
HardwareBreak(HB)
(1) HardwareBreak
(2) HardwareBreak address,
{ READ | WRITE | RW | FETCH }[, [ passes ]
[, [ { BYTE | WORD } ][, reference-data
[, comparison-condision ] ] ] ]
HardwareBreakClear address
(1) Reference hardware break point.
(2) Set hardware break point.
See page 243 for details.
HardwareBreakClear
(HBC)
HardwareBreakClearAll
(HBCA)
BreakMode(BM)
HardwareBreakClearAll
Clears hardware break point at
specified address.
Clears all hardware break points.
(1) BreakMode
(2) BreakMode { ON | OFF }
(1) Check hardware break mode.
(2) Set hardware break mode.
1.2.8 Coverage Measurement Commands
Command
Command format
Summary
CoVerage(CV)
(1) Coverage
(2) Coverage LOCAL [, start address, end address ]
(3) Coverage GLOBAL [, start address, end address ]
(4) Coverage TOTAL [, start address, end address ]
(5) Coverage FUNC
(6) Coverage CLEAR
(7) Coverage DISP, starting address for displaying
(1) Check starting address for displaying the
results of coverage measurements.
(2) Display results of coverage measurements
in 1-byte units.
(3) Display results of coverage measurements
in 4-byte units.
(4) Display results of coverage measurements
as percentages.
(5) Display results of coverage measurements
of sub-routines as percentages.
(6) Initialize memory for coverage
measurements.
(7) Set starting address for displaying the
results of coverage measurements.
See page 245 for details.
240
Table of Script Commands
1.2.9 StackMonitor Command
Command
Command format
Summary
StackMonitor(SM)
(1) StackMonitor
(2) StackMonitor { ON | OFF }
(1) Checks the stack monitor mode.
(2) Turns the stack monitor on/off.
1.2.10 Cycle Count Command
Command
Command format
Summary
CYcle(CY)
(1) CYcle
(2) CYcle { ON | OFF }
(1) Checks the cycle count mode.
CYCLE OFF: The number of total execution cycles
is displayed.
CYCLE ON: The number of accumulation
execution cycles from the CYCLE ON specification
is displayed.
(2) Turns the cycle count on/off.
1.2.11 Script/Log-File Commands
Command
Command format
Summary
SCRIPT
EXIT
WAIT
PAUSE
SCRIPT filename
EXIT
WAIT [ BREAK ]
PAUSE “MESSAGE”
SLEEP
LOGON
LOGOFF
SLEEP number of seconds
LOGON [ filename [ .file attribute ] ]
LOGGOFF
Open script file.
Close script file.
Wait for command input until target program stops.
Display specified message in Pause dialog box and wait for
user to press button.
Wait for command input for specified number of seconds.
Open log file.
Close log file.
1.2.12 Program Window Control Commands
Command
Command format
Summary
PATH
FILE
PATH [ search pass [ ;search pass ;.... ] ]
(1) FILE
(2) FILE source filename
(1) FUNC
(2) FUNC function name [, module name ]
UP
DOWN
WHERE
Set source file path.
(1) List source files.
(2) Display specified source file.
(1) List functions.
(2) Display specified function.
Display calling function.
Display called function.
Display function call status.
FUNC
UP
DOWN
WHERE
1.2.13 Map Command
Command
Command format
Summary
MAP
(1) MAP
(2) MAP start address, end address
(1) Check mapping information.
(2) Set target memory space.
1.2.14 C-Language Debugging Commands
Command
Command format
Summary
PRINT
SET
PRINT variable expression
SET variable expression, value
Check value of specified C variable expression.
Set specified data in specified C variable expression.
241
P D 7 9 S I M U s e r ’s M a n u a l
1.2.15 Real-time OS Commands
Command
Command format
Summary
MR
(1) MR [ TSK ]
(2) MR { RQ | R }
(3) MR { TIM | TOUT | T }
(4) MR { FLG | FLAG | F }
(5) MR { SEM | S }
(6) MR { MBX | M }
(7) MR { CYH | CYC | C }
(8) MR { ALH | ALM | A }
(9) MR { RTSK | RT }
(10) MR { STIM | ST }
(11) MR { CTX | CT }, Task No.
(1) Display status of specified task.
(2) Display status of ready queue.
(3) Display status of time-out queue.
(4) Display status of event flag.
(5) Display status of semaphore.
(6) Display status of mailbox.
(7) Display status of cycle handler.
(8) Display status of alarm handler.
(9) Display task during execution.
(10) Display system clock count.
(11) Display context of task with
specified task No.
(12) Display Displays the memory pool.
(13) Measure the system stack task
sizes used.
See page 247 for details.
(12) MR MPL
(13) MR STK, { SYS | TSK | BASE | CLEAR }
1.2.16 Custom Command Program/Custom Window Program
Command
Command format
Summary
MACRO
(1)MACRO
(2)MACRO custom command’s programname/
custom window’s program
DELMACRO
DELMACLRO custom command’s programname/
custom window’s program
DELMACROALL
(1) Refrence a list of added custom command
and custom window programs.
(2) Add a specified custom command and custom
window program.
Delete a specified custom command and
ccustom window program.
Delete all specified custom command and
ccustom window programs.
(1) Refrence the search directory that is set.
(2) Set the directory where to search for custom
command and custom window programs.
DELMACROALL
MACROPATH(MPATH)
(1) MACROPATH
(2) MACROPATH directory_name
1.2.17 Utility Commands
Command
Command format
Summary
RADIX
(1) RADIX
(2) RADIX { 2 | 8 | 10 | 16 }
(1) ALIAS
(2) ALIAS new name , command name
UNALIAS new name
UNALIASALL
VERsion
DATE
(1) Check radix for input of constants.
(2) Set radix for input of constants.
(1) Check definition of command alias.
(2) Define command alias.
Delete specified alias.
Delete all aliases.
Display PD79SIM versions.
Display current date and time (yymmdd, and
time).
Display specified parameter.
Quit PD79SIM.
(1) Checks the current directory.
(2) Sets the current directory.
ALIAS
UNALIAS
UNALIASALL
VERsion(VER)
DATE
ECHO
QUIT
CD
ECHO “MESSAGE”
QUIT
(1) CD
(2) CD directory_name
242
Table of Script Commands
1.2.18 Supplementation explanation of Script Commands
HardwareBreak(HB)
Setting and Checking Hardware Breaks
Input format
Format 1:
Format 2:
Format 3:
Format 4:
Format 5:
HardwareBreak
HardwareBreak address, FETCH [, passes ]
HardwareBreak address, access-condition [, passes ]
HardwareBreak address, access-condition, [ passes ], size
HardwareBreak address, access-condition, [ passes ], [ size ]
, reference-data [, Comparison-condition ]
The following table shows the values that can be specified for access-condition, size, and
comparison condition.
Access-condition
size
Comparison-condition
READ, R, WRITE, W, RW
BYTE, B, WORD, W
<, >, <=, >=, !=, ==
Function:
l
l
l
Hardware breaks allow you to stop target program execution on detection of data being
read from or written to memory or on detection of an instruction fetch.
PD79SIM allows a maximum of 64 hardware breakpoints to be set.
To use hardware breaks, use the BreakMode command as shown below to enable the break.
BreakMode ON
Checking hardware break settings
Use format 1. Enter the following to display the contents of the hardware break setting.
HardwareBreak
Stopping program execution on execution of the instruction at the
specified address
Use format 2.
l
Enter the following to stop execution of the target program on execution of the
instruction at address 8000016.
HardwareBreak 80000, FETCH
l
Enter the following to stop execution of the target program on 10th execution of the
instruction at address 8000016.
HardwareBreak 80000, FETCH, 10
If not specified, the default number of passes is 1. (This also applies to other formats.)
243
P D 7 9 S I M U s e r ’s M a n u a l
Stopping program execution when data at the specified address is
accessed
Use formats 3, 4, or 5.
Format 3
Format 4
Format 5
The following table shows the differences between the respective formats.
Use to stop program execution regardless of the value of the accessed data.
Use to stop program execution according to the size of the accessed data.
Use to stop program execution according to the accessed data.
l
Enter the following to stop program execution when any data is written to address
3016 (format 3).
HardwareBreak 30, WRITE
You can abbreviate WRITE to W. Specify READ or R to stop program execution when
data is read, or RW when data is read or written.
l
Enter the following to stop execution when 2 bytes of data is written to address 3016
(format 4):
HardwareBreak 30, WRITE , , WORD
You can abbreviate WRITE to W. Specify BYTE or B to stop execution when 1 byte of
data is written to address 3016.
If not specified, the default size is BYTE. (This also applies to other formats.)
l
Enter the following to stop program execution when a value of 5016 is written to 3016
(format 5).
HardwareBreak 30, WRITE , , , 50
As with other formats, '==' is assumed if data is specified for comparison but no
condition is specified. (This also applies to other formats.)
Enter the following to stop program execution when a value of 123416 is written to 3016
(format 5).
HardwareBreak 30, WRITE, , WORD, 1234
l
l
Enter the following to stop program execution when a value of 5016 or more is written
to 3016 (format 5).
HardwareBreak 30, WRITE, , , 50, >=
244
Table of Script Commands
CoVerage(CV)
Coverage Measurement
Use the coverage measuring function to check addresses accessed during execution. The coverage
measurement function is realized using the CoVerage (CV) script command. For details of using
script commands, see Section 7.1, "Executing Script Commands" in the Basic Operation part.
Input format:
Format 1:
Format 2:
Format 3:
Format 4:
Format 5:
CoVerage
CoVerage { LOCAL | GLOBAL | TOTAL }[, starting_address, ending_address ]
CoVerage FUNC
CoVerage CLEAR
CoVerage DISP, starting address for displaying the results of coverage
Function:
l
The coverage function records addresses that have been accessed during execution of the
target program (C0 coverage).
To run coverage measurement and log access details
Run the target program. See Section 2.1, "Starting and Stopping" in the Basic Operation for
details.
To check accessed addresses
Use formats 2 and 3. You can check addresses from 00000016 to FFFFFF16.
l
Enter the following to check the results of coverage measurements between address
800016 and 8FFF16 in 1-byte units (format 2):
CoVerage LOCAL, 8000, 8FFF
l
Enter the following to check the results of coverage measurements between address
800016 and 8FFF16 in 4-byte units (format 2):
CoVerage GLOBAL, 8000, 8FFF
l
Enter the following to check the results of coverage measurements between address
800016 and 8FFF16 displayed as a percentage (format 2):
CoVerage TOTAL, 8000, 8FFF
l
Enter the following to check the results of coverage measurements displayed as
percentages of subroutines (functions) (format 3):
CoVerage FUNC
To initialize the previous results of coverage measurements
Use format 4.
l
Enter the following to initialize the results of coverage measurements:
CoVerage CLEAR
245
P D 7 9 S I M U s e r ’s M a n u a l
To check and set the starting address for displaying the results of
coverage measurements
Use format 1 or format 5. If you omit the starting or ending address when checking the results of
coverage measurements, the system displays 1KB of results from the display starting address.
l
Enter the following to check the display starting address for the results of coverage
measurements:
CoVerage
l
Enter the following to specify address C000016 as the starting address for displaying
the results of coverage measurements.
CoVerage DISP, C0000
If, without specifying a starting or ending address, you check the results of coverage
measurements after setting the display starting address to C000016, the display
extends from C000016 to C040016.
246
Table of Script Commands
MR
Display status of real-time OS (MR79)
Input format
(Format 1)
(Format 2)
(Format 3)
(Format 4)
(Format 5)
(Format 6)
(Format 7)
(Format 8)
(Format 9)
(Format 10)
(Format 11)
(Format 12)
(Format 13)
MR [ TSK ]
MR { RQ | R }
MR {TIM | TOUT| T }
MR { FLG | FLAG | F }
MR { SEM | S }
MR { MBX | M }
MR { CYH | CYC | C }
MR { ALH | ALM | A }
MR { RTSK | RT }
MR { STIM | ST }
MR { CTX | CT }, task-No
MR MPL
MR STK, { SYS | TSK | BASE | CLEAR }
Displays the task status
Displays the ready queue status
Displays the timeout queue status
Displays the event flag status
Displays the semaphore status
Displays the mailbox status
Displays the cycle handler status
Displays the alarm handler status
Displays active tasks
Displays the system clock count
Displays the context of the specified task
Displays the memory pool
Measure the system stack task sizes used.
Function
l
l
Displays the status of the real-time OS (MR79)
Invokes the specified system call
Note
Please use the startup file(crt0mr.a79/start.a79) whose contents matches with the version of MR79,
when you make downloaded program.
The MR window and MR command will not run properly if the startup file you uses don't match with
the version of MR79.
Displaying the status of the real-time OS
Displaying the task status
Use format 1. Enter the following to display the task status.
M R or MR TSK
The following items are displayed.
ID
name
Pri
Status*1
wup_count
timeout
flg_ptn
flg_mode*2
Task ID No.
Task name
Priority level
Task status
Value of wakeup count
Value of timeout count
Event flag wait bit pattern
Event flag wait end condition
247
P D 7 9 S I M U s e r ’s M a n u a l
*1:Task status
display
Status
RUN
RDY
SUS
DMT
WAI(SLP)
WAI(SLP) -SUS
WAI(DLY)
WAI(DLY) -SUS
WAI(FLG)
WAI(FLG)-SUS
WAI(SEM)
WAI(SEM)-SUS
WAI(MBX)
WAI(MBX)-SUS
WAI(SLP-TMO)
WAI(SLP-TMO)-SUS
WAI(FLG-TMO)
WAI(FLG-TMO)-SUS
WAI(SEM-TMO)
WAI(SEM-TMO)-SUS
WAI(MBX-TMO)
WAI(MBX-TMO)-SUS
Run status
Ready status
Suspend status
Dormant status
Sleep state
Sleep state (WAIT−SUSPEND)
Time wait state due to dly_tsk
Time wait state due to dly_tsk (WAIT−SUSPEND)
Event flag wait status
Event flag wait status (WAIT−SUSPEND)
Semaphore wait status
Semaphore wait status (WAIT−SUSPEND)
Message wait status
Message wait status (WAIT−SUSPEND)
Sleep state with time-out
Sleep state with time-out (WAIT−SUSPEND)
Event flag wait state with time-out1
Event flag wait state with time-out (double wait)1
Semaphore wait state with time-out1
Semaphore wait state with time-out (double wait)1
Message wait state with time-out1
Message wait state with time-out (double wait)1
*2:Event flag wait end condition
flg_mode
Status
TWF_ANDW
Waiting for all bits specified in wait bit pattern to be
set (AND wait)
When an AND wait has occurred and the task is in the
wait status, the event flag is cleared to 0.
Waiting for any bit specified in wait bit pattern to be
set (OR wait)
When an OR wait has occurred and the task is in the
wait status, the event flag is cleared to 0.
TWF_ANDW + TWF_CLR
TWF_ORW
TWF_ORW + TWF_CLR
Displaying the status of the ready queue
Use format 2. Enter the following to display the status of the ready queue.
MR RQ
The following items are displayed.
Pri
RdyQ
1
Priority level
The ID Nos. of tasks in the ready queue
These states are supported by MR79 V.2.00 or later. These states are not displayed for the target programs using
earlier versions of MR79 than that.
248
Table of Script Commands
Displaying the status of the timeout queue
Use format 3. Enter the following to display the status of the timeout queue.
MR TIM
The following items are displayed.
TimerQ
The ID Nos. of tasks in the timeout queue
Value
The timeout value of each task
If the system clock and system time are not used, the following message is also displayed.
System Clock and System Time is not used.
Displaying the status of the event flag
Use format 4. Enter the following to display the status of the event flag.
MR FLG
The following items are displayed.
ID
flg_ptn
flagQ
Event flag ID No.
Bit pattern of event flag
The ID Nos. of tasks in the event flag queue
Displaying the semaphore status
Use format 5. Enter the following to display the status of the semaphore.
MR SEM
The following items are displayed.
ID
Count
semQ
Semaphore ID No.
Value of semaphore counter
The ID Nos. of tasks in the semaphore queue
Displaying the mailbox status
Use format 6. Enter the following to display the status of the mailbox.
MR MBX
The following items are displayed.
ID
Msg_cnt
MAXmsg
Wait
Queue(Message)
Mailbox ID No.
The number of messages in each mailbox
The maximum number of messages that can be stored in each mailbox
The messages stored in the mailboxes or the ID Nos. of the waiting for
message tasks. If there are messages in the mailboxes, Msg is displayed
with the number of stored messages. If there are no messages in the
mailboxes and there are tasks waiting for messages, Task is displayed
with the ID Nos. of the tasks waiting for messages.
249
P D 7 9 S I M U s e r ’s M a n u a l
Displaying the cycle handler status
Use format 7. Enter the following to display the status of the cycle handler.
MR CYH
The following items are displayed.
ID
interval
count
Status
Cyclic handler ID No.
Interrupt interval
Interrupt count
Cycle handler status, as TCY_ON (enabled) or TCY_OFF (disabled)
Displaying the alarm handler status
Use format 8. Enter the following to display the status of the alarm handler.
MR ALH
The following items are displayed.
Now System Clock Count System clock count
Remain Handler
Number of remaining alarm handlers
ID
Alarm handler ID No.
Entry
Starting address of alarm handler
(Symbol)
Name of alarm handler
Time
Starting time of alarm handler
If no alarm handler is used, the following message is displayed.
This System dose not use Alarm Handler.
Displaying active tasks
Use format 9. Enter the following to display active tasks.
MR RTSK
Displaying system clock count
Use format 10. Enter the following to display the system clock count.
MR STIM
If the system clock is not used, the following message is displayed.
System Time is not used.
Displaying task context
Use format 11. Enter the following to display the context of task 1.
MR CTX ,1
If task 1 is running (RUN), the following message is displayed:
TaskID=1 is Running status.
If task 1 is dormant (DMT), the following message is displayed:
Task ID=1 is Dormant status.
250
Table of Script Commands
To display the memory pool status
Use format 12. Enter the following the display the status of the memory pool:
MR MPL
The following items are displayed:
ID
Base
Size
Total
Free
ID No. of memory pool
Base address of memory pool
Block size of memory pool
Total block count of memory pool
Number of unused blocks and information on unused memory blocks (bit
information)
Because of the differences between fixed length and variable length, the contents of the ID area
differ as follows:
l
Fixed length: "[F]" is displayed with the memory pool ID No.
l
Variable length: "[V]" is displayed with the block ID NO. In this case, the block ID is
enclosed in parentheses("()").
In the case of variable-length memory pools, nothing is shown in the Total area ("—" is
displayed). No bit information is shown in the Free area either.
In this case of fixed-length memory pools, each bit of memory block information in the Free area
is formatted as follows:
'0'
'1'
'-'
memory block in use (busy)
Memory block not in use (ready)
No memory block
[Methods for Measuring and Displaying the System Stack/Task Stack
Sizes Used]
Use format 13.
To measure the sizes of the system/task stacks used...
(1) Prepare for measuring the stack usage.
follows:
MR STK, BASE
To do this preparation, input a command as
(2) Initialize the result of stack usage measurement.
command as follows:
MR STK, CLEAR
To do this initialization, input a
(3) Execute the target program.
Then when the program execution is stopped, PD79SIM measures the size of stacks used
immediately after the previous measurement result is initialized.
To reference the size of the system stack used...
(1) Measure the size of the system stack used.
(2) Display the result of system stack usage measurement.
command as follows:
MR STK, SYS
251
To do this display, input a
P D 7 9 S I M U s e r ’s M a n u a l
To reference the size of the stack used for each task...
(1) Measure the size of the stack used for each task.
(2) Display the result of task stack usage measurement using Format 2.
input a command as follows:
MR STK, TSK
To do this display,
To display the measured size of the stack used for a specific task only, input a command as
shown below. Note that the data in the third argument is handled as being represented in
decimal.
MR STK, TSK, task ID number
252
Writing Script Files
2 Writing Script Files
PD79SIM allows you to run script files in a Script Window. The script file contains the controls
necessary for automatically executing the script commands.
2.1 Structural Elements of a Script File
You can include the following in script files:
l
l
l
l
l
l
Script commands
Assign statements
Conditional statements (if, else, endi)
Program execution branches to the statement(s) to be executed according to the result of the
conditional expression.
Loop statements (while, endw)
A block of one or more statements is repeatedly executed according to the expression.
break statement
Exits from the innermost loop.
Comment statements
You can include comments in a script file. The comment statements are ignored when the
script commands are executed.
Specify only one statement on each line of the script file. You cannot specify more than one statement
on a line, or write statements that span two or more lines.
2.1.1 Script Commands
You can use the same script commands that you enter in the Script Window. You can also call script
files from within other script files (nesting up to 5 levels).
2.1.2 Assign Statements
Assign statements define and initialize macro variables and assign values. The following shows the
format to be used.
% macro-variable = expression
l
l
l
l
You can use alphanumerics and the underscore (_) in macro variable names. However, you
cannot use a numeric to start a macro variable name.
You can specify any expression of which the value is an integer between 016 and
FFFFFFFF16 to be assigned in a macro variable. If you specify a negative number, it is
processed as twos complement.
You can use macro variables within the expression.
Always precede macro variables with the "%" sign.
253
P D 7 9 S I M U s e r ’s M a n u a l
2.1.3 Conditional Statements (if, endi, else)
In a conditional statement, different statements are executed according to whether the condition is
true or false. The following shows the format to be used.
if ( expression )
statement 1
else
statement 2
endi
l
l
l
If the expression is true (other than 0), statement 1 is executed. If false, (0), statement 2 is
executed.
You can omit the else statement. If omitted and the expression is false, execution jumps to
the line after the endi statement.
if statements can be nested (up to 32 levels).
2.1.4 Loop Statements (while, endw) and Break Statement
In loop statements, execution of a group of statements is repeated while the expression is true. The
following shows the format to be used.
while ( expression )
statement
endw
l
l
l
If the expression is true, the group of statements is repeated. If false, the loop is exited (and
the statement following the endw statement is executed).
You can nest while statements up to 32 levels.
Use the break statement to forcibly exit a while loop. If while statements are nested, break
exits from the innermost loop.
2.1.5 Comment statements
You can include comments in a script file. Use the following format.
; character string
l
l
Write the statement after a semicolon (;). You can include only spaces and tabs in front of
the semicolon.
Lines with comment statements are ignored when the script file is executed.
254
Writing Script Files
Notes:
l
l
l
l
l
l
l
You cannot include comments on the same lines as script commands.
You can nest script files up to five levels.
You can nest if statements and while statements up to 32 levels.
If statements must be paired with endi statements, and while statements with endw
statements in each script file.
Expressions included in script files are evaluated as unsigned types. Therefore, operation
cannot be guaranteed if you use negative values for comparison in if or while statements.
You can specify up to 4096 characters per line. An error occurs if a line exceeds this number
of characters.
When a script file containing illegal commands is automatically executed (when you select
[ Option ] −> [ Script ] −> [ Run ] from the Script Window menu after opening a script file,
or click the <Run> button in the Script Window), execution of the script file continues even
after the error is detected, except when the script line itself cannot be read.
If an error is detected and the script file continues to be executed, operation after detection
of the error cannot be guaranteed. Reliability cannot therefore be placed on the results of
execution after an error has been detected.
2.2 Writing Expressions
PD79SIM allows you to use expressions for specifying addresses, data, and number of passes, etc. The
following shows example commands using expressions.
>DB TABLE1
>DB TABLE1+20
2.2.1 Elements of Expressions
You can use the following elements in expressions:
l
Constants
l
Symbols and labels
l
Macro variables
l
Register variables
l
Memory variables
l
Line Nos.
l
Character constants
l
Operators
The following describes the respective elements.
2.2.2 Constants
Hexadecimal
Decimal
Octal
Binary*1
Prefix
Suffix
Examples
0x, 0X
@
None
%
h,H
None
o,O
b,B
0xAB24
@1234
1234o
%10010
AB24h
10010b
*1 You can only specify % when the predetermined radix is hexadecimal.
l
If you are inputting a radix that matches the predetermined radix, you can omit the symbol
that indicates the radix (excluding binary).
255
P D 7 9 S I M U s e r ’s M a n u a l
Use the RADIX command to set the predetermined value of a radix. However, in the cases
shown below, the radix is fixed regardless of what you specify in a RADIX command.
l
Type
Radix
Address
Line No.
No. of executions
No. of passes
Hex
Dec
2.2.3 Symbols and labels
You can include symbols and labels defined in your target program, or symbols and labels defined
using the Assemble command.
You can include alphanumerics, the underscore (_), period (.), and question mark (?) in
symbols and labels. However, do not start with a numeric.
Symbols and labels can consist of up to 255 characters.
Uppercase and lowercase letters are unique.
You cannot include the assembler as79 structured instructions, pseudo instructions, macro
instructions, operation code, or reserved words (.SECTION, .BYTE, switch, if, etc.).
You cannot use strings that start with two periods (..) for symbols or labels.
l
l
l
l
l
Note 1: Local label symbol and scope
PD79SIM supports both global label symbols, which can be referenced from the whole program
area, and local label symbols, which can only be referenced within the file in which they are
declared.
The effective range of local label symbols is known as the scope, which is measured in units of
object files (files with the ".r79" attribute). The scope is switched in PD79SIM in the following
circumstances:
l
l
When a command is entered
The object file that includes the address indicated by the program counter becomes the
current scope. When the SCOPE command is used to set the scope, the specified scope is
the active scope.
During command execution
The current scope automatically switches depending on the program address being
handled by the command.
Note 2: Priority levels of labels and symbols
The conversion of values to labels or symbols, and vice versa, is subject to the following levels of
priority:
l
Conversion of address values
1.
Local labels
2.
Global labels
3.
Local symbols
4.
Global symbols
5.
Local labels outside current scope
6.
Local symbols outside current scope
256
Writing Script Files
l
Conversion of data values
1.
Local symbols
2.
Global symbols
3.
Local labels
4.
Global labels
5.
Local symbols outside current scope
6.
Local labels outside current scope
l
Conversion of bit values
1.
Local bit symbols
2.
Global bit symbols
3.
Local bit symbols outside current scope
2.2.4 Macro Variables
Macro variables are defined by assign statements in the script file. See Section 2.1, "Structural
Elements of a Script File" in the Reference part for details.
Precede variables with '%' for use as macro variables.
l
You can specify alphanumerics and/or the underbar (_) in the variable name following the
percent sign (%). However, do not start the names with a numeric.
l
You cannot use the names of registers as variable names.
l
Uppercase and lowercase letters are differentiated in variable names.
l
You can define a maximum of 32 macro variables. Once defined, a macro variable remains
valid until you quit PD79SIM.
Macro variables are useful for specifying the number of iterations of the while statement.
2.2.5 Register variables
Register variables are used for using the values of registers in an expression. Precede the name of the
register with '%' to use it as a register variable. Use the following format.
% register-name
You can use the following registers.
P G , PC, PGPC, S , DT, DP0, DP1, DP2, DP3, A, B, E, X , Y , PS
Uppercase and lowercase letters are not unique in register names. You can specify either.
2.2.6 Memory variables
Use memory variables to use memory values in expressions. The format is as follows:
[ address ] .data-size
l
l
You can specify expressions in addresses (you can also specify memory variables).
The data size is specified as shown in the following table.
Byte length:
Word (2-byte) length:
Double word (4-byte) length:
B or b
W or w
D or d
257
P D 7 9 S I M U s e r ’s M a n u a l
l
The default data size is word, if not specified.
Example 1: Referencing the contents of memory at address 800016 in bytes
[ 8000h ] .B
Example 2: Referencing the contents of memory at address 800016 in words
[ 8000h ] .W
Example 3: Referencing the contents of memory at address 800016 in double words
[ 8000h ] .D
2.2.7 Line Nos.
These are source file line Nos. The format for line Nos. is as follows:
#line_no
#line_no.”source file name”
l
l
l
l
l
Specify line Nos. in decimal.
You can only specify line Nos. in which software breaks can be set.
You cannot specify lines in which no assembler instructions have been generated, including
comment lines and blank lines.
If you omit the name of the source file, the line Nos. apply to the source file displayed in the
Program Window.
Include the file attribute in the name of the source file.
Do not include any spaces between the line No. and name of the source file.
2.2.8 Character constants
The specified character or character string is converted into ASCII code and processed as a constant.
l
l
l
Enclose characters in single quote marks.
Enclose character strings in double quote marks.
The character string must consist of one or two characters (16 bits max.).
If more than two characters are specified, the last two characters of the string are processed.
For example, "ABCD" would be processed as "CD", or value 434416.
2.2.9 Operators
The table below lists the operators that you can use in expressions.
l
The priority of operators is indicated by the level, level 1 being the highest and level 8 the
lowest.
If two or more operators have the same level of priority, they are evaluated in order from
the left of the expression.
Operator
Function
Priority level
()
+, =, ~
Brackets
Monadic positive, monadic negative,
monadic logical NOT
Dyadic multiply, dyadic divide
Dyadic add, dyadic subtract
Right shift, left shift
Dyadic logical AND
Dyadic logical OR,
dyadic exclusive OR
Dyadic comparison
Level 1
Level 2
*, /
+, >>, <<
&
|, ^
<, <=, >, >=, ==, !=
258
Level 3
Level 4
Level 5
Level 6
Level 7
Level 8
C Expressions
3 C Expressions
3.1 Writing C Expressions
You can use C expressions consisting of the tokens shown below for registering C watchpoints and for
specifying the values to be assigned to C watchpoints.
Token
Example
Immediate values
10, 0x0a, 012
Mathematical operators
+, -, *, /
Pointers
*, **,...
Reference
&
Sign inversion
-
Member reference using comma
Struct.Member
Member reference using arrow
Struct->Member
Parentheses
(, )
Arrays
Array [ 2 ]
Casting to basic types
(int), (char*), (unsigned long *),...
Casting to typedef types
(DWORD), (ENUM),...
Variable names and function names
var, i, j, func,...
Character constants
’A’, ’b’,...
Character string literals
”abcdef”, ”I am a boy.”,...
, DArray [ 2 ]
[ 3 ]
,...
3.1.1 Immediate Values
You can use hexadecimals, decimals, and octals as immediate values. Values starting with 0x are
processed as hexadecimals, those with 0 as octals, and those without either prefix as decimals.
Note:
l
l
You cannot register only immediate values as C watchpoints.
Immediate values are valid only when used in a C expression that specifies a C watchpoint,
and when specifying a value to be assigned.
259
P D 7 9 S I M U s e r ’s M a n u a l
3.1.2 Mathematical Operators
You can use the addition (+), subtraction (-), multiplication (*), and division (/) mathematical
operators. The following shows the order of priority in which they are evaluated.
(*),(/) > (+),(-)
Note:
l
There is no support currently for mathematical operators for floating point numbers.
3.1.3 Pointers
Pointers are indicated by the asterisk (*). You can use pointer to pointers **, and pointer to
to pointers ***, etc.
pointer
Examples: "*variable_name", "**variable_name", etc.
Note:
l
Immediate values cannot be processed as pointers. That is, you cannot specify *0xE000, for
example.
3.1.4 Reference
References are indicated by the ampersand (&). You can only specify "&variable_name".
3.1.5 Sign Inversion
Sign inversion is indicated by the minus sign (-). You can only specify "-immediate_value" or "variable_name". No sign inversion is performed if you specify 2 (or any even number of) minus signs.
Note:
l
There is no support currently for sign inversion of floating point numbers.
3.1.6 Member Reference Using Comma
You can only use "variable_name.member_name" for checking the members of structures and unions
using the comma.
Example:
struct S{
int
char
};
member1;
member2;
struct S
struct S
STRUCT;
*STRUCT_P;
In this case, STRUCT.member1, (*STRUCT_P).member2 correctly checks the
members.
260
C Expressions
3.1.7 Member Reference Using Arrow
You can only use "variable_name->member_name" for checking the members of structures and
unions using the arrow.
Example:
struct S{
int
char
};
member1;
member2;
struct S
struct S
STRUCT;
*STRUCT_P;
In this case, (&STRUCT)->member1, STRUCT_P->member2 correctly checks the
members.
3.1.8 Parentheses
Use the ‘(‘ and ‘)‘ to specify priority of calculation within an expression.
3.1.9 Arrays
You can use the ‘ [ ‘ and ‘ ] ‘ to specify the elements of an array. You can code arrays as follows:
"variable_name [ (element_No or variable) ] ", "variable_name [ (element_No or
variable) ]
[ (element_No or variable) ] ", etc.
3.1.10 Casting to Basic Types
You can cast to C basic types char, short, int, and long, and cast to the pointer types to these basic
types. When casting to a pointer type, you can also use pointers to pointers and pointers to pointers to
pointers, etc.
Note that if signed or unsigned is not specified, the default values are as follows:
Basic type
Default
char
unsigned
short
signed
int
signed
long
signed
Note:
l
l
You cannot cast to floating point C basic types (float and double).
You cannot cast register variables.
3.1.11 Casting to typedef Types
You can use casting to typedef types (types other than the C basic types) and the pointer types to
them. When casting to a pointer type, you can also use pointers to pointers and pointers to pointers to
pointers, etc.
Note:
l
You cannot cast to struct or union types or the pointers to those types.
261
P D 7 9 S I M U s e r ’s M a n u a l
3.1.12 Variable Names and Function Names
As defined in C, variable and function names are character strings that start with a letter. They can
consist of up to 255 characters.
3.1.13 Character Constants
You can use characters enclosed in single quote marks (’) as character constants. For
example, ’A’, ’b’ , etc. These character constants are converted to ASCII code and used as 1-byte
immediate values.
Notes:
l
l
You cannot register character constants only as C watchpoints.
Character constants are valid only when used in a C expression that specifies a C
watchpoint, and when specifying a value to be assigned (character constants are processed
in the same manner as immediate values).
3.1.14 Character String Literals
You can use character strings enclosed in double quote marks (”) as character string literals.
Examples are ”abcde”, ”I am a boy.”, etc.
Note:
l
Character string literals can only be placed on the right side of an assignment operator in
an expression. They can only be used when the left side of the assignment operator is a char
array or a char pointer type.
In all other cases, a syntax error results.
3.2 Display Format of C Expressions
C expressions in the data display areas of the C Watch, File, File Local, and Global Windows are
displayed as their type name, C expression (variable name), and result of calculation (value), as
shown below.
Type
Result of calculation (value)
C expression (variable name)
The following describes the display formats of the respective types.
262
C Expressions
3.2.1 Enumeration Types
l
When the result (value) of calculation has been defined, its name is displayed.
(DATE) date = Sunday
(all Radices)
l
If the result (value) of calculation has not been defined, it is displayed as follows:
(DATE) date = 16
(when Radix is in initial state)
(DATE) date = 0x10
(when Radix is hex)
(DATE) date = 0000000000010000B
(when Radix is binary)
3.2.2 Basic Types
l
l
l
When the result of calculation is a basic type other than a char type or floating point type, it is
displayed as follows:
(unsigned int) i = 65280
(when Radix is in initial state)
(unsigned int) i = 0xFF00
(when Radix is hex)
(unsigned int) i = 1111111100000000B
(when Radix is binary)
When the result of calculation is a char type, it is displayed as follows:
(unsigned char) c = ’J’
(when Radix is in initial state)
(unsigned char) c = 0x4A
(when Radix is hex)
(unsigned char) c = 10100100B
(when Radix is binary)
When the result of calculation is a floating point, it is displayed as follows:
(double) d = 8.207880399131839E-304
(when Radix is in initial state)
(when Radix is hex)
(double) d = 0x10203045060708
(double) d = 0000000010.....1000B
(when Radix is binary)
(..... indicates abbreviation)
3.2.3 Pointer Types
l
When the result of calculation is a pointer type to other than a char* type, it is
displayed in hexadecimal as follows:
(unsigned int *) p = 0x1234
(all Radices)
l
When the result of calculation is a char* type, you can select the display format of the
string or a character in the menu [Option] -> [View] -> [Display String].
-string types
(unsigned char *) str = 0x1234 ”Japan”
(all Radices)
-character types
(unsigned char *) str = 0x1234 (74 ‘J’)
263
(all Radices)
P D 7 9 S I M U s e r ’s M a n u a l
l
When the result of calculation is a char* type, it is displayed as follows:
(unsigned char *) str = 0x1234 ”Japan”
(all Radices)
If the string contains a non-printing code prior to the code to show the end of the
string (0), it is displayed up to the non-printing character and the closing quote mark
is not displayed.
(unsigned char *) str = 0x1234 ”Jap (all Radices)
Also if the string contains more than 80 characters, the closing quote mark is not
displayed.
When the C expression is an pointer type, a '+' is displayed to the left of the type
name.
‘+’ indicating pointer type
You can double-click on lines indicated by a '+' to see the members of that structure or
union. The '+' changes to a '-' while the members are displayed. To return to the
original display, double click the line, now indicated by the '-'.
3.2.4 Array Types
l
When the result of calculation is an array type other than a char [ ]
starting address is displayed in hex as follows:
(signed int [ 10 ] ) z = 0x1234
(all Radices)
type, the
l
When the result of calculation is a char [ ]
type, it is displayed as follows:
(unsigned char [ 10 ] ) str = 0x1234 ”Japan” (all Radices)
If the string contains a non-printing code prior to the code to show the end of the
string (0), it is displayed up to the non-printing character and the closing quote mark
is not displayed.
(unsigned char [ 10 ] ) str = 0x1234 ”Jap (all Radices)
Also if the string contains more than 80 characters, the closing quote mark is not
displayed.
When the C expression is an array type as same as pointer type, a '+' is display to the
left of the type name. You can see the elements of the array by using this indicating.
(for the details, refer 3.2.4 Pointer types)
264
C Expressions
When the number of the array elements is more than 1000, the following dialog box
open. Specify the number of the elements in the dialog box.
The elements from the index specified in "Start" to the index specified in "End" are displayed.
If you specify the value more than the max index of the array, the value is regarded as max
index of the array.
When you click the "Cancel" button, the elements are not displayed.
3.2.5 Function Types
l
When the result of calculation is a function type, the starting address is displayed in hex as
follows:
(void()) main = 0xF000
(all Radices)
3.2.6 Reference Types
l
When the result of calculation is a reference type, the reference address is displayed in hex as
follows:
(signed int &) ref = 0xD038
(all Radices)
3.2.7 Bit Field Types
l
When the result of calculation is a bit field type, it is displayed as follows:
(unsigned int :13) s.f = 8191
(when Radix is in initial state)
(unsigned int :13) s.f = 0x1FFF
(when Radix is hex)
(unsigned int :13) s.f = 1111111111111B
(when Radix is binary)
3.2.8 When No C Symbol is Found
l
If the calculated expression contained a C symbol that could not be found, it is displayed as
follows:
() x = <not active>
(all Radices)
3.2.9 Syntax Errors
l
When the calculated expression contains a syntax error, it is displayed as follows:
() str*(p = <syntax error>
(all Radices)
(where str*(p is the syntax error)
265
P D 7 9 S I M U s e r ’s M a n u a l
3.2.10 Structure and Union Types
l
When the result of calculation is a structure or union type, the address is displayed in hex as
follows:
(Data) v = 0x1234
(all Radices)
If, as in structures and unions, the C expression consists of members, a '+' is displayed to the
left of the type name (tag name).
‘+’ indicating structure or union
You can double-click on lines indicated by a '+' to see the members of that structure or union.
The '+' changes to a '-' while the members are displayed. To return to the original display,
double click the line, now indicated by the '-'. This function allows you to check the members of
structures and unions.
3.2.11 Register Variables
l
When the result of calculation is a register variable, "register" is displayed to the left of the
type name as follows:
(register signed int) j = 100
266
Error Messages
4 Error Messages
The following tables list the PD79SIM error messages.
No.
Error Message
Notes and Action
150
Can't open more (name) window.
The maximum number of the specified
window is already open.
151
Can't Create (name) window.
Cannot open the specified window. There may
not be sufficient memory. Quit other
applications or increase memory.
152
Can't open (name) window, when the target Stop the target program, then open the
program is running.
window.
153
Value is out of range.
154
PD79SIM is already exist.
156
File not found ( filename ).
157
Path not found ( path ).
158
Not enough memory.
159
Can’t execute.
No.
Error Message
Notes and Action
200
Can't change view mode.
The display starting address does not match
the first line of the source file, or the specified
source file cannot be found.
201
Can't find source file (filename).
Specified source file was not found. Use the
PATH command, or the [ Environ ] −> [ Path ]
menu items to specify the directory
containing the source file.
202
Can't find search string (name).
The specified search string was not found
between the starting position and end.
203
Line number of Source File (filename) is over Because the source file has more lines than
(line).
can be displayed, the file cannot be displayed
in the Source Window. Switch to disassemble
display mode.
The specified address exceeds the MCU's
maximum address of FFFFFFh.
267
P D 7 9 S I M U s e r ’s M a n u a l
No.
Error Message
Notes and Action
300
Illegal endi ( filename line ).
There is no if statement paired with the endi
statement.
301
Illegal endw ( filename line ).
There is no while statement paired with the
endw statement.
303
Script File is already exist.
304
Can't find endi ( filename line ).
There is no endi statement paired with the if
statement.
305
Line length is overflow ( filename line ).
The number of characters exceeds the
maximum permissible for one line.
306
Nest level is overflow ( filename line ).
307
Can't find Script File ( filename ).
308
Can't read Script File ( filename ).
309
Description is illegal ( filename line ).
310
Can't find endw ( filename line ).
311
The nest level exceeds the limit ( num ).
313
Illegal break (filename line ).
No.
Error Message
400
Address value is out range for scroll area.
No.
Error Message
600
Can't add new watch point because it exceeds
limit of watch point number. Max number
is(num).
601
Address value is out of range.
602
Data value is out of range.
603
Bit value is out of range.
No.
Error Message
Notes and Action
650
There are no symbol information.
Load module file not loaded.
651
The expression is too long.
Cannot read rest of script file.
There is no endw statement paired with while
statement.
Notes and Action
Notes and Action
268
Error Messages
No.
Error Message
Notes and Action
900
SYMBOL file is illegal.
Error in format of load module file.
901
Loading is canceled.
902
Can't find SYMBOL file(filename).
No load module file exists.
903
Can't get enough memory.
Insufficient memory. Quit other applications
or increase memory.
904
Cannot open temporary file.
The temporary file for downloading using the
on-demand method could be opened.
No.
Error Message
Notes and Action
1001
Can't find symbol.
Specified symbol does not exist.
1002
Description of expression is illegal.
1004
Description is illegal.
Error in expression.
1005
Can't find scope.
The specified variable is not within the scope.
1006
Can't find symbol.
1007
Can't find function.
1008
Right hand side of the expression is illegal.
1009
The Type of structure ( union ) are not same.
1010
Can't assign.
1011
Can't find type.
1012
Not supported float ( double ) operation.
1013
The operation does not be allowed to pointers.
1014
The operation does not be allowed to the
pointer.
1015
Can't decrease by pointer.
1016
Divided by 0.
1017
The operator is not supported.
1018
Type information is broken.
1019
Left value must be the pointer.
1020
Left value must be a structure oran union.
1021
Can't find member.
1022
Left value must be reference of a structure or
an union.
1023
Left value is illegal.
1024
The operand must be a value.
1025
The operand is able to be opposite sign.
1026
Can't get address value.
1027
The array variable is illegal.
1028
The essential number of array is illegal.
1029
The operand must be an address value.
The specified function does not exist.
The specified type does not exist.
Error in symbol information in load module
file.
269
P D 7 9 S I M U s e r ’s M a n u a l
No.
Error Message
Notes and Action
1030
Type casting for register variable is notbe
supported.
1031
The type of type casting is illegal.
1032
Type casting for that type is notbe supported.
1033
This expression can not be exchanged for
some address value.
No.
Error Message
Notes and Action
1100
Address value is out of range.
Specified address exceeds MCU's maximum
address of FFFFFFh.
1101
Description of Assembly language is illegal.
1102
Address value for JUMP is out of range.
1103
Operand value is out of range.
1104
Description of expression is illegal.
1105
Addressing mode specified is not appropriate.
1107
Operand value is undefined.
1108
Bit-symbol is in expression.
1109
Invalid bit-symbol exist.
1110
Symbol value is not constant.
1111
Same items are multiple specified.
1112
Same kind items are multiple specified.
1113
Characters exist in expression.
1114
Format specified is not appropriate.
1115
Invalid symbol definition.
1116
Invalid reserved word exist in operand.
1118
Reserved word is missing.
1119
No space after mnemonic or directive.
1123
Operand value is not defined.
1124
Operand size is not appropriate.
1125
Operand type is not appropriate.
1131
Size or format specified is not appropriate.
1132
Size specified is missing.
1133
String value exist in expression.
1134
Symbol is missing.
1135
Symbol is multiple defined.
1136
Symbol is missing.
1137
Symbol is multiple defined.
1138
Invalid operand exist in instruction.
1139
Syntax error in expression.
270
Error Messages
No.
Error Message
1140
Invalid operand exist in instruction.
1141
Operand expression is not completed.
1142
Too many operand.
1143
Too many operand data.
1144
Undefined symbol exist.
1145
Value is out of range.
1146
Division by zero.
1148
'#' is missing.
1149
',' is missing.
1150
']' is missing.
1151
')' is missing.
1153
Invalid operand exist in instruction.
1154
Quote is missing.
1155
Right quote is missing.
1156
Can't get enough memory.
1162
Invalid chip mode.
1163
':' is missing.
1164
Absolute addressing is not avail.
1165
Direct addressing is not avail.
1166
Invalid addressing mode declaration
included.
1167
Syntax error in indexed addressing
expression.
1168
'(' is missing.
Notes and Action
271
P D 7 9 S I M U s e r ’s M a n u a l
No.
Error Message
Notes and Action
1200
Syntax error.
1201
Command name is wrong.
1202
Too many aliases.
1203
You can register the only command name for
alias.
1204
Can't use the command now.
1205
Can't up more.
1206
Can't down more.
1207
Can't set break point in this function.
1208
The start address larger than the end
address.
1209
This command is not supported now.
1211
Can't register that token for alias.
1212
Can't find file ( filename ).
1213
Data value is out of range.
No.
Error Message
Notes and Action
1400
Address value is out of range.
Specified address exceeds the MCU's
maximum address of FFFFFFh.
1401
Target program is already stopped.
1402
The number of break point is over the limit
( limit ).
1403
The break point isn't defined at that address.
1404
Data value is out of range.
1406
Can't read/write, because there are no
memory at that area.
Use the MAP command to allocate memory.
1407
Can't get enough memory.
Insufficient memory. Quit other applications
or increase memory.
1408
Register value is out of range.
1409
Can't execute that command, when the target
program is running.
1410
Start address is larger than end address.
1411
STOP execution.
1412
Can't find source lines which include that
address.
1413
That command has not yet supported.
1417
Can't search more on the stack.
1418
Specified times of number is over than 65535.
1421
Memory alignment error.
1422
Illegal register is specified.
Maximum: 256
You cannot use the specified command while
the target program is running.
272
There is no source line information at the
specified address.
Error Messages
No.
Error Message
Notes and Action
1500
There was sent undefined data from
simulator.
1501
Can't read/write, because there are no
memory at that area.
Use the MAP command to allocate memory.
1502
Number of points exceeds the limit( num ).
No more points can be set.
1503
Point already set.
1504
Breakpoint of other type already set.
1505
No hardware breakpoint set at specified
address.
1506
Can't get enough memory.
1507
Can't set more I/O script file ( Max 20 ).
Only a total of 20 I/O script file procedures,
virtual port inputs, and virtual interrupts can
be registered in I/O window.
1508
Can't set more virtual output ( Max 20 ).
The maximum number of virtual port outputs
that can be registered is 20.
1509
Specified vector Address out of range.
1510
Specified level of priority out of range.
1530
Stack trace mode is not enabled.
1531
SIM79 execution error occurred.
1533
Undefined instruction was executed.
No.
Error Message
1704
The connection with the target isn't created.
1705
Can't connect with the target.
1707
Time Out ERROR.
A time-out error occurred in communication
with the target system.
1712
Communication ERROR.
Connection to the target system was lost
during communication with the target
system.
1713
Communication ERROR.
A communications error occurred while
sending data to the target system.
1714
Communication ERROR.
A communications error occurred while
receiving data from the target system.
1717
Can't find Simulator Engine.
Notes and Action
273
P D 7 9 S I M U s e r ’s M a n u a l
No.
Error Message
Notes and Action
2400
Address value is out of range.
2401
Data value is out of range.
2402
Start Address is larger than end address.
You specified an ending address that is less
than the starting address.
2403
Value is under ( num ).
Specify a value of num or more.
2404
Data value is out of range.
No.
Error Message
5700
The data value is too large.
5701
The address area is illegal.
5702
Address value is out range for scroll area.
The address specified as the scroll range is
greater than the MCU's maximum address of
FFFFFFh
No.
Error Message
Notes and Action
5800
Sampling period value is out of range.
5801
Address value is out of range.
5802
Can't change RAM monitor area, when the
target program is running.
Stop target program, then change the RAM
monitor area.
No.
Error Message
Notes and Action
5900
Can't open Script File ( filename ).
5901
Script File ( filename ) is already opened.
5902
Script File is not open.
5903
Can't open Log File ( filename ).
5904
Can't open more Log File.
5905
Can't open Log File.
5906
File ( filename ) is already log on.
5907
Can't open View File ( filename ) for new/add.
Notes and Action
274
Error Messages
No.
Error Message
Notes and Action
6000
Cannot find source file ( filename ).
6001
The number of lines of source file ( filename )
is over the limit ( line ).
6002
The Address value is out of range.
6003
Cannot open file ( filename ).
6004
Illegal file format.
6006
Cannot read the file saved by emulator
debugger.
No.
Error Message
6401
Already set hard ware break.
No.
Error Message
10200
Line number is illegal.
10201
Can't find right bracket ')'.
10202
The Number of Macro constant is over the
limit ( limit ).
10203
Immediate value is out of range.
10204
Prefix which gives radix of the constant is
illegal.
10205
Description of indirect reference is illegal.
10206
Can't find end of strings ( str ).
10207
Description of expression is illegal.
10208
Macro constant ( macro ) isn't defined.
10209
Symbol ( symbol ) isn't defined.
10210
Immediate value is illegal.
10211
Divide by 0.
10213
The value is over the maximum value of
which can be treated by MCU.
10214
Register name is using for macro variable
name.
Notes and Action
Notes and Action
275
P D 7 9 S I M U s e r ’s M a n u a l
No.
Error Message
Notes and Action
10400
Address value is out of range.
Specified address exceeds MCU's maximum
address of FFFFFFh.
10401
Bit number is out of range.
10402
File ( filename ) is broken.
10403
Can't find File ( filename ).
10404
Can't find sub routin information.
10405
Illegal character in the strings.
10407
Can't find that line number.
10408
Multiple definition of symbol/label.
10409
There are no code at that line.
10410
Can't get enough memory.
10411
Can't find scopes.
10412
Can't find section information.
10413
Can't find source lines which correspond to
that address.
No.
Error Message
10414
Can't find symbol ( symbol ).
10415
Can't find the scopes which include that
address.
10416
Loading is canceld.
10419
The register name is wrong.
10420
Can't find Source File ( filename ).
10421
Unable read Load Module File ( filename ).
10422
The PATH name is incorrect.
No.
Error Message
10800
Value is out of range.
10801
Can't find the register information file.
10802
There's incorrect line in register information
file.
10803
Not enough memory.
Specify the option to output debugging
information, then recompile the target
program.
No machine language has been generated at
the address corresponding to the specified
line No.
Specify the option to output debugging
information, then recompile the target
program.
Notes and Action
Notes and Action
276
Error Messages
No.
Error Message
Notes and Action
11000
The save file name ( filename ) is wrong.
Specified file cannot exist.
11001
Can't find symbol ( symbol ) of MR79.
Real-time OS ( MR79 ) symbol not found.
11002
Initialization routine ofMR79 is not executed. MR commands cannot be executed when the
real-time OS ( MR79 ) initialization routine
has not been executed.
11003
Can't find the task of the specified task
number.
11004
Priority out of range.
The specified priority is out of range.
11005
Task ID out of range.
The specified task ID is out of range.
11006
Flag ID out of range.
The specified flag ID is out of range.
11007
Semaphore ID out of range.
The specified semaphore ID is out of range.
11008
Mailbox out of range.
The specified mailbox ID is out of range.
11009
Memory pool ID out of range.
The specified memory pool ID is out of range.
11010
Cycle handler ID out of range.
The specified cyclic handler ID is out of range.
11011
Address out of range.
The specified address is out of range.
11012
Cannot invoke system call.
11013
System call not invoked.
11014
System call not completed.
No.
Error Message
Notes and Action
15000
Task with specified task No. not found.
The specified task does not exist.
15001
Context of specified task No. not found.
The specified task context does not exist.
15002
Corrupted MR data.
Part of the MR data is corrupted. As a result,
correct data cannot be displayed in the MR
Window.
No.
Error Message
Notes and Action
20000
Illegal file format.
No.
Error Message
Notes and Action
21000
Can't open BUTTON file.
GUI input file cannot be opened.
21001
BUTTON file is illegal.
GUI input file is corrupted.
277
P D 7 9 S I M U s e r ’s M a n u a l
No.
Error Message
Notes and Action
22000
Can't open temporary file.
22001
Can't delete temporary file.
22002
Can't open I/O data file ( filename ).
22003
The I/O data not set.
22004
The Output file of the same already set.
22005
Data not found.
22006
The start cycle larger than the end cycle.
22007
The Output port already set.
22008
There is no data in the Input file.
22009
Illegal file format.
No.
Error Message
25000
Can't find '{'. ( line )
25001
Can't find '}'. ( line )
25002
Can't find '('. ( line )
25003
Symbol isn't defined. ( line , token )
25004
Can't find ')'. ( line )
25005
Description of expression is illegal.( line ,
token )
25006
Nest level of the if statement is overflow.
( line )
25007
Nest level of the while statement is overflow.
( line )
25008
Too many the break statement. ( line )
25009
There is no if statement corresponding to the
else statement. ( line )
25010
Unknown token. ( line , token )
25011
Can't open the ( filename ) file.
25012
The ( filename ) file is not a file made in the
I/O window.
25013
The description of the memory variable is
illegal. ( line )
Notes and Action
278
Index
279
280
Index
Index
endw .......................................................... 254
environmental setup file .............................. 13
Error Messages .......................................... 267
Executed address synchronized interrupt .... 67
Exit ............................................................ 140
#
#isfetch expression ..................................... 203
#isint expression ........................................ 203
#isread expression...................................... 203
#iswrite expression..................................... 204
F
A
File Local Window.............................5, 58, 131
ASM Watch Window ........................ 5, 50, 114
Assign Statement ....................................... 253
AutoDownLoad............................................. 95
G
Global label symbol .................................... 256
Global Window..................................5, 60, 131
"Go" button ................................................ 105
GUI Input File ............................................. 16
GUI Input Window ...............................80, 181
GUI Input .................................................... 10
GUI Output File........................................... 16
GUI Output Window .............................82, 187
GUI Output.................................................. 10
B
Break Statement ........................................ 254
C
C expression ..................................53, 259, 262
C language expression................................ 132
C variable........................................... 130, 132
C Watch Window.............................. 5, 53, 131
C watchpoint data file .................................. 13
C watchpoint ................................................ 53
CB79SIM.................................................... 208
Character constant..................................... 258
"Come" button ............................................ 108
Come Execution ......................................... 108
Comment statement................................... 254
Comment.................................................... 200
Conditional Statement ............................... 254
Constant..................................................... 255
coverage measurement information file . 13, 14
Coverage measurement information .......... 206
Coverage Source Window ............................. 86
Coverage Window......................................... 86
Customize Dialog Box ................................ 146
Customize Function ................................... 208
CYcle command............................................ 11
Cycle synchronized input ............................. 63
Cycle synchronized interrupt ....................... 66
H
H/W Break Point Setting dialog box .....90, 125
Hardware break point.................................. 90
Hardware Breaks....................................... 125
help file ........................................................ 12
I
I/O Script File .............................................. 15
I/O Script ..............................................10, 195
I/O Window .................................................. 63
IEEE-695 absolute format file................ 12, 93
if ........................................................200, 254
Init Dialog Box......................................20, 139
Init dialog .................................................... 20
Intel HEX format file ........................12, 14, 96
int statement ............................................. 198
Interrupt synchronized input....................... 65
L
Label ...................................................... 5, 256
Left-side expressions.................................. 204
Line Assemble............................................ 142
line No........................................................ 258
Local label symbol...................................... 256
Local Window....................................5, 56, 131
Log file ................................................... 14, 61
Logging function ........................................ 135
Loop Statement.......................................... 254
D
Disassemble file ........................................... 14
Display colors ............................................. 104
Downloading ................................................ 93
Dump Window...................................... 45, 117
E
else ............................................................. 254
endi ............................................................ 254
281
PD79SIM User’s Manual
M
Save Disasm ................................................ 96
Scope.......................................................... 256
Scope Setting Dialog Box ........................... 117
Script Command ........................................ 253
Script file .................................. 12, 20, 61, 138
Script Window.......................................61, 134
Search path................................................ 101
Search ........................................................ 144
set statement ............................................. 198
Shortcut Menus............................................ 36
Software break point.................................... 89
Software break............................................. 89
Source Window ................... 20, 39, 93, 97, 144
Stack Utilization Monitor ............................ 11
StackMonitor command ............................... 11
"Step" button.............................................. 107
"Stop" button.............................................. 105
Symbol ................................................... 5, 256
Macro variable ............................202, 204, 257
Main command............................................. 27
MAP command ...............................................8
MCU file....................................................... 20
Memory map .............................................. 119
Memory variables............................... 202, 204
Memory Window .................................. 43, 117
MR Window.................................................. 84
MR79.......................................................... 215
Motorola S format file .................12, 14, 94, 96
O
On Demand .................................................. 21
On Memory .................................................. 21
Operator............................................. 203, 258
"Over" button ............................................. 107
Over-step execution.................................... 107
T
P
Table of Script Commands ......................... 237
temporary file .............................................. 16
The Virtual Port Input function................. 151
Time management ......................................... 6
pass statement ........................................... 199
PD79SIM version ....................................... 146
PD79SIM Window........................................ 27
Procedure ................................................... 197
Program counter ..................................... 33,38
Program Window................. 20, 33, 93, 97, 144
U
Uploading .................................................... 96
R
V
RAM monitor area..................... 4, 47, 113, 114
RAM Monitor Window.......................... 47, 113
Read access synchronized input ................... 64
realtime OS ................................................ 217
Register information file .............................. 12
Register variable ........................................ 257
Register Window .................................. 41, 110
Reload .......................................................... 94
Reset ............................................................ 95
"Reset" button ............................................ 109
"Return" button.......................................... 108
Return execution ........................................ 108
Right-side expressions................................ 201
Version Information dialog box .................... 22
View buffer......................................14, 61, 136
View file ................................................. 14, 61
Virtual Interrupt function.......................... 161
Virtual Interrupt...................................... 9, 66
Virtual Port Input.................................... 9, 63
Virtual Port Output File .............................. 16
Virtual Port Output function ..................... 159
Virtual Port Output ..........................9, 60, 159
W
wait statement ........................................... 198
waitc statement ......................................... 198
watch function ........................................... 114
watchpoint ............................................50, 114
while ...................................................200, 254
Writing Script Files ................................... 253
S
S/W Break Point Setting dialog box ..... 89, 120
Sampling period ......................................... 113
282
M3T-PD79SIM V.3.20 User’s Manual
Rev. 1.00
May 1, 2003
REJ10J0045-0100Z
COPYRIGHT ©2003 RENESAS TECHNOLOGY CORPORATION
AND RENESAS SOLUTIONS CORPORATION ALL RIGHTS RESERVED
M3T-PD79SIM V.3.20
User’s Manual
1753, Shimonumabe, Nakahara-ku, Kawasaki-shi, Kanagawa 211-8668 Japan
REJ10J0045-0100Z