1
NORGES TEKNISK-NATURVITENSKAPELIGE UNIVERSITET
FAKULTET FOR INFORMASJONSTEKNOLOGI , MATEMATIKK OG ELEKTRONIKK
HOVEDOPPGAVE
Kandidatens navn:
Ulf Erik Holmen og Petter Strand
Fag:
Systemutvikling
Oppgavens tittel (norsk):
Annotert kallgraf
Oppgavens tittel (engelsk):
Annotated Call Graph
Oppgavens tekst:
En kallgraf er en rettet graf som viser relasjonene mellom
prosedyrekall i et program. Nodene i grafen er prosedyrer, og
kantene viser relasjonene mellom en kallende prosedyre og kalt
prosedyre. En annotert kallgraf har i tillegg notasjon som viser
betingelsene for at de forskjellige prosedyrene skal kalles.
Oppgaven består i å designe, implementere og teste en applikasjon
som genererer den annoterte kallgrafen til programsystemer skrevet i
Java. Programsystemene skal kunne bestå av mer enn en fil.
Applikasjonen
den annoterte
tillegg skal
den koden som
skal designes slik at den kan utvides til å generere
kallgrafen til systemer skrevet i språkene C++ og C. I
applikasjonen kunne generere forslag til testdata for
analyseres.
I besvarelsen skal det også redegjøres for hvordan
kallgrafer kan anvendes til test av datasystemer.
Oppgaven gitt:
20.01.2002
Besvarelsen leveres innen:
14.06.2002
Besvarelsen levert:
21.05.2002
Utført ved:
Institutt
for
informasjonsvitenskap, IME
Veileder:
Professor Tor Stålhane
Trondheim,
Faglærer
datateknikk
annoterte
og
NORWEGIAN UNIVERSITY OF SCIENCE AND
TECHNOLOGY
A N N O TAT E D
CALL GRAPH
DEVELOPING A SYSTEM FOR AUTOMATED
ANNOTATED CALL GRAPH CONSTRUCTION
FOR JAVA PROGRAMS
SPRING 2002
Preface
i
PREFACE
This report represents our master thesis in Software Engineering at the Norwegian
University of Science and Technology, Department of Computer and Information Science.
Our work started in January 2002, after selecting the assignment in December 2001. We
chose one of professor Stålhane’s assignments. The task has been to design and implement
an application that automatically generates annotated call graphs.
The result of our work is the system “Annotert Kallgraf”, version 1.0, including its
documentation. In addition to this report, the master thesis consists of the system, its
source files and detailed design documentation on a CD-ROM. A user manual in
Norwegian is also available. The manual is a more thorough introduction to the system,
than the one found in this report. Since Annotert Kallgraf’s user interface is in Norwegian,
we decided to write the user manual in Norwegian too.
We would like to thank Professor Stålhane for his valuable guidance and feedback during
the work.
Trondheim, May 21st 2002
Ulf Erik Holmen
Petter Strand
Table of Contents
ii
TABLE OF CONTENTS
1
ABSTRACT ............................................................................................................V
2
CONCLUSIONS................................................................................................... VI
3
INTRODUCTION .................................................................................................. 1
3.1
3.2
3.3
4
CALL GRAPHS ..................................................................................................... 3
4.1
4.2
4.3
5
INTRODUCTION .................................................................................................. 3
STATIC VS. DYNAMIC CALL GRAPHS................................................................. 3
ANNOTATED CALL GRAPHS............................................................................... 4
REQUIREMENTS SPECIFICATION ................................................................ 6
5.1
5.2
5.3
6
DEFINITION OF THE PROBLEM............................................................................ 1
THE STRUCTURE OF THE REPORT ....................................................................... 1
TEXT CONVENTIONS .......................................................................................... 2
FUNCTIONAL REQUIREMENTS ............................................................................ 6
NON-FUNCTIONAL REQUIREMENTS ................................................................... 6
DOCUMENTATION REQUIREMENTS .................................................................... 6
SYSTEM DESCRIPTION..................................................................................... 7
6.1
INTRODUCTION .................................................................................................. 7
6.1.1
Parsing and Lexing................................................................................... 7
6.1.2
Why Java? ................................................................................................ 8
6.2
HIGH LEVEL SYSTEM DESCRIPTION................................................................... 8
6.3
DESIGN .............................................................................................................. 8
6.3.1
code.Graph ............................................................................................. 11
6.3.2
code.Graph.CallGraph........................................................................... 11
6.3.3
code.Graph.ClassHierarchyGraph ........................................................ 11
6.3.4
code.PackageInterfaces.......................................................................... 11
6.3.5
code.Parsing ........................................................................................... 12
6.3.6
code.Util ................................................................................................. 12
6.3.7
code.Visualization.Algorithms................................................................ 12
6.3.8
code.Visualization.GUI .......................................................................... 12
6.4
SPECIAL DESIGN CONSIDERATIONS ................................................................. 12
6.5
TESTING AND CONFORMANCE TO SPECIFICATION............................................ 13
6.5.1
Testing of Annotert Kallgraf 1.0............................................................. 13
6.5.2
Conformance to Specification ................................................................ 13
7
ALGORITHMS .................................................................................................... 15
7.1
THE CALL GRAPH CONSTRUCTION ALGORITHM.............................................. 15
7.2
THE SUGIYAMA LAYOUT ALGORITHM ............................................................ 16
7.3
OWN ALGORITHMS .......................................................................................... 19
7.3.1
Call Graph Construction ........................................................................ 19
7.3.2
Class Hierarchy Graph Algorithm ......................................................... 22
7.3.3
Variables................................................................................................. 26
7.3.4
Placing Text in the Vertices.................................................................... 28
Table of Contents
7.3.5
8
iii
The Test Data Generation Algorithm ..................................................... 29
ANNOTERT KALLGRAF 1.0............................................................................ 31
8.1
SYMBOLS USED BY ANNOTERT KALLGRAF ..................................................... 31
8.1.1
The Class Hierarchy Graph ................................................................... 31
8.1.2
The Call Graph....................................................................................... 31
8.2
SYSTEM FUNCTIONALITY ................................................................................ 32
8.2.1
New Analysis .......................................................................................... 32
8.2.2
Save Open Analysis ................................................................................ 32
8.2.3
Open Saved Analysis .............................................................................. 32
8.2.4
Close Analysis ........................................................................................ 33
8.2.5
Print Preview.......................................................................................... 33
8.2.6
Print ........................................................................................................ 33
8.2.7
Zooming .................................................................................................. 33
8.2.8
Generating Test Data ............................................................................. 33
8.2.9
Copy Graph to System Clipboard........................................................... 34
8.2.10
Save a Graph as an Image...................................................................... 34
8.2.11
Show Standard Java Methods and Classes ............................................ 34
8.2.12
Arrange Windows ................................................................................... 34
8.2.13
Help Functionality.................................................................................. 34
8.3
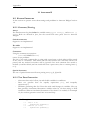
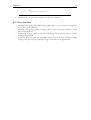
EXAMPLES ....................................................................................................... 34
8.3.1
Call Graph Example 1............................................................................ 34
8.3.2
Call Graph Example 2............................................................................ 35
9
TESTING .............................................................................................................. 37
9.1
BLACK BOX TESTING ....................................................................................... 37
9.2
WHITE BOX TESTING ....................................................................................... 37
9.2.1
Path testing............................................................................................. 37
9.3
INTERFACE TESTING ........................................................................................ 38
9.4
UNIT TESTING .................................................................................................. 39
9.5
USE OF ANNOTERT KALLGRAF IN TESTING ..................................................... 39
10
THE SYSTEM’S USE IN RELIABILITY AND SAFETY .......................... 40
10.1
10.2
11
RELIABILITY .................................................................................................... 40
SAFETY ............................................................................................................ 42
FURTHER WORK .......................................................................................... 45
11.1 EXTENSION TO C/C++ ..................................................................................... 45
11.1.1
The C Programming Language .............................................................. 45
11.1.2
The C++ Programming Language......................................................... 45
11.1.3
Changes Needed for Extension to C/C++.............................................. 45
11.2 EXTENSION TO TEST PATH COVERAGE ............................................................ 46
11.3 OTHER EXTENSIONS ........................................................................................ 46
11.3.1
Expanding and Collapsing Vertices ....................................................... 46
11.3.2
Rapid Type Analysis ............................................................................... 46
11.3.3
Reliability ............................................................................................... 47
12
REFERENCES ................................................................................................. 48
13
BIBLIOGRAPHY............................................................................................. 49
14
GLOSSARY ...................................................................................................... 50
Table of Contents
15
iv
APPENDIX A.................................................................................................... 51
15.1 SYSTEM TEST ACCORDING TO TEST PLAN ....................................................... 51
15.1.1
The Test Plan .......................................................................................... 51
15.1.2
System Test ............................................................................................. 51
16
APPENDIX B.................................................................................................... 58
16.1 KNOWN PROBLEMS ......................................................................................... 58
16.1.1
Grammer/Parsing................................................................................... 58
16.1.2
Test Data Generation ............................................................................. 58
16.1.3
User Interface ......................................................................................... 59
17
APPENDIX C.................................................................................................... 60
17.1
IMPLEMENTATION OF THE REQUIREMENTS SPECIFICATION ............................. 60
Abstract
v
1
ABSTRACT
The main goal of this master thesis was to design, implement and test an application that
automatically generates the annotated call graph of a software system. An annotated call
graph shows the relations between methods in a software system, and the conditions that
have to be true for a method invocation to take place. The application should be able to
analyse programs written in Java.
The resulting application, Annotert Kallgraf version 1.0, allows the user to analyse several
Java files. In addition to the annotated call graph, the user is presented with the class
hierarchy graph and a list of all classes with their member variables and methods.
Everything is presented in a Windows-based user interface. The application allows the user
to print, copy, save and restore the graphs.
The annotated call graph tool might be used in testing, reliability and safety analysis. We
have shown that our tool might simplify the calculation of some well-known reliability
metrics, like the component complexity coefficient of Henry and Kafura, and the system
reliability coefficient introduced by Cheung. It might also simplify the safety analysis of a
system, because the annotated call graph combines well with fault trees. With regards to
testing, Annotert Kalllgraf can generate test data for simple examples. This part of the
application has, however, potential for improvement.
Conclusions
vi
2
CONCLUSIONS
We have designed and implemented an application that is capable of generating the
annotated call graph for programs written in Java. It also displays the class hierarchy graph
of the analysed system. System functionality includes presentation, zooming and printing of
the graphs. The analysed program may consist of more than one file.
The system can only generate the call graph of systems written in Java. However, it has
been designed to simplify the extension to accept C and C++. For example, a graph
visualization algorithm has been used to draw the class hierarchy graph, instead of a tree
visualization algorithm. In Java, the class hierarchy will always be in the form of a tree, but
in C++, which allows multiple inheritance, it may be a graph. Also, the graphs are built
using a parser generated from a grammar specification file. The system can be adapted to
support another language by changing the specification file. Thus, by replacing the Java
grammar with its C++ equivalent, it is possible to generate a C++ parser, which can be
integrated with the rest of the system.
Annotert Kallgraf can be beneficial in several aspects. First of all, it saves time by
generating the call graph automatically. Drawing the call graph by hand is time consuming
for all but simple examples. However, the user will not get the same thorough
understanding of the code if the call graph is generated automatically. Secondly, the
visualization of the code may give the viewer new perspectives. Especially, the ability to
separate standard Java methods from other methods may prove useful. Thirdly, our tool is
connected to safety, testing and reliability. Annotated call graphs facilitate the calculation of
some well-known reliability measures, and makes it easier to discover and remove safety
risks. Finally, the annotated call graph makes it possible to generate test data for an
application. Our system can generate test data for the analysed program. The test data
generation is not capable of handling complex conditions, but works for the most basic
examples. It is not designed to handle conditions that include method calls and objects.
There are many possible extensions and improvements in Annotert Kallgraf. Already
mentioned is the extension to support analysis of C and C++ programs. The test
generation part of the application has improvement potential. When implemented, it is also
possible to extend the testing to calculate test path coverage. Large graphs are slowly drawn
with the current algorithms, and provide another possible improvement. This can be
achieved by introducing collapsing and expanding vertices in the graph.
Introduction
1
3
INTRODUCTION
3.1 DEFINITION OF THE PROBLEM
This assignment was originally presented by professor Stålhane as:
Annotated call graphs are important in safety analysis and testing. A tool for analysing C and
C++ code and generating the annotated call graph is to be implemented. The graph uses fault tree
notation to visualize the system. The tool will have a web-based interface that allows the user to
navigate between the levels in the analysed system.
The work can be extended to include a theoretic description of the use of call graphs in safety analysis
and testing.
During the preparations for this thesis, the assignment was rephrased. Together with
professor Stålhane, we decided on the following assignment:
A call graph is a directed graph that shows the relations between procedures in a program. The
vertices in the graph represent procedures, and the edges shows the relations between the caller and the
callee. An annotated call graph also shows the conditions required for an invocation to occur.
As part of the assignment, we will design, implement and test an application that generates the
annotated call graph of systems written in Java. The analysed systems may consist of more than one
file. The application will be designed to facilitate the extension to analyse files written in C and
C++. In addition, the application will be able to generate test data for the analysed code.
The report will include a chapter on the use of annotated call graphs in testing.
3.2 THE STRUCTURE OF THE REPORT
In chapter four, we define and give an introduction to call graphs. In the fifth chapter, the
requirements specification is presented. It consists of the functional, non-functional and
documentation requirements.
Chapter six concerns the implemented system and its design. The high level description is
found here, along with the design of the system. One section explains special design
considerations we have made to simplify extension to C and C++. The chapter is
concluded with test results of Annotert Kallgraf, and how it conforms to the specification.
In chapter seven the algorithms used in the implementation of the system are presented.
First, algorithms developed by other people are found, followed by the most important of
the ones we have developed ourselves.
Chapter eight contains information about the use of the system. The first section in this
chapter explains the symbols used in the graphs. Section 8.2 gives a brief description of the
most important functionality of the system. The last section presents some simple
examples, including the Java code and the resulting call graph.
The ninth chapter concerns testing. After a general introduction, the use of Annotert
Kallgraf in testing is detailed.
Introduction
2
Following a chapter on safety and reliability, the report is concluded with a chapter about
possible further work. Some important words are explained in the glossary in chapter 14.
3.3 TEXT CONVENTIONS
In this report we have used different fonts and layout to separate examples and important
passages from the rest of the text. Code is always written in the Courier New font.
Pseudocode or algorithms is slightly indented, while the example code fragments are
separated both by indentation, horizontal bars and a numbered example heading. All code
lines are numbered, and comments are written in gray italics.
Call Graphs
3
4
CALL GRAPHS
4.1 INTRODUCTION
A graph is defined in [14] as:
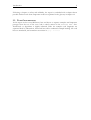
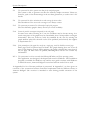
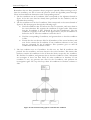
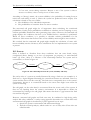
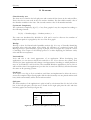
A graph G(V(G), E(G)) consists of a set of vertices, denoted by V(G), and a set of edges, denoted
by E(G), such that each edge connects two distinct vertices in V(G).
Vertex
Edge
Vertex
Vertex
Figure 1: A graph
A graph is either directed or undirected. In a directed graph, all the edges have a specific
direction, usually depicted by an arrow. In an undirected graph, there is no specification of
direction. The graph in figure 1 is undirected.
A tree is defined in [15] as:
[…] a collection of nodes connected by edges so that there is one and only one path between any two
nodes. If there is more than one path, the collection of nodes is a graph, not a tree.
In tree-terminology a vertex is known as a node.
A call graph is defined as [2]:
[…] a directed graph representing the calling relationships between the methods of a program. The
nodes of a call graph represent the methods in a program and the directed edges represent the callercallee relationship.
An annotated call graph will in addition have a notation that shows the possible conditions
for the method calls.
A class hierarchy graph is a graph showing the inheritance relationships between the classes
of a program. The vertices in the graph correspond to classes. An edge <a,b> shows that a
is the superclass of b.
In the call graph, a vertex represents a method invocation (see figure 1). An edge
symbolizes a call from one method to another.
4.2 STATIC VS. DYNAMIC CALL GRAPHS
Call graphs are either static or dynamic. A static call graph is defined in [1] as “[…] the
relation describing those invocations that could be made from one entity to another in any
possible execution of the program”. A dynamic call graph is defined as “[…] the invocation
Call Graphs
4
relation that represents a specific set of runtime executions of a program.” These
definitions also reflect the weaknesses of the two types of call graphs. A dynamic call graph
will only show the invocations that actually take place during an execution, and does not
say anything about what might happen under other circumstances. A static call graph will
show all possible invocations, also those that will never take place.
Our approach, the generation of an annotated call graph, results in a static call graph.
However, we remedy some of the weaknesses of static call graphs by introducing
annotation. The annotation reflects the conditions that have to be true for the methods to
be invoked. The downside of the annotation is increased complexity of the call graph.
4.3 ANNOTATED CALL GRAPHS
Generally, the most important benefit of a call graph is the visualization of the analysed
system. It is easier to assess a visual representation of a system, than the code itself. The
improved understanding of the system may also result in new ideas and approaches, which
further can be used to improve the system.
The annotated call graph provides additional benefits. Annotated call graphs are especially
useful in safety assessment. In safety assessment it is important to detect when and under
which circumstances a method is invoked. Dynamic call graphs, however, are not likely to
be used in safety analysis. The dynamic call graph shows only one possible way through the
system, based on the conditions that were true for that specific execution. An annotated
call graph provides information about all possibilities and the conditions for each method
invocation to take place.
An annotated call graph provides a possibility for test data generation. All conditions that
must be true are presented, and by using these conditions it is possible to generate test
data. The test data can be used to ensure that all parts of the code have been tested for
different values. Occasionally, some conditions will never be fulfilled, which in turn will
result in some methods never being invoked. This knowledge can be used to simplify the
analysed system.
When using Annotert Kallgraf, the user may turn off the viewing of standard Java-methods
and –classes (see section 8.2.11). This possibility allows the user to discover the parts of
the system that are heavily dependent on external code. It is possible for the user to
remove calls to external methods from the call graph, shifting focus to the methods
declared in the system. This phenomenon is also noted in [1]: “But sometimes including
some unnecessary system method call can complicate the call graph and make users lose
focus on other important method calls.” On the other hand, the use of external code,
especially class files, is a safety hazard, as you have little or no way of directly assessing the
code and functionality under special circumstances.
However, the annotated call graph has some limitations. Only methods that are called from
the main method, directly or indirectly, will be connected. In many cases there are methods
that only will be invoked by external interaction, e.g. when the user performs an action.
These methods will be visually separated from the main method. This means that you
cannot remove methods that appear not to be invoked in the call graph. You must have a
thorough understanding of the analysed system to be able to benefit fully from a call graph.
Another drawback is the complexity of the graph. If the analysed system is of some size,
the call graph is likely to be difficult to read.
Call Graphs
5
There is a downside of generating call graphs automatically. Drawing a call graph by hand
will increase the understanding of the analysed system. However, often there is only a small
part of the call graph that is of interest, but you still have to draw the complete graph. By
automatically generating the graph you can focus on the important parts, and not waste
time drawing parts you know you will not use. Automatic generation also makes it easier to
repeat the analysis on a changed program.
Requirements Specification
5
6
REQUIREMENTS SPECIFICATION
5.1 FUNCTIONAL REQUIREMENTS
F-1
F-2
F-3
F-4
F-5
F-6
F-7
F-8
F-9
F-10
F-11
F-12
F-13
F-14
F-15
F-16
F-17
F-18
F-19
F-20
F-21
The system will generate a call graph for programs written in Java
The programs can include more than one file, but the files must reside in the same
directory
The system will be able to generate test data for the analysed program
The system will be able to calculate the code coverage for the test data
The system will graphically show the conditions for the method calls, if the method
calls depend on conditions
The system will be able to separate standard Java methods from user-generated
methods.
The users can choose whether or not they want to see the standard Java methods in
the presentation
The system shall provide feedback to the user about its current operation.
The system must have a graphical user interface
It will be possible for the user to zoom in on the call graph
It will be possible for the user to zoom out on the call graph
If the user tries to analyse files that are not supported by the system (i.e. non .javafiles), the system will generate an error message
The system can present the Class Hierarchy Graph of the program
For every method call, the system will give the name of the class of the object
the method is called on behalf of.
Every method will exist only as one node in the graph
It must be possible to navigate horizontally in the call graph
It must be possible to navigate vertically in the call graph
If a method calls the same method several times, this will only be shown as one call
in the call graph
The user shall have the opportunity to mark parts of the graph, and then print this
part
If the printed part of the graph does not fit on a single page, it will be divided over
several pages
The system must have a Windows-based user interface
5.2 NON-FUNCTIONAL REQUIREMENTS
NF-1 The system must be able to run under both Microsoft Windows and Unix operating
systems.
5.3 DOCUMENTATION REQUIREMENTS
D-1
D-2
System documentation
General and technical documentation of the system must be generated.
User documentation
User manual and system reference must be generated
System Description
7
6
SYSTEM DESCRIPTION
6.1 INTRODUCTION
6.1.1 Parsing and Lexing
Parsing is the process of reading text written in some language and breaking it into
primitive parts to determine its syntax. The syntax is specified in a grammar, which usually
consists of several parts.
The first part is the terminals or tokens. These are the atomic symbols of the language. The
second part is the non-terminals. These are variables representing the constructs in the
language. The terminals and non-terminals are connected by productions or rules. Each
production has a non-terminal on its left side, and a set of terminals and non-terminals as
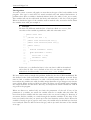
its right side, see example 1.
1
Example
The following code segment
1
var = var * 2
might correspond to the following grammar rule:
2
expression = expression MULT expression
In this grammar rule, MULT is a terminal. It corresponds to the
multiplication sign, which is an atomic component of the language.
expression is a non-terminal. The whole line is a production rule. A
grammar is a set of such production rules.
The parse tree is a hierarchical representation of the grammar. All leaves in the parse tree
are tokens, while all other nodes are non-terminals. Every node in the tree is based on a
production. A non-leaf is based on the left side of a production. Its children represent the
right side of the production.
Two different components, the lexical analyzer and the parser, perform the parsing
process. The lexical analyzer, or lexer for short, reads the program text and splits it into
tokens, removing white spaces and other irrelevant information in the process. In the code
fragment in example 1, the lexer would separate the tokens from each other. The equality
sign would be returned as a separate token, as would the variable names and the
multiplication sign. The lexer returns these symbols to the parser, which tries to match the
token sequence and the grammar rules. If there is no grammar rule matching the token
sequence, the parser generates an error.
Constructing lexers and parsers is no simple task. Therefore several generators have been
introduced. We chose to use the Java CUP [11] and JLex [10] generating tools when
constructing our parser and lexer.
System Description
8
Java CUP
Java CUP [11] is a tool capable of generating a parser. It takes a specification file as input,
and generates a parser. If the specification file only contains the grammar, the parser will
state whether or not the parsing was successful. However, it is possible to state actions to
be executed when a grammar rule is recognized. In our case, we build a parse tree from the
grammar. For instance, every time the parser detects a method invocation, we create a new
PTMethodInvocation object. The resulting parse tree works as the basis for the
construction of the class hierarchy graph and the call graph.
JLex
JLex [10] is a tool capable of generating a lexical analyzer. It takes a specification file as
input and generates a lexical analyser as output. The lexical analyser is written in Java.
6.1.2 Why Java?
Annotert Kallgraf was implemented using Java (JDK version 1.3.1, and some features from
JDK version 1.4.0 [12]). There are several reasons why we chose Java as development
language. First, the ability to run the application on different platforms is a benefit. The
user can choose whether they want to run the system in Windows or Unix. We have
chosen to use the platform’s look and feel for Annotert Kallgraf, version 1.0, but it can
easily be changed to use another look and feel. From a usability point of view, the ability to
choose platform and look and feel is an advantage.
The ability to run Annotert Kallgraf through Annotert Kallgraf is another reason for
choosing Java. We can generate the complete call graph for Annotert Kallgraf by analysing
our own files.
The last reason for choosing Java was that only one of us has developed systems in Java
earlier. On the other hand, both had previous experience in C++. Using Java gave us the
opportunity to acquire new programming skills.
6.2 HIGH LEVEL SYSTEM DESCRIPTION
After the user has selected which files to analyse, the file names are sent to the parser.
Here, all the files are parsed for the first time, and a parse tree is built. Then the class
hierarchy graph is generated. Once this is complete, the files are parsed for the second
time. Now, the goal is to produce the call graph for the analysed files. This is achieved by
combining the results of the second parsing with the class hierarchy graph.
When both graphs have been generated, they are sent to the visualization part of the
application. The visual appearance of the graphs is improved by applying a positioning
algorithm. When the positioning of the vertices of the graphs is complete, they are drawn
in the graphical user interface.
6.3 DESIGN
In this section, the packages that make up Annotert Kallgraf are presented briefly. The
complete design documentation can be found on the Annotert Kallgraf CD-ROM.
The system consists of two parts. The first part is the graph generation. In this part, the
source files are parsed, and the class hierarchy graph and the call graph are generated in
System Description
9
memory. In the second part, which is visualization, the graphs are displayed to the user.
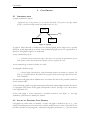
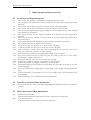
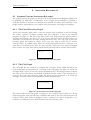
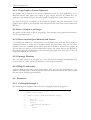
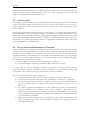
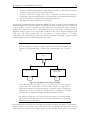
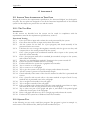
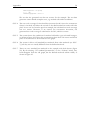
The application consists of five main packages. Their names and relations are shown in
figure 2.
Visualization
PackageInt erfaces
Graph
Parsing
Util
Figure 2: The packages and their relationship
The Visualization package constitutes the visualization part of the system. The
PackageInterfaces package provides an interface between Visualization and the rest of the
packages, which make up the graph generation part.
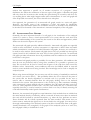
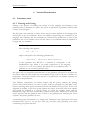
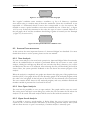
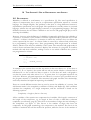
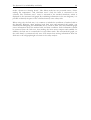
The Parsing package contains all classes necessary for parsing the files and building the
parse tree. The Graph package contains the tools necessary to build the two graphs of the
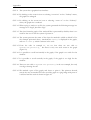
application: The class hierarchy graph and the call graph. Each graph has its own subpackage inside code.Graph, as shown in figure 3.
ClassHierarchy
Graph
Cal lGraph
Figure 3: The sub-packages in the Graph package
The Util package contains utility classes that are used by both Parsing and Graph.
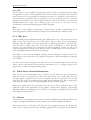
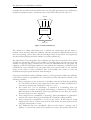
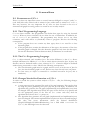
System Description
10
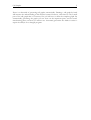
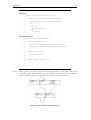
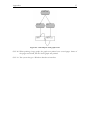
GUI
Algorithms
Figure 4: The sub-packages in Visualization
The Visualization package consists of two sub-packages, as shown in figure 4.
Visualization.GUI consists of all classes necessary to build the graphical user interface of
the program. Visualization.Algorithms contains two classes that implement the
visualization algorithm for the graphs.
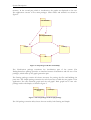
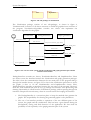
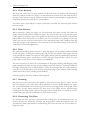
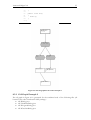
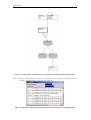
Visualization
PackageInterfaces
Graph generation
Select files to analyse
Send file names
Request class hierarchy graph (CHG)
Parsing, building CHG
Return CHG
Request call graph (CG)
Parsing, building CG
Return CG
Request drawing of CG/CHG
Layout
Present graphs and
wait for interaction
Figure 5: An overview of the system with the visualization and graph generation part and the
interface between them
PackageInterfaces contains two classes, VisualizationInterface and GraphInterface. These
two classes create the interface between the Visualization and graph generation packages.
The idea is that the communication between the two main parts of the program shall go
through the interface classes, see figure 5. If a class in the visualization part wants to access
the graphs, it does so via the VisualInterface and GraphInterface classes. Thus,
PackageInterfaces provides an interface between the two parts of the program. However,
there are some method calls that do not go through the interface. The positioning and
drawing functionality is called from the Visualization package, without passing through the
interfaces. Despite this inconsistency, there are several reasons for keeping the interface:
1. The PackageInterface is a convenient place to keep the methods that generate the
graphs. The responsibility for showing the generated graphs is also placed here.
2. The use of an interface provides a separation of the two different parts of the
system, the graphs and the visualization. This has been a great benefit during the
development, testing and fault detection of the application. We have had the
possibility to look separately at the graph generation part of the system.
System Description
11
3. Much of the communication between the two main parts goes through the
interface, and this improves the structure and organization of the application. If the
interfaces were removed, lots of classes would invoke each other’s methods
directly, thus making the structure more complex. On the other hand, forcing all
method calls to pass through VisualInterface and GraphInterface would reduce the
speed of the application. For example, the graphs are displayed by invoking the
paint method of each vertex. This functionality is not channelled through the
classes in PackageInterfaces. If the drawing functionality were to be channelled
through the interface, there would be a large increase of method calls, and a speed
reduction in the system.
6.3.1 code.Graph
This package contains classes that are necessary to model a graph. There are three classes in
the package:
• Vertex, which models a vertex in the graph
• Edge, which models an edge between two vertices
• GraphInformation, which stores information about a graph.
6.3.2 code.Graph.CallGraph
This package contains classes that are specific for the call graph. Many of the classes in this
package are subclasses of equivalent classes in code.Graph. The functionality that is
specific for the call graph is the following:
• There are two types of vertices: The invocation vertex and the condition vertex.
Each of these types has its own class. Both are subclasses of code.Graph.Vertex.
• When calculating the test data coverage, it is essential to distinguish between
different types of edges. This is taken care of by the class CGGraph, which is a
subclass of code.Graph.GraphInformation.
6.3.3 code.Graph.ClassHierarchyGraph
This package contains information that is special for the class hierarchy graph. Some of the
classes in this package are tightly connected to the classes in code.Graph through
inheritance:
• CHGGraph is a subclass of code.Graph.GraphInformation. It contains the logic
necessary to create the class hierarchy graph.
• CHGClassNode is a subclass of code.Graph.Vertex. This class models a vertex in
the class hierarchy graph.
6.3.4 code.PackageInterfaces
PackageInterfaces contains two classes that work as glue between the different packages of
the system:
• GraphInterface is the interface to the graph generating part of the system. This
class instantiates the parser, orders the parse tree to create the class hierarchy graph,
and generates the call graph.
• VisualInterface is the interface to the graphical user interface of the application.
This class builds the graph specific parts of the graphical user interface, and
manages the visualization of the graphs.
System Description
12
6.3.5 code.Parsing
This package consists of all the classes that are necessary to build a parse tree. We have
used JLex [10] and Java CUP [11] to generate two of the classes in this package. These two
classes are the parser and lexer of the application. The rest of the package consists of
classes that are nodes in the parse tree. These classes have a common super class,
code.Parsing.PTNode.
6.3.6 code.Util
Two utility classes have been placed here:
• UTILVariableStack is a stack that is used for organizing the local variable
declarations.
• UTILNodeVector is a Vector that works as a temporary storage for class graph
vertices. It is used when building the class hierarchy graph.
The classes in this package are related to the code.Parsing and code.Graph.ClassHierarchy
packages. The parse tree nodes use the UTILVariableStack to store local variable
declarations, see section 7.3.3 for the use of this class. UTILNodeVector is used by the
class code.Graph.ClassHierarchyGraph.CHGGraph to generate the class hierarchy graph,
see section 7.3.2 for details.
6.3.7 code.Visualization.Algorithms
Two algorithms that are used in graph visualization are placed here. They are implemented
in their own classes:
• ALGOSugiyama implements the Sugiyama layout algorithm, which is explained in
section 7.2.
• ALGODoubleArraySorter sorts a double array by using the QuickSort algorithm.
This class is used by ALGOSugiyama to position a graph.
6.3.8 code.Visualization.GUI
This package contains the classes that constitute the graphical user interface of the
application. All user actions are dealt with here, and responsibility is delegated to the
different packages. When the user starts a new analysis, the GUI package will contact the
code.PackageInterfaces package with the request. The classes in the GUI package will
present the returned result.
6.4 SPECIAL DESIGN CONSIDERATIONS
Annotert Kallgraf version 1.0 supports only analysis of files written in Java. We have made
the extension to other languages simpler by making the following design decisions:
• The classes in the Parsing package have been designed in a general and objectoriented way. This means that these classes are easily applicable to other languages,
and it is also easy to add new classes to this package, thus making the transition to
other programming languages easy.
• There are two important methods in the parse tree classes. The first is generating
the class hierarchy graph. The other is generating the information necessary to
build the call graph. Both these methods are recursive. In addition, the
implementations of these methods have mostly the same signatures in all classes.
System Description
•
•
•
13
This means that it is easy to implement these functions in new classes that are
introduced.
We have implemented the graph visualization algorithm of Sugiyama. All graphs are
displayed using this algorithm. When displaying the Java class hierarchy graph,
Sugiyama is not strictly necessary. In Java, multiple inheritance is not allowed.
Therefore, each class has only one parent, and the class hierarchy is a tree (see
section 4.1 for details). Many tree visualization algorithms would display the class
hierarchy faster, and more visually pleasing, than the Sugiyama algorithm. We have
used the Sugiyama algorithm because it makes extensions easier. When displaying
the C++ class hierarchy graph, one must use a graph visualization algorithm,
because multiple inheritance is allowed. If we had used a tree visualization
algorithm to display the class hierarchy graph, this algorithm would have to be
removed to allow C++ class graphs, thus making extensions more difficult.
Inside the PTNode class, we have implemented a vector containing the basic data
types of the Java language. This Vector is used when determining the types of the
parameters of a Java method. Likewise, the basic data types of C/C++ can be
stored in a similar vector.
The building of the graphs is based on the use of a parser that is constructed from
a Java grammar. By changing the grammar, one can easily generate a parser for a
new language. The only thing that is needed is a grammar for this language. This
means that constructing a new parser is a relatively simple task.
6.5 TESTING AND CONFORMANCE TO SPECIFICATION
6.5.1 Testing of Annotert Kallgraf 1.0
Annotert Kallgraf 1.0 has been tested frequently during development. In addition, we have
tested the system after it was finished. In Appendix A, a full system test according to the
specification is presented.
We have also tested the system by running all its files through Annotert Kallgraf at once
(approximately 15.000 lines of code). We had to keep the parser-generated files out of the
test, due to use of special characters in those files (see known problems in section 16.1).
The system was able to generate the class hierarchy graph and call graph for all these files.
The execution took about 30 minutes and resulted in a call graph with approximately 1.600
vertices.
6.5.2 Conformance to Specification
Annotert Kallgraf version 1.0 conforms to the specification presented in chapter 5. Every
requirement has been fulfilled. In the following we have made some remarks regarding the
conformance to the specification.
F-2
The programs can include more than one file, but the files must reside in the same directory
In addition to analyse files in the same directory, Annotert Kallgraf is able to
analyse the files in the given directory and in all sub-directories.
System Description
14
F-3
The system will be able to generate test data for the analysed program
The system is able to generate test data for relatively simple constructs. There are,
however, quite a few shortcomings in the test data generation, se section 16.1.2 for
details.
F-4
The system will be able to calculate the test code coverage for the test data
The calculation of the test code coverage is not always correct.
F-13
The system can present the Class Hierarchy Graph of the program
The class hierarchy graph is always shown (or at least available).
F-16
It must be possible to navigate horizontally in the call graph
In some cases when zooming in or out, the scrollbars may be shown wrong. As a
result some parts of the graphs may be unreachable, thus it is impossible to navigate
horizontally. This can, however, easily be remedied by the user by resizing the
graph window when this situation occurs. This problem (and solution) also applies
to requirement F-17.
F-20
If the printed part of the graph does not fit on a single page, it will be divided on several pages
Some pages that are printed may be blank. The graph drawing does not cover all
parts of the drawing context. When printing, the graph is divided into areas that fit
on one page. All these areas are printed; including those that do not contain any
information.
NF-1 The system must be able to run under both Microsoft Windows and Unix operating systems.
The application was designed, developed and tested in Windows. The installation
program is available for Windows only and the user guide is written with Windows
in mind. However, Annotert Kallgraf is tested and will run under Unix as well.
In Appendix B a list of known problems is presented. In Appendix C, we have given an
overview of the connection between functional requirement and the different classes in
Annotert Kallgraf. The overview is intended to assist during possible extension of the
system.
Annotert Kallgraf 1.0
15
7
ALGORITHMS
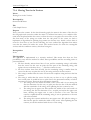
7.1 THE CALL GRAPH CONSTRUCTION ALGORITHM
Name
Call Graph Construction
Developed by
Bairagi, Kumar and Agrawal, North Carolina State University [2]
File
code.PackageInterfaces.GraphInterface
Purpose
Constructing a precise call graph by exploiting the static class hierarchy of an object
oriented program.
Prerequisites
None
The algorithm
Phase 1 – Build the class hierarchy graph
Our version of this phase is described in the section 7.3.2.
Phase 2 - Information collection phase
The objective of this phase is to collect information about the methods in the program,
and the call sites inside every method. This information is stored in a hash table. The key to
the hash table is the combination of class name and method name. In order to store the
information, we need to build a data structure containing the following data items:
• the method signature
• a list of call sites inside the method.
Algorithm
Every time we locate a method declaration, we build a data structure containing the
method signature. For every method call inside the method declaration, we store call site
information, e.g
• the list of actual parameters
• the type of the object
• the name of the method.
The call site information is added to the data structure. Then the structure is added to the
hash table. The algorithm in this phase is continued until every method inside every class
has been added.
Phase 3 - Building the call graph
The objective of this phase is to build the call graph. The information about every method
declaration in the program has already been stored in phase 2. Every method declaration
also contains a list of its method invocations. In order to fulfill this phase, we need to have
Annotert Kallgraf 1.0
16
a data structure that contains the call graph. The call graph is made up of a set of vertices
and edges.
Algorithm
The first operation is to create a list of method declarations. At the initial stage, the main
method declaration is added to the list. The algorithm then progresses by performing the
following steps, until the list is empty:
1. Retrieve the last element from the list
2. Retrieve the list of call sites from the element
3. For every call site, there are two possibilities
i. The method is not declared in the class of the object. In this case, the algorithm
progresses up the class hierarchy graph, until a corresponding method declaration
is found. The name of the class that contains the declaration is stored.
ii. The method is declared inside the class of the object. The algorithm does nothing
4. If the vertex with the given class and method name has not yet been created, create it
and add it to the list of method declarations.
5. Add the edge linking the element retrieved in 1, and the method declaration to the
call graph.
Phase 3 was used as inspiration when we developed our own algorithm for constructing the
call graph. Our version is presented in section 7.3.1.
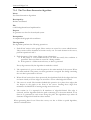
7.2 THE SUGIYAMA LAYOUT ALGORITHM
Name
The Sugiyama Layout Algorithm
Developed by
K. Sugiyama, S. Tagawa, and M. Toda [4], our implementation is mainly based on Wenbin
Ma’s work [9]
File
code.Visualization.Algorithms.ALGOSugiyama
Purpose
The purpose of the algorithm is to order the vertices in the call graph to increase
readability.
Prerequisites
Each vertex must have a unique identifier. This is implemented by using a static integer
member variable in the class Vertex.
The Algorithm
The Sugiyama algorithm distributes the vertices of a graph on different levels, and sorts the
vertices inside the levels. The final result of Sugiyama is that each vertex is assigned a
unique location in the graph. The algorithm is minimizing the edge crossings when
distributing the vertices.
The algorithm:
1. Store the unique identifiers of each vertex
2. Store the edges of the graph.
Annotert Kallgraf 1.0
17
3. Store the neighbour relations between the vertices, i.e. which vertices are edged to
other vertices.
4. Store the positions of every vertex. Initially, all positions are (0,0) (the upper left
corner of the window).
5. Assign a level to every vertex, and adjust their positions accordingly.
6. Sort the vertices inside each level by performing the barycenter algorithm. The
barycenter algorithm compares pairs of levels at the time. The positions of the
vertices at one level are fixed, whereas the vertices at the other are sorted. The
objective of the sorting is to reduce the number of edge crossings.
The algorithm executes the following for loop:
2 FOR(every level in the graph)
3 BEGIN
4
FOR(0 UNTIL 2)
5
BEGIN
6
IF(level is greater than 0)
7
Perform up-barycenter
8
IF(level is less than total level)
9
Perform down-barycenter
10
END
11 END
The Barycenter Algorithm
The vertices on the fixed level are assigned values, starting at 1 at the leftmost vertex; its
right neighbour gets 2 and so on. Every vertex on the non-fixed level will then have an
average value depending on which other vertices it is connected to, e.g. a vertex that is
connected to vertex 1 and 3 on the fixed level will have an average value of 2.
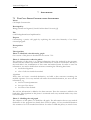
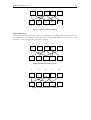
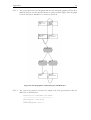
Up-barycenter
Up-barycenter keeps the vertices on the top level (of two given levels) fixed, while the level
below is the one that is to be sorted. The values are assigned to the top level, and the
average value is calculated for the bottom level, as shown in figure 6.
1
2
3
4
5
X1
X2
X3
X4
X5
3,5
3
2,5
2,5
4
Figure 6: Up-barycenter, first step
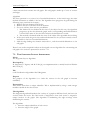
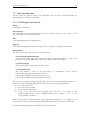
In the second step of the algorithm, the vertices on the bottom levels are sorted. The
sorting is based on the average values, and the vertex with the lowest average value is
placed at the leftmost position. Then the other vertices are placed by an increasing average
value, see figure 7.
Annotert Kallgraf 1.0
18
1
2
3
4
5
X4
X3
X2
X1
X5
2
2,5
3
3,5
4
Figure 7: Up-barycenter, second step
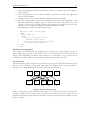
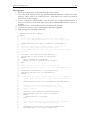
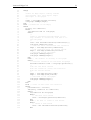
Down-barycenter
In the case of down-barycenter sorting, the principle is the same as for up-barycenter. The
only difference is that this time the lower level is kept fixed, while the top level is sorted
according to the average value, see figures 8 and 9.
2
2
2,3
4,5
3
X1
X2
X3
X4
X5
1
2
3
4
5
Figure 8: Down-barycenter, step one
2
2
2,3
3
4,5
X1
X2
X3
X5
X4
1
2
3
4
5
Figure 9: Down-barycenter, second step
Annotert Kallgraf 1.0
19
7.3 OWN ALGORITHMS
In this section we present some of the algorithms that we have developed during the
implementation of Annotert Kallgraf.
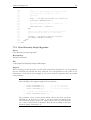
7.3.1 Call Graph Construction
Name
Call Graph Construction
Developed by
This algorithm is an extended version of the one described in phase 3 in section 7.1, and
was developed by Holmen and Strand
File
code.PackageInterfaces.GraphInterface
Purpose
To modify the algorithm presented in [2] to fit our needs for call graph construction.
Prerequisites
The basis of this algorithm consists of several classes:
code.Graph.GraphInformation
This class stores the edges and vertices in a graph. It has one subclass in each of the
packages code.Graph.CallGraph and code.Graph.ClassHierarchyGraph
code.Graph.Edge
This class models an edge between two vertices.
Code.Graph.Vertex
The class models a vertex in the call graph. It is subclassed in three classes:
code.Graph.CallGraph.CGInvocationVertex,
code.Graph.CallGraph.CGConditionVertex and
code.Graph.ClassHierachyGraph.CHGClassNode
We have also created a class that corresponds to the data structure described in section 7.1.
This class is called CGMethodDeclaration, and contains the following data items:
• the name of the class
• the name of the method
• a list of formal parameters
• a list of the call sites in the method. Each call site is an object of type
CGMethodInvocation. Each CGMethodInvocation contains a list of its
corresponding conditions.
Phase 2 (information collection phase) in the algorithm presented in 7.1 is similar to our.
As a result, the objects of type CGMethodDeclaration have been stored in a hash table.
Our phase three algorithm is described in pseudo code below.
Annotert Kallgraf 1.0
20
The algorithm
1. Retrieve the signatures of all main methods in the system.
2. For every main method: Fetch the CGMethodDeclaration that contains the main
method. These objects are retrieved from a hash table that contains all method
declarations in the program
3. Create a linked list called worklist. This list stores the CGMethodDeclarations as
they are fetched from the hash table. Store the CGMethodDeclarations from 2 in
worklist.
4. Retrieve all non—main methods and store them in the worklist.
5. Create a new object of type CGCallGraph, and call it callgraph.
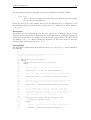
6. Step through the following while loop:
12 WHILE(worklist not empty)
13 BEGIN
14
/*
15
Fetch the last element in worklist. This element
16
is of type CGMethodDeclaration. Call this object obj1
17
*/
18
CGMethodDeclaration obj1 = worklist.lastElement();
19
/*
20
Create a CGInvocationVertex object. Initialise it
21
with the class name and method name from
22
CGMethodDeclaration. Call the CGInvocationVertex object
23
vertex1
24
*/
25
vertex1 = new CGInvocationVertex(obj1);
26
IF(vertex1 is not stored in callgraph)
27
BEGIN
28
Store vertex1 in callgraph
29
Remove the last element from worklist.
30
END
31
/*
32
Retrieve the list of method calls from the
33
CGMethodDeclaration object. Call this list methodCalls.
34
*/
35
LinkedList methodCalls = obj1.getCalls();
36
FOR(every method call in methodCalls)
37
BEGIN
38
/*
39
Retrieve the first element from the list of method
40
calls. Every element is of type CGMethodInvocation
41
*/
42
CGMethodInvocation invoc=methodCalls.firstElement();
43
/*
44
Create a CGInvocationVertex based on the
45
information in the list element. Call this
46
object vertex2.
47
*/
48
vertex2 = new CGInvocationVertex(invoc);
49
IF(callgraph does not contain vertex2)
50
BEGIN
51
Add vertex2 to callgraph
52
END
53
/*
54
Retrieve the linked list containing the conditions
55
from invoc. Call this object conditions
56
*/
57
LinkedList conditions = invoc.getConditions();
58
IF(conditions is an empty linked list)
Annotert Kallgraf 1.0
59
60
61
62
63
64
65
66
67
68
69
70
71
72
73
74
75
76
77
78
79
80
81
82
83
84
85
86
87
88
89
90
91
92
93
94
95
96
97
98
99
100
101
102
103
104
105
106
107
108
109
110
111
112
113
114
115
116
117
118
119
BEGIN
/*
Create an Edge object linking vertex1
and vertex2. Call this object edge1.
Add edge1 to callgraph.
*/
edge1 = new Edge(vertex1,vertex2);
callgraph.addEdge(edge1);
END
ELSE //conditions is non-empty
BEGIN
IF(only one condition)
BEGIN
IF(condition NOT in callgraph)
BEGIN
/*
Create a CGConditionVertex based on the
only element in conditions, and add it to
the callgraph
*/
cond = new CGConditionVertex(conditions(0));
callgraph.addVertex(cond);
// Link the first vertex with the condition
edge1 = new Edge(vertex1,condVertex);
// Link condition with the second vertex
edge2 = new Edge(condVertex,vertex2);
// add them to the callgraph
callgraph.addEdge(edge1);
callgraph.addEdge(edge2);
END
ELSE // the element is already in callgraph
BEGIN
// retrieve condition as cond from callgraph
CGConditionVertex cond = callgraph.getVertex();
/*
Link the the first vertex
with the condition (cond) and condition
with the second vertex.
*/
edge1 = new Edge(vertex1,cond);
edge2 = new Edge(cond,vertex2)
// add them to the callgraph
callgraph.addEdge(edge1);
callgraph.addEdge(edge2);
END
END
ELSE // there is more than one condition
BEGIN
prevCondition = vertex1;
FOR(every condition in conditions)
BEGIN
IF(condition IN callgraph)
BEGIN
// retrieve this vertex
cond = callGraph.getVertex(condition)
END
ELSE // we have to create a new vertex
BEGIN
// create a new vertex
cond = new CGConditionVertex(condition);
END
21
Annotert Kallgraf 1.0
120
121
122
123
124
125
126
127
128
129
130
131
132
133
134
135
136
137
138
139
140
22
/*
create an edge between the condition and
prevCondition, and add it to the
callgraph
*/
edge1 = new Edge(prevCondition,condition);
callgraph.addEdge(edge1);
/*
set prevCondition equal to condition
*/
prevCondition = condition
END
/*
create the edge between condition and the
second vertex and add it to callgraph
*/
lastEdge = new Edge(condition,vertex2);
callgraph.addEdge(lastEdge);
END
END
END
7.3.2 Class Hierarchy Graph Algorithm
Name
Class Hierarchy Graph Algorithm
Developed by
Holmen and Strand
File
code.Graph.ClassHierarchyGraph.CHGGraph
Purpose
When analysing several Java-files, or a file with several class declarations, it is no guarantee
that an extended class already has been analysed. To avoid problems in the order of the
declarations of the classes (see example 2), we had to make an algorithm that can handle
such problems.
2
Example
The following code fragment might lead to problems
3
4
5
6
7
8
class A extends D {}
class B extends C {}
class C extends D {}
//D is not declared
//C is not declared
//D still not defined
//finally the definition of D
class D extends Object {}
The problem is that several classes inherit classes that have not been
declared yet. In the case of A (line 3), this class cannot be added to the
class hierarchy graph, because its super class D has not been declared
yet. A has to wait until D is declared. Then D can be added to the class
hierarchy graph, followed by A.
Annotert Kallgraf 1.0
23
The class implementing the algorithm contains one fundamental member variable:
scan_list
This is a vector containing classes that have been declared, but whose super
class has not been declared yet.
In the first line of the code example above, D is not declared, but it is referred to in an
extends-relationship. A is declared, but its super class is not. Therefore, A will be added to
scan_list.
Prerequisites
Prerequisites for the algorithm are that we have a parse tree containing objects of type
PTNode, and that these objects implement the createCHG method. During the parsing, all
classes that extend Object are added to the class hierarchy graph directly. All other classes
are added to scan_list. When starting this algorithm, we have some classes in the class
hierarchy graph and some in the scan_list.
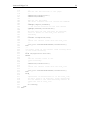
The Algorithm
The algorithm is implemented in the method CHGGraph.emptyAll(), and is outlined in
the following.
141
142
143
144
145
146
147
148
149
150
151
152
153
154
155
156
157
158
159
160
161
162
163
164
165
166
167
168
169
170
171
172
173
174
175
/*
As long as there are elements in the scan_list,
keep scanning through it.
*/
WHILE(scan_list NOT empty)
BEGIN
FOR(every currentClass in scan_list)
BEGIN
/*
Get the class at the current position (i)
*/
currentClass = scan_list.getElementAt(i);
/*
Fetch the name of the super class of currentClass
*/
superClass_name = currentClass.getSuperClass();
/*
Get the super class of currentClass from the class
hierarchy graph, returns null if not found
*/
superClass = findClassWithName(superClass_name);
/*
If the superClass is not in the scan_list and
not in the class hierarchy, then we know that
superClass must be imported, i.e. it belongs to an
imported Java-class. Create a new vertex in the
class hierarchy and set it’s child
*/
IF((superClass_name NOT in scan_list) AND
(superClass EQUALS null) )
BEGIN
/*
create a new node with the name of superClass
*/
newNode = new CHGClassNode(superClass);
Annotert Kallgraf 1.0
176
177
178
179
180
181
182
183
184
185
186
187
188
189
190
191
192
193
194
195
196
197
198
199
200
201
202
203
204
205
206
207
208
209
210
211
212
213
214
215
216
217
218
219
220
221
222
223
224
/*
Add the two new vertices to the graph
*/
addVertex(currentClass);
addVertex(newNode);
/*
Add the two new edges
The first connects the root vertex and newNode
*/
addEdge(chgRoot,newNode);
// The second connects the two new classes
addEdge(newNode,currentClass);
/*
We know that the new node must be imported,
since it wasn’t in the scan_list and the
hierarchy
*/
newNode.setImported(true);
/*
remove the current class from the scan_list
*/
scan_list.removeNodeWithName(currentClass);
END
/*
the super class of the current class already exist
in the class hierarchy
*/
ELSE IF(superClass NOT null)
BEGIN
/*
add the current class to the
class hierarchy
*/
addVertex(currentClass);
/*
remove the current class from the scan_list
*/
scan_list.removeNodeWithName(currentClass);
END
ELSE
/*
superClass of currentClass is in the scan_list,
we don’t need to do anything, since superClass
will be added to the class hierarchy before we
reach the end of scan_list.
*/
do nothing;
END
END
24
Annotert Kallgraf 1.0
3
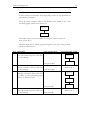
25
Example
In this example we illustrate how emptyAll() works on the declarartions
presented in example 2.
Class D, which extends Object, has already been added to the class
hierarchy graph, which now consists of:
Object
D
The other classes have been added to scan_list, which consists of:
scan_list(A, B, C)
Method emptyAll() is called, going through the scan_list as long as there
are more elements in it.
Step emptyAll()
1
scan_list after step
Get first element (A), and its super
class (B). Check B: True at line 215
=> do nothing.
Class hierarchy graph
Object
D
2
3
4
scan_list(A,B,C)
Get next element (B), and its super
class (C). Check C: True at line 215
=> do nothing.
scan_list(A,B,C)
Get next element (C), and its super
class (D). Check D: True at line 203
=> add C to class hierarchy graph,
remove C from scan_list.
scan_list(A,B)
Get next element (A), and its super
class (B). Check B: True at line 215
=> do nothing
scan_list(A,B)
Same as in 1
Object
D
C
Same as in 3
Annotert Kallgraf 1.0
5
26
Get next element (B), and its super
class (C). Check C: True at line 203
=> add B to class hierarchy graph,
remove B from scan_list.
Object
D
C
B
scan_list(A)
6
Get next element (A), and its super
class (B). Check B: True at line 203
=> add A to class hierarchy graph,
remove A from scan_list.
Object
D
C
B
A
scan_list()
7.3.3 Variables
Name
Variables
Developed by
Holmen and Strand
File
The algorithm is implemented in several files. UTILVariableStack.java contains the code
that administrates the variables. This class is used by several classes in the package
code.Parsing.
Purpose
The purpose of this algorithm is to find which variables that are valid at a point in the
program. We must know these variables to find the correct object and parameter types in
method calls.
Prerequisites
The class hierarchy graph generation must be finished.
Annotert Kallgraf 1.0
27
The Algorithm
In order to create a correct call graph, we must know the type of the local variables in the
program. The type is used when we match method calls and method declarations. A
problem arises when a variable is declared within a block (for, while, if, else, try or catch).
This variable will only be valid inside the block, and unknown to the rest of the program.
When we decide the types of the variables used in method calls, we need to know where
the variables were valid, see example 4.
4
Example
We have two different methods (line 13 and 14) called calculate, but
one takes a float variable as parameter, while the other takes an int.
9 public class test
10 {
11
private int var1 = 0;
12
public void calculate(int var){}
13
public void calculate(float var){}
14
15
public test()
16
{
17
18
boolean finished = false;
19
while(finished == false)
20
{
21
float var1 = 0.0f;
22
finished = true;
23
}
24
calculate(var1);
25
}
26
27 }
In this case var1 defined at line 11 is the one that is valid in the method
call at line 25. The var1 defined at line 22 is not known outside the
while block. In other words, calculate(int var) is called.
We have used a stack to remedy this problem, defined in the class UTILVariableStack. We
also defined a class CGLocalVariable, where the variable’s name and type is stored. Every
time we find a variable declaration, we add a CGLocalVariable-object to the stack. To
know where the variables are valid, we add a unique identifier of type Integer every time we
enter a block. When we leave a block, we delete all objects on the variable stack, including
the unique identifier for that block. This way, we always know which variables are valid at
any point in the program.
When we discover a method call, we check the parameters of the call. If any of the
parameters is a variable, we search the variable stack for a variable with this name. We
know that the first variable with the same name is the one we are looking for. However, if
we cannot find the variable, we search through the member variables of this class. If we
have not found in this class, we search up in the class hierarchy until we find it. When the
variable is found, we get its type. In some cases, the variable may be defined in a class that
is not analysed. Then we will not know the type, and we just write the name of the variable
as its type.
Annotert Kallgraf 1.0
28
7.3.4 Placing Text in the Vertices
Name
Placing Text in the Vertices
Developed by
Strand and Holmen
File
Code.Graph.Vertex
Purpose
Every vertex has a name. In the class hierarchy graph, the name is the name of the class. In
the call graph each vertex has either the name of a method invocation, or a condition. The
name must be placed within the vertex to allow the user to recognize the vertex. Due to the
fact that many of the strings are wider than the 100 pixels of the vertex, we had to
implement an algorithm for splitting long names into shorter ones. Inside a vertex there is
room for four lines of text. In the following, we have outlined the algorithm that makes
sure that the names fit inside the vertex. The method works for both the rectangular
vertices and the condition vertices, which are hexagons.
Prerequisites
None
The Algorithm
The algorithm is implemented as a recursive method. This means that there are four
possibilities every time the method is called. These possibilities and the according action is
presented below:
1. We have already written three lines of text, and the remaining string is still wider
than the vertex. In this case we print the first part of the remaining string, and
replace the rest with three dots (…). The line counter is reset.
2. We have written three lines already, but the remaining string is smaller than the
vertex. In this case we print the rest of the string and reset the line counter.
3. The string is smaller than the vertex. We write the complete string and reset the line
counter.
4. The string is wider than the vertex. In this case, we have to try to split the string
into several parts. It would be best to split after a dot (punctuation mark) or before
an upper case letter. There are three alternative situations:
i. The string has a dot within the width of the vertex and it is not among the
first six characters. In this case, we split just after the dot. Call this method
with the remainder of the string, after updating the line counter by one.
ii. The string has an upper case letter within the width of the vertex and it is
not among the first six characters. If so, we split just before the upper case
letter, allowing the upper case to start a new line of its own. The line
counter is updated and the remaining string is sent as parameter to the new
call to this method.
iii. The string does contain neither dots nor upper cases. We split the string so
that the first part fits within the width of the vertex. After updating the line
counter, we call this method with the rest of the string.
Annotert Kallgraf 1.0
29
7.3.5 The Test Data Generation Algorithm
Name
Test Data Generation Algorithm
Developed by
Holmen and Strand
File
code.PackageInterfaces.GraphInterface
Purpose
To generate test data for the analysed system.
Prerequisites
A completed call graph with conditions.
The Algorithm
The algorithm performs the following operations:
1. Find all leaf vertices in the graph. These vertices are stored in a vector called bottom.
Then, retrieve all the elements in bottom one by one. For each element in the vector,
perform operation 2 and 3.
2. Find the parent of the vertex. There are two alternatives:
A. If the parent is a CGConditionVertex, test data that satisfy this condition is
generated. These test data are stored in a String variable.
B. If the parent is a CGInvocationVertex, no data is generated.
Every edge traversed by the algorithm is marked as visited.
3. The operation in 2 goes on until the parent is the main method of the system. When
the main method is the parent, test data generation is stopped. The String containing
the test data is presented to the user.
4. When all leaf vertices have been processed, the algorithm finds all the edges that have
not been visited yet. These edges are stored in a vector called edgesNotVisited.
5. The vector is sorted. The intention behind this operation is to place those edges that
are deepest in the graph at the front of the vector. Treating these edges first
minimizes the likelihood of treating an edge more than once.
6. The routine in 2 is repeated for all members of edgesNotVisited. The edge is
retrieved, and the algorithm finds the path connecting it to the main method. A test
data set is generated for each vertex along the path. The algorithm stops when all
elements in edgesNotVisited have been treated.
When generating data for an if-then-else vertex, one has to follow a special algorithm,
which is outlined below.
Annotert Kallgraf 1.0
30
Remember that test data generation always progresses upwards. When arriving at an ifthen-else condition, one has to know the previous vertex the algorithm passed through.
There are three different alternatives with corresponding actions:
1. The last condition was an if-condition. This corresponds to the rightmost branch in
figure 10. In this case data has already been generated for the condition, and the
algorithm does nothing.
2. The last condition was an else-if condition. This corresponds to the centre branch of
figure 10. We then progress through the following steps:
• Find all conditions that are before the else-if in question, and store them in
the vector brothers. We organise the conditions in logical order. This means
that the if-condition is first, followed by the else-if-condition(s). The else
condition is logically at the end. In the figure below, only the if-condition is
before the else-if. The else-condition is after the else-if.
• Find the corresponding if-condition, and generate data so that this condition
is false.
• Ensure that the test data are false for all members of the vector brothers, and
true for the current else-if condition. If one condition evaluates to true, new
data are generated for the if-condition. This operation goes on until all
conditions in brothers evaluate to false.
3. The last condition was an if-condition. In this case, we find all conditions that
precede the else-condition, and store them in the vector brothers. This means that
brothers contains all conditions in the if-then-else block, except the else condition.
We find the if-condition, and generate data so that this condition is false. Afterwards
we investigate if these test data falsify all other conditions in brothers. If one
condition is true, we generate new data for the if-condition, and perform the
investigation again. We stop this loop when all conditions in brothers evaluate to
false.
Figure 10: The annotated call graph for an if-then-else condition
Annotert Kallgraf 1.0
31
8
ANNOTERT KALLGRAF 1.0
8.1 SYMBOLS USED BY ANNOTERT KALLGRAF
The symbols used in the graphs are based on the Extended Structure Diagrams (ESD) used
by SINTEF [3]. ESD uses a combination of an octagon and a rectangle to symbolize a
condition that has to be true for a method to be invoked. To reduce the complexity of the
graphs we have replaced these two symbols with one hexagon containing the condition.
8.1.1 The Class Hierarchy Graph
In the class hierarchy graph, there is only one symbol used, in addition to the lines linking
the vertices together. A simple rectangle with text symbolizes a class in the analysed
program, see figure 11. The text is the name of the class. Long names are split in order to
fit inside the rectangle (see section 7.3.4). If the text still does not fit after four splits, it is
shortened (can be seen by the name ending with three dots). The top node in the class
hierarchy graph will always be Object, since every Java class in some way or another
extends Object. A problem arises when the analysed program contains a reference to a
class that is not defined in the files. If a class extends a super class that Annotert Kallgraf
does not find, the super class will be placed directly between Object and the analysed class.
Object
Figure 11: A vertex in the class hierarchy graph
8.1.2 The Call Graph
The call graph has two symbols, a rectangle and a hexagon. Every called method in the
analysed program is represented by a rectangle in the call graph, see figure 12. Inside the
rectangle there is a text, at least two strings separated by dots. The String sequence contains
the name of the class where the method is defined, and the name of the method that is
invoked. As in the class hierarchy graph, the name may be shortened to fit inside the
rectangle. The main method is recognized by thicker boundary lines.
ClassName.
main(String)
Figure 12: An invocation vertex in the call graph
The other symbol in the call graph, a hexagon, is the condition vertex (figure 13). In the
analysed program, there will often be conditions that must be true for some methods to be
invoked. Every time Annotert Kallgraf locates a method call that is dependent on a
condition, a condition vertex is drawn between the caller and the callee.
Annotert Kallgraf 1.0
32
if(a<0)
Figure 13: A condition vertex in the call graph
The “regular” condition vertex contains a condition, e.g. for or if. However, a problem
arose when trying to visualise many if-then-else statements. From the visualization it was
impossible to understand which if-vertex that corresponded to the else-vertices. We
decided to create a special condition vertex that contained the text “if then else”, se figure
14. For every if-then-else statement in the code, this type of vertex is created. Below it in
the call graph, the if and else conditions that belong together is located (see also Example
1, figure 15, in section 8.3.1)
if then else
Figure 14: The special if-then-else condition vertex
8.2 SYSTEM FUNCTIONALITY
In this section the most important features of Annotert Kallgraf are described. For more
details about how to use the system, please see the user manual.
8.2.1 New Analysis
To start a new analysis is the most basic operation in Annotert Kallgraf. Most functionality
will not be enabled before an analysis is performed. When the user wants to start a new
analysis, a dialog box will pop up. Here the user can select the file(s), directory (-ies) or files
and directories that are to be analysed. After selecting the files, another dialog box will be
shown. Here, the system provides feedback to the user about the current progress of the
analysis.
When the analysis is completed, two graphs are drawn in the right part of the graphical user
interface (GUI). One graph shows the class hierarchy graph of the analysed program, while
the other is the call graph. In the left part of the GUI, the class hierarchy tree is presented.
The tree contains all the classes in the analysed program, and every member method and
member variable is presented as a leaf node in the tree.
8.2.2 Save Open Analysis
The user has the possibility to save an open analysis. The graphs and the trees are saved.
The saving action will open a new dialog box, where the user can name the file where the
analysis is to be saved. All saved analysis will be saved as files with the extension .aks.
8.2.3 Open Saved Analysis
It is possible to restore a saved analysis. A dialog allows the user to locate a previously
saved .aks file. A restored analysis will behave as a recently generated analysis. The system
will not allow the user to open a new analysis, if another analysis is currently open.
Annotert Kallgraf 1.0
33
8.2.4 Close Analysis
The user can easily close an open analysis. If the user closes an analysis, all information
about this analysis will be lost. Thus, it is important that the user saves the analysis before
closing, if (s)he wants to keep it. However, in most cases it is quite simple to regenerate the
analysis by selecting the same files in a new analysis.
In order to start a new analysis or open a previously saved file, any currently open analysis
must be closed.
8.2.5 Print Preview
Before printing a graph, the pages can be previewed. The print preview will show the
graphs exactly as they will be printed on paper. The user can choose to only preview a part
of the graph, by marking a part of the graph (see the Print section for details). The preview
will be drawn with the current zoom factor (see 8.2.7 for details on zooming). In preview
mode, the user can select the zoom factor of the previewed pages, and a smaller value will
show more pages at the same time. Note that this zoom factor has nothing to do with the
zoom factor in the main application.
8.2.6 Print
The print functionality allows the user to print the graphs on any printer already installed
on the computer. A dialog box will pop up, and the user can specify which pages that are
to be printed, the number of copies etc. The graphs will be printed in landscape orientation
as default. Printing with a zoom factor of 100% will give large and few vertices on every
page, while a zoom factor of 50% will give a readable text.
The user can choose to print only a selected part of the graph. Clicking and dragging in the
graph window will select the area. A red rectangle shows the selection. Nothing outside the
rectangle will be printed. It is fully possible to select an area larger than the screen, either by
using the zoom functionality or by moving towards the edge of the window while selecting
(which will result in auto scrolling of the window).
Only the graph in the active window will be printed.
8.2.7 Zooming
The user can zoom in and out on the graph. At start-up, the zoom factor is 100%, but the
user can change it at any time. The only requirement is that the graph windows are open.
The zoom functionality can be used to get an overview of a bigger part of the graph. If the
user selects an area while zoomed, the same area of the graph will be selected when
zooming out. In other words, a part of the graph can be chosen with a zoom factor of 10%
and the same part will still be selected at a zoom factor of 50%.
8.2.8 Generating Test Data
To generate test data, the user is presented with a dialog box. In this dialog box one can
choose the class for which the test data will be generated. After choosing the class, the
generated test data is presented in another dialog box. Here the user can save the data to a
regular text file.
Annotert Kallgraf 1.0
34
8.2.9 Copy Graph to System Clipboard
The graphs can be copied to the system’s clipboard for use in other application, e.g. in
Microsoft Word. The graphs are copied as jpeg images, and can be pasted into any
application that handles images. The active graph is copied either via the menu or ctrl-c.
If a part of the graph is selected (see 8.2.6 Print for details), only the marked part of the
graph will be copied to the clipboard. This functionality has only been tested in Microsoft
Windows.
8.2.10 Save a Graph as an Image
The graphs can be saved to disk as jpeg-images. The currently active graph will be saved to
the user specified location.
8.2.11 Show Standard Java Methods and Classes
A standard Java method is a method that is not defined in the analysed files. Likewise a
standard Java class is a class that is defined outside the parsed files. The user can select
whether or not the standard Java methods and classes should be shown in the graphs. If
the user does not want to see the standard Java classes, the classes that are not defined in
the analysed files will not be drawn in the class hierarchy graph. The same goes for the call
graph and standard Java methods.
8.2.12 Arrange Windows
The two graph windows in the right part of the GUI can be arranged automatically. The
user can select to either cascade the windows, or tile them horizontally.
8.2.13 Help Functionality
Annotert Kallgraf has built-in help functionality. The help files are presented in a new
window. The help files are in most respects the same as the user manual. The files are html
files and can be navigated through links.
8.3 EXAMPLES
8.3.1 Call Graph Example 1
The following code fragment will result in the call graph presented in figure 15.
5
Example
28 public class write
29 {
public static void main(String args[])
30
{
31
int a=0;
32
float b = 0.0f;
33
34
if(a>b)
System.out.println();
35
else
36
foo();
37
Annotert Kallgraf 1.0
38
39
40
41
42
43
44 }
35
}
public void foo()
{
write();
}
Figure 15: The call graph for the code in example 5
8.3.2 Call Graph Example 2
The all graph in figure 16 is generated for the combined code of the following files (all
located in the code.Visualization.GUI-package):
• GUIDialog.java
• GUITestDataDialog.java
• GUIProgressDialog.java
• GUIClassListDialog.java
Annotert Kallgraf 1.0
•
GUIAboutDialog.java
Figure 16: The call graph for GUIDialog and its sub-classes
36
Testing
37
9
TESTING
In this chapter, we discuss different types of testing and their relations to the call graph. In
section 9.5 we describe how our system is related to testing.
9.1 BLACK BOX TESTING
In this type of testing, the system is seen as a black box. This means that no information
about the internal system structure is available, only the inputs and the outputs of the
program. The system is seen as a black box that is receiving inputs and generating outputs.
Black box testing is only weakly related to the annotated call graph. In order to generate the
call graph, one needs access to the code of the system. This is not necessary when
performing black box testing. In addition, the call graph gives information about the
internal structure of each method. Therefore, the graph contains much more information
than is actually needed to do black box testing of a method. Thus, it is not useful to
connect black box testing and the call graph.
9.2 WHITE BOX TESTING
In white box testing, the internal structure of the code is analysed to generate test data. The
advantage of this kind of testing is that a code analysis can be used to find the path
coverage. A path is a sequence of edges that connects the main method to a leaf vertex. A
leaf vertex is a vertex that has no outgoing edges. In Annotert Kallgraf, all the standard
Java methods (see section 8.2.11) are leaf vertices.
9.2.1 Path testing
This is a kind of testing where the objective is to test every path through the program. The
system is represented as a flow graph. Every program statement is represented in this flow
graph. Special vertices represent if-then, if-then-else and while-statements. The flow graph
resembles the annotated call graph that we have generated. However, the flow graph
contains every statement in the program, whereas the call graph only represents method
calls. This means that the two graphs are a bit different; see example 6.
6
Example
The following code fragment, written in Java, will be represented
differently in a flow graph and an annotated call graph:
45 while(I < 100)
46 {
47
Number++;
48 }
The statement inside the block is an increment statement. Therefore, it
will be represented only in the flow graph. The annotated call graph will
ignore this block because it does not contain any method invocations.
The test path coverage is a fraction. It represents the number of paths that are executed by
a test data set, divided by the total number of paths in the graph. From the tester’s point of
Testing
38
view it is important to maximize the test path coverage, because this ensures that a high
number of program paths have been executed. However, for everything but simple
programs, it is impossible to achieve test coverage of 100% for a single test data set, as
illustrated by example 7.
7
Example
An if-then-else statement makes it impossible to achieve a test coverage
value of 100%:
49
50
51
52
53
54
if( A > B)
{
}
else
{
}
Any test data set that satisfies the condition A > B, will follow the first
path but not the second. Any data set satisfying the else condition (i.e. A
≤ B) will follow only the second path, but not the first. This means that
in the presence of if-then-else statements, test path coverage of 100% is
impossible. In practice, the solution is to generate several test data sets
that altogether guarantee that every path will be followed. As testing is a
tedious activity, it is still important to find a test data set that maximizes
the test coverage.
Two other problems arise when generating test data:
• Even when test coverage of 100% has been achieved, this does not mean that the
system has been thoroughly tested. It only means that all paths have been followed
in the execution of the program.
• It is impossible to generate test data for all combinations of paths. It is possible to
generate test data that follows one path after another. However, the number of
combinations of paths is enormous for all but trivial programs.
In spite of these two problems, we believe that it is natural to use white box testing when
generating test data from an annotated call graph. We have used this approach in our tool.
9.3 INTERFACE TESTING
Interface testing implies testing the interaction between different components. This type of
testing is used when integrating different components of a program. Each component has a
defined interface that is used by other components. The objective of interface testing is to
detect faults that may have been introduced because of errors in the interfaces. Testing a
single unit cannot expose most interface errors, because they are the result of the
interaction between components.
Interface testing focuses on the practical consequences of actually running the program. A
static call graph generator does not execute a program; it just visualizes its structure. It does
not show which invocations that are done during execution. Interface testing requires the
execution of the program. Since our system is a static call graph generator, it is difficult to
generate test data based on the conditions that are stored inside a method. On the other
hand, it is possible for a static call graph generator to generate a test program. This
Testing
39
program might instantiate objects of different classes, and invoke their interface methods.
In this case, the program would generate a Java source file containing test code. This file
might be compiled and executed by the user.
9.4 UNIT TESTING
Unit testing is performed by invoking the different methods of a program unit, for example
a class. The disadvantage of unit testing is that it only tests the interface of the class as a
single component. Errors stemming from the interaction with other components would
not be exposed.
Unit testing requires the practical execution of a program. For a static call graph generator,
this is impossible. What is possible, though, is to generate a program that creates a class
object and calls its methods. However, generating this program is nontrivial, because there
are usually dependencies between classes. Calling one object’s methods might require the
instantiation of several other objects because of dependencies between classes. Detecting
these dependencies is a difficult task.
9.5 USE OF ANNOTERT KALLGRAF IN TESTING
Annotert Kallgraf has a simple and rudimentary test data generator. The approach is based
on white box testing. The generator evaluates every condition in the graph, and generates a
test data set that satisfies this condition. For every data set, the test coverage is also
calculated. However, this calculation is not based on the different paths (see path testing,
section 9.2.1) of the program. Instead, it is based on the edges of the annotated call graph.
The edges of the graph are of two types:
• Trivial edges, for example those connecting two conditions.
• Non-trivial edges connecting a condition and a method invocation.
For every data set, Annotert Kallgraf calculates the number of non-trivial edges that are
passed by using the data set. In addition, the total number of non-trivial edges in the graph
is calculated. The test data coverage is the division of the two numbers.
The test data generator has several weaknesses:
• It only generates test data for numeric (float, double and integer) data types.
• If there are non-numeric data types inside a condition, test data is not generated.
• If there is a method call inside the condition, test data is not generated. Similarly, it
does not generate data for conditions that contain inequality (!=), equality (==) or
division (/).
• Test data is generated individually for each condition. If there are dependencies
between conditions (for example if the same variable is appearing in two
conditions), the generator does nothing to detect these dependencies. On the other
hand, exploiting such dependencies requires knowledge about all operations that
are performed on a variable.
• When data has been generated, the programmer must manually manipulate the
code by filling in the values of the variables. Afterwards, the program must be
compiled and executed.
The System’s Use in Reliability and Safety
40
10 THE SYSTEM’S USE IN RELIABILITY AND SAFETY
10.1 RELIABILITY
Reliability is defined as conformance to a specification [5]. The word specification is
subject to interpretation, but it may be a requirements specification written in a natural
language, for example English. The problem is that there is a large difference between a
requirements specification and a call graph. The specification is usually written in a natural
language, whereas the call graph displays constructs in a programming language. The large
difference between the two makes it difficult to see how the call graph might play a role in
assessing the reliability.
However, there are other definitions of reliability. Sommerville [6] defines the reliability of
a system as “a function of the number of failures experienced by a particular user of that
software”. A failure is defined as “a situation in which the software does not deliver the
service expected by the user”. A software failure is caused by a software fault, which may
be a programming or design error. Thus, programming faults might result in software
failures, which in turn affect the reliability of the system. The annotated call graph makes it
easier to detect software faults, because it displays the structure of a program. It visualizes
method calls and their conditions, making it easier to see which conditions the system is
not programmed to tolerate.
8
Example
55 if(var > 13)
56 {
57
method_call();
58 }
In example 8, the system does not take any action in the case where var is less than or
equal to 13. If var equals 0, the system will not take any action. Maybe a software fault is
introduced if var has a value less than or equal to 13. One does not need a call graph to
see that the system only takes action if var is greater than 13. A program inspection can
verify this. However, program inspections are tedious. It is easier to spot potential errors if
the program structure is visualized. The annotated call graph visualizes this relationship,
and it may therefore be helpful in improving the reliability.
There are several different metrics that are used to assess the reliability of a system. One
well-known metric is the complexity coefficient of Henry and Kafura [6]. This coefficient
calculates the complexity of a single component, and the coefficient is based on the
following equation:
Complexity = length x (fan-in x fan-out)2
All the variables of the equation are component-level variables. The length is a measure of
the length of the component, e.g. its length in lines of code or McCabes cyclomatic
complexity (see Glossary, page 50). The fan-in is the number of edges that are incoming to
the component, see figure 17. The fan-out is the number of edges that leave the
component. In call graph terminology, the component is the method. The fan-in is the
number of methods that call the method in question, while the fan-out is the number of
The System’s Use in Reliability and Safety
41
methods that are called from that method. In our call graph-generating tool, standard Java
methods would always have a coefficient value of 0, because their fan-out value is 0.
Fan-in
method.
invocation()
Fan-out
Figure 17: Fan-in and fan-out
The objective of Henry and Kafura was to identify the components that are likely to
produce errors, and thus affect the reliability. The two researchers validated their metric on
the Unix operating system. The results showed high values of this metric for components
that had caused a disproportionate number of system problems [6].
The importance of the call graph is that it displays the edges that are the basis of the fan-in
and fan-out calculations. Fan-in is the number of incoming edges, whereas fan-out is the
number of outgoing edges, numbers that can easily be calculated from the call graph. By
supplying a value for the length variable of every method, the complexity coefficient can be
calculated for every method in the call graph. Thus, the system could sort the methods
based on the values of their coefficient. This would enable the system to locate the
methods that require special attention from developers.
Cheung has introduced another reliability metric [7]. Cheung’s metric reflects the reliability
of the whole system as a probability of its successful execution. The metric is based on the
following variables:
• Every component in the system has a reliability value that reflects the probability
of a successful execution of this component. If this value is 0.985, the likelihood of
error when executing this component is 0.015, or 1.5 %.
• The system has a set of transitions. A transition is a branching from one
component to another. In call graph methodology, a transition is a method call.
When method A calls method B, control is passed from A to B. Thus, the transfer
of control from A to B is a transition.
• Every transition has a probability of occurring. These probabilities are gathered in
a matrix. The matrix entry [i,j] is the likelihood of method i calling method j.
• Every component corresponds to a state in the system. If the system is inside
component K, then it is said to be in state K. This means that every method in the
call graph corresponds to a state.
• Two additional states are introduced. These are the states C (correct) and F
(failure). C occurs if the results of the system are correct. The system ends in state
The System’s Use in Reliability and Safety
42
F if an error occurs during execution. Because a run of the system is either a
success or a failure, it has to end up in one of these states.
According to Cheung’s metric, the system reliability is the probability of starting from an
initial state and ending in state C (where the system has produced correct output). The
calculation is based on two sets of data:
• The reliabilities of the individual components
• The probabilities of transition from one state to another.
The annotated call graph might be of importance when calculating the transitional
probabilities. Usually, these probabilities are difficult to calculate, and it is tempting to use a
uniform probability distribution when generating these values. However, the annotated call
graph displays the conditions that have to be fulfilled before a transition is performed.
Based on these conditions, it is possible to calculate realistic probabilities for the
transitions. This means that the final value of the reliability metric might be more realistic.
We conclude that the annotated call graph might simplify the calculation of some wellknown reliability metrics. However, these calculations are not implemented in our system
at present.
10.2 SAFETY
Safety is defined as “freedom from those conditions that can cause death, injury,
occupational illness, damage to (or loss of) equipment (or property), or environmental
harm” [5]. Thus, safety is a function of the relationship between the system and its
environment, as shown in figure 18.
Requirements
Reliability
System
Safety
Surroundings
Figure 18: The relationship between the system, reliability and safety
The safety risks of a system are usually illustrated by using a fault tree (see example 9). A
fault tree is a logical diagram illustrating the connection between an unwanted event in a
system and the reason for this event [8]. The fault tree is conceptually close to the system’s
environment, because it is constructed based on the errors that might occur when the
system is executing.
The call graph, on the other hand, is constructed from the source code of the system. It
does not say anything about the system’s environment. It is impossible to define the
environment by looking at the call graph. This means that there is a gap between the fault
tree and the call graph.
However, annotated call graphs and fault trees may be combined to help doing safety
analysis and safety validation. A safety testing approach that makes use of both fault trees
and annotated call graphs is described in [3]. The approach has six steps:
1. Specify the system’s environment and architectural design
2. Perform a HazOp-analysis, which results in a set of safety risks. These risks are
called hazards.
The System’s Use in Reliability and Safety
43
3. Analyse all identified hazards by using fault tree analyses. The fault tree analysis
determines the possible reasons for every failure.
4. Perform white box testing. This step is optional. If white box testing is
performed, steps two and three have to be repeated for the implemented system.
5. Use the fault trees to identify safety related failure modes
6. Develop tests and checklists for every hazard.
In step four, Extended Structure Diagrams (ESDs) are used to increase the knowledge and
understanding of the analysed system. The ESD will show in what state the software has
to be in order to invoke a method call. The ESD is an annotated call graph, because it
displays the conditions that have to be fulfilled in order for a method to be invoked. The
diagrams used in [3] also use a syntax that is similar to the one in Annotert Kallgraf. The
fault trees will show failures that are connected to certain methods or software
components. By combining the fault trees and the annotated call graph, one gets a better
understanding of how the software might affect safety.
9
Example
In this example, we want the system to shut down when the temperature
exceeds a pre-defined value, or when the user manually tries to turn it
off.
System not shutting
down
S
Software error
Error reading the
temperature
SE
RT
Figure 19: The fault tree for the given example
From the fault tree in figure 19, we see that there are two possible
reasons why the system does not shut down when it is supposed to.
Either the software is not acting correctly, or there is an error reading the
temperature. In this example, we assume that the temperature reading
only fails due to hardware problems, and disregard it for now.
By using the fault tree, we have located one source of potential hazard:
The software fails. We know that the method shutdown() is responsible
for shutting the system down.
By combining the information in the fault tree and the annotated call graph, it is possible to
map the causes to the system states. This means that one identifies the method(s) that are
called when the system is in a failure mode. In the example above, there is one failure
The System’s Use in Reliability and Safety
44
mode: “System not shutting down”. This failure mode has two potential causes: “Error
reading the temperature” and “Software error”. Only the latter is connected to the
software. The “Software error” cause is activated in the method shutdown, which is
displayed in the annotated call graph. By combining information in the two diagrams, it is
possible to identify the parts of the software that may cause safety risks.
When using only the fault tree, it is common to include the conditions of method calls in
the diagram. However, when applying both fault trees and annotated call graphs, one
should avoid multiplying the information that is stored in them. The annotated call graph
stores information about the method calls and their conditions. Such information should
be removed from the fault tree, thus making the latter more compact and readable. In
addition, the fault tree is constructed for every failure mode. The annotated call graph, on
the other hand, is constructed only once. This means that moving information from the
fault tree to the call graph might save time in the safety analysis.
Further Work
45
11 FURTHER WORK
11.1 EXTENSION TO C/C++
There is at least one important reason to extend Annotert Kallgraf to accept C and C++
code. Still, little safety critical code is written in Java, while much is written in C or C++.
This was, however, not very important for us, since we have focused on the use of
annotated call graphs in testing, and not so much its use in safety analysis.
11.1.1 The C Programming Language
C is not object-oriented. The programmer can declare data types by using the keyword
struct. However, these constructs do not allow the use of inheritance. In addition, the
use of struct is not mandatory. The programmer may choose not to use these
constructs, and it will still be a syntactically correct C program. This has the following
consequences:
• If the program does not contain any data types, there is no need for a class
hierarchy graph.
• If the program does contain the declaration of data types, the structure of the class
hierarchy graph is changed. The class hierarchy graph can only show the data types,
but not the inheritance relations between them, as inheritance is not allowed.
11.1.2 The C++ Programming Language
C++ is object-oriented, and resembles Java. The main difference is that C++ allows
multiple inheritance. In addition, C++ is not as strictly object-oriented as Java. In Java, any
function must be declared inside a class, whereas in C++ a function might be declared
without being connected to a class. This has the following consequences:
• The class hierarchy graph must be a graph, and not a tree, as in the case of Java. In
Java, the class hierarchy graph is a tree, because any class can only have one parent.
• In some cases, no object is connected to a method invocation. In Java, this is
mandatory.
11.1.3 Changes Needed for Extension to C/C++
In order to extend the system to allow analysis of C/C++ - files, the following changes
must be made:
• A new parser must be generated for each of the new languages. This can be done
by using the parser generating tools JLex [10] and Java CUP [11]. In addition, the
algorithm that generates the call graph (implemented in GraphInterface.java) must
be changed. This algorithm must check the types of files that are to be parsed, and
use the appropriate parser. If the files are C++ source code files, then the
algorithm must choose the C++ parser, etc.
• The algorithm that generates the call graph (implemented in GraphInterface.java)
must be changed. The current implementation requires an object-oriented language.
The class that stores information about the method declarations
(Graph/CallGraph/CGMethodDeclaration), has a field called classname. In
C/C++, this field might have the value null.
Further Work
46
11.2 EXTENSION TO TEST PATH COVERAGE
In order to implement this, it is necessary to change the calculation of the test coverage. In
the current implementation, this calculation only counts the number of relevant edges in
the graph. Instead, one has to calculate the number of paths that are followed by exposing
the system to a certain set of test data. However, some parts of the algorithm described in
section 7.3.5 can still suffice. We believe that it is essential to find the leaf vertices of the
graph, because any path has to end in a leaf vertex. In our implementation, we find one
path connecting a leaf vertex and the main method. However, several different paths might
connect a leaf vertex and the main method. A test path coverage algorithm has to consider
all such paths, and not only one. In addition, the algorithm has to stop when all such paths
have been traversed. Our algorithm now stops when all edges have been traversed at least
once.
11.3 OTHER EXTENSIONS
11.3.1 Expanding and Collapsing Vertices
A problem with call graphs in general is complexity. For any system of some size, the call
graph will be more confusing than informative. By introducing conditions into the call
graph, the complexity has increased further. In [1], some usability considerations for call
graph generation tools are presented. One of the considerations is “[…] to provide
expanding or collapsing, subtree focusing or hiding, for the users to control the complexity
of the focused information.”
In Annotert Kallgraf 1.0, no such functionality is implemented. This is also the largest
weakness of the application, since positioning and drawing the complete call graph of a
relatively large program is time consuming. By introducing the possibility to expand or
collapse vertices, this can be remedied. One might for example only display the number of
vertices that is necessary to fill the drawing surface. The user selects which invocations to
investigate further by clicking on a vertex to expand it and reveal further invocations.
11.3.2 Rapid Type Analysis
When finding the object types in the call graph, there are three approaches. We illustrate
the differences between these three approaches with example 10.
10 Example
The program has the following class structure:
59
60
61
62
63
class SuperClass extends Object
{
public void draw() {}
}
class SubClass extends SuperClass{}
The main method is implemented as follows:
64 public static void main()
65 {
66
SubClass sub = new SubClass();
67
sub.draw();
68 }
Further Work
47
These are the different approaches:
1. The naive approach. This means replacing the name of the object with its type, without
checking whether the type is implementing the method. In the example above, this
would mean replacing sub with its type (SubClass) in the method invocation draw.
The problem is that SubClass does not have an implementation of the method draw.
Therefore, using this approach introduces errors in the call graph.
2. The class hierarchy graph analysis approach. In practice, this means searching in the
class hierarchy graph until one finds a superclass that implements the method. In the
example above, one would replace SubClass with SuperClass, because this is the
class that implements the draw method.
3. Rapid Type Analysis [13]. This is a type of analysis that removes certain edges from the
call graph by considering the set of instantiated types. If a type is never instantiated, the
methods from this type will not be called. RTA is an extension to class hierarchy graph
analysis, and it requires the class hierarchy graph in order to work.
11.3.3 Reliability
The system can be extended to automatically generate the reliability measures described in
section 10.1. However, this is a rather simple task. When calculating the Henry and Kafura
coefficient, one problem is to supply a length measure for every method. This measure can
either be calculated by the system or supplied by the user. In case of the Cheung
coefficient, the problem lies in supplying the reliability values for each method. The user
might provide these values to the system.
Bibliography
48
12 REFERENCES
[1]
[2]
[3]
[4]
[5]
[6]
[7]
[8]
[9]
[10]
[11]
[12]
[13]
[14]
[15]
Xie, T., Notkin, D.
An Empirical Study of Java Dynamic Call Graph Extractors
University of Washington, Department of Computer Science & Engineering
Bairagi, D., Kumar, S., Agrawal, D. P.,
Precise Call Graph Construction for OO Programs in the Presence of Virtual
Functions. Proceedings of the International Conference on Parallel Processing, p 412-416,
Bloomington USA, Sep. 11-15 1997
Stålhane, T., Juul Wedde, K.,
Safety Validation with Focus on Testing.
SINTEF Telecom and Informatics
Sugiyama, K., Tagawa, S., and Toda, M.
Methods for visual understanding of hierarchical systems.
IEEE Trans. Syst. Man Cybern., SMC-11(2):109-125, 1981
Burns and Wellings.
Real-Time Systems and Programming Languages,
Harlow: Addison-Wesley, 1997, Second Edition.
Sommerville, I.
Software Engineering
Harlow: Addison-Wesley, 1995, Fifth Edition.
Cheung, R.C.
A User-Oriented Software Reliability Model
IEEE Transactions on Software Engineering, Vol. SE-6, No 2, March 1980
Rausand, M.
Risikoanalyse – veiledning til NS 5814
Tapir, 1991
Ma, W.
GDC: A Graph Drawing Application With Clustering Techniques
(Master Thesis, University of Alberta, Department of Computing Science, 2001)
JLex: A Lexical Analyzer Generator for Java™
http://www.cs.princeton.edu/~appel/modern/java/JLex/
CUP Parser Generator for Java
http://www.cs.princeton.edu/~appel/modern/java/CUP/
Java Development Kit, version 1.3.1 and 1.4.0
http://java.sun.com/products/archive/index.html
http://java.sun.com/j2se/1.4/download.html
Rayside, D., Reuss, S., Hedges, E., Kontogiannis, K.,
The Effect of Call Graph Construction Algorithms for Object-Oriented Programs
on Automatic Clustering.
Proceedings of the 8th International Workshop on Program Comprehension, p 191-200,
Limerick, Ireland, June 10-11 2000
What Is a Graph [online]
University of Wisconsin-Stout
http://www.mscs.uwstout.edu/~wuming/Graph2/WuWhatIsGraph.htm
[accessed 20.05.02]
Cs3133 Lecture 11 – Trees [online]
Columbia University
http://www.cs.columbia.edu/~novik/cs3133/notes/lect11.html
[accessed 20.05.02]
Bibliography
49
13 BIBLIOGRAPHY
[16]
[17]
[18]
[19]
[20]
[21]
[22]
[23]
[24]
[25]
[26]
[27]
[28]
[29]
Stålhane, T.,
Fault Tree Analysis as a Tool for Software Safety and Reliability.
Conference Proceedings, Second European Conference on Software Quality Assurance, Oslo
Norway, May 30 – June 1 1990
Ryder, B. G.,
Constructing the Call Graph of a Program.
IEEE Transactions on Software Engineering, Vol. SE-5, No. 3, 1979
Stålhane, T., Juul Wedde, K.,
Modification of Safety Critical Systems: An Assessment of Three Approaches.
SINTEF Telecom and Informatics
Stålhane, T., Øvsteland, E. Ø.,
Safety Assessment For a Positioning System.
SINTEF-DELAB
Murphy, G. C., Notkin, D., Lan, E. S.-C.,
An Empirical Study of Static Call Graph Extractors.
ACM Transactions on Software Engineering and Methodology, Vol. 7, No. 2, 1998
Antoniol, G., Calzolari, F., Tonella, P.,
Impact of Function Pointers on the Call Graph.
Proceedings of the Euromicro Conference of Software Maintenance and Reengineering, p 51-59,
Amsterdam Netherlands, Mar. 3-5 1999
Grove, D., DeFouw, G., Dean, J., Chambers, C.,
Call Graph Construction in Object Oriented Languages.
Proceedings of the Conference on Object-Oriented Programming Systems, Languages, and
Applications, p 108-124, Atlanta GA USA, Oct 5-9 1997
Grove, D., Chambers C.,
A Framework for Call Graph Construction Algorithms
This paper has been accepted for publication in ACM TOPLAS. An earlier version
was published as IBM Research Report 21699 (97756) 22 March 2000.
Bacon, D. F.
Fast and Effective Optimization of Statically Typed Object-Oriented Languages
Report No. UCB/CSD-98-1017, December 1997, Computer Science Division
(EECS)
University of California, Berkeley, California 94720
Reingold, Tilford
Tidier drawing of trees,
IEEE Transactions on Software Engineering SE-7 (2) (1981), p 223-228
Wetherell, Shannon
Tidy drawing of trees,
IEEE trans SW Engineering, SE-5 (5) (1979), p 514-20
Sethi, R.
Programming Languages – Concepts and Constructs
Addison-Wesley, 1997, Second Edition
Walker
A node-positioning algorithm for general trees,
Software practice and Experience 20 (7) (1990), p 685-705
Ammeraal, L.
Computer Graphics for Java Programmers
John Wiley & Sons,1998
Glossary
50
14 GLOSSARY
Class hierarchy tree
The class tree is found in the left split pane and contains all the classes in the analysed files.
Every class has its own node in the tree and two children. The first child contains a list of
the member variables in the class. The second contains a list of all member methods.
Cyclomatic Complexity
The cyclomatic complexity [6], CC, of any flow graph G may be computed according to
the following formula:
CC(G) = Number(edges) – Number(vertices) + 1
The term was introduced by McCabe in 1976 and is used to discover the number of
independent paths in a program by the use of the flow graph.
HazOp
HazOp is short for Hazard and Operability analysis [8]. It is way of formally identifying
potential safety risks that might occur during the execution of a technical system. The
HazOp process is performed by a group of people, who investigate the system in a series
of meetings. The output of the HazOp process is a table displaying the different safety
risks and their consequences.
Look and feel
Look and feel is the visual appearance of an application. When developing Java
applications you can choose which look and feel to use. If you choose the system’s look
and feel, the same application will change visual appearance according to which platform it
runs on. In Windows it will look like other standard Windows applications, but in Unix it
will look like other Unix applications. Java also has its own look and feel, which will remain
the same on all operating systems.
Scroll bars
If an object is too big to fit in a window, scroll bars are implemented to allow the user to
access the complete object. Both graphs and the class hierarchy tree are placed within scroll
bars, which automatically will be shown when needed.
Split pane
The main window of the application is split in half by a horizontal bar. To the left of this
bar, in the left split pane, the class tree is found. In the right split pane the call- and class
hierarchy graphs are found (see figure 20).
Left
split
pane
Menu and toolbar
Right split pane
Figure 20: The layout of the application showing the splitpane
Appendices
51
15 APPENDIX A
15.1 SYSTEM TEST ACCORDING TO TEST PLAN
During the work on the requirements specification for Annotert Kallgraf, we developed a
test plan. The test plan was designed to test all the functional requirements of the finished
system. In this chapter we present the test and the results.
15.1.1 The Test Plan
Introduction
In this section we describe how the system can be tested in compliance with the
requirements stated in the requirements specification, section 5.
Functional Testing
T-F-1 Give a Java file as input and evaluate the result presented by the system
T-F-2 Give more than one file as input and evaluate the results
T-F-3 Ask the system for test data for a Java program, and check manually if the
presented results are correct
T-F-4 Calculate the test coverage thoroughness manually with the given test data, and
compare this to the results presented by the system
T-F-5 Give a Java program with conditional method calls as input to the system, and
check the results manually
T-F-6 Give a Java program with calls to standard Java methods as input to the system,
and evaluate the results
T-F-7 Turn the “see standard Java methods”-function in the system on and off
T-F-8 Check the system’s feedback when it is working
T-F-9 Evaluate whether the system has a graphical user interface
T-F-10 Try to zoom in on a call graph
T-F-11 Try to zoom out on a call graph
T-F-12 Try to give the system a non-java file as input, and evaluate the results
T-F-13 Ask the system to present a Class Hierarchy Graph
T-F-14 Check manually if the name of the class the method is called for is presented and
correct
T-F-15 Give a Java-file with several calls to the same method as input. Check if every
method only is presented once in the call graph
T-F-16 Try to navigate horizontally in the call graph
T-F-17 Try to navigate vertically in the call graph
T-F-18 Give a program with a method that calls the same method several times as input,
and check if the calls are only presented once in the call graph
T-F-19 Try to select one part of the graph and print it, and check if the printed graph
reflects the chosen part of the call graph
T-F-20 Print a call graph that does not fit on a single page and evaluate the results
T-F-21 Evaluate if the system has a Windows based user interface
15.1.2 System Test
In the following test we used a small Java program. The program is given in example 11,
and consists of two different files, Main.java and AnotherClass.java.
Appendices
52
11 Example
Main.java
69 public class Main extends Object
70 {
71
public static void main(String args[])
72
{
73
AnotherClass ac = new AnotherClass();
74
int i = 1;
75
76
if(i > 0)
77
System.exit(0);
78
else
79
ac.exit();
80
}
81 }
AnotherClass.java
82 public class AnotherClass
83 {
84
public AnotherClass()
85
{
86
System.out.println("Opprettet klasse");
87
System.out.println("Konstruktør ferdig");
88
}
89
90
public void exit()
91
{
92
System.exit(0);
93
}
94
95
public void count(int i)
96
{
97
i++;
98
}
99 }
ST-F-1 When given a Java-file as input, the system generates a call graph and a class
hierarchy graph. Methods that are not invoked are drawn as vertices without
edges. AnotherClass.java resulted in the call graph shown in figure 21.
Figure 21: Call graph for AnotherClass.java
Appendices
53
ST-F-2 The system generates one call graph and one class hierarchy graph for all the files.
Methods that are not invoked are drawn as vertices without edges. The call graph
for both the files in Example 11 is shown in figure 22.
Figure 22: The call graph for AnotherClass.java and Main.java
ST-F-3 The system can generate test data for simple code. The generated test data for
Main.java is shown below:
Forslag til testdata for Main
----------------------------Betingelse: else(i<0)
i = -1
Dekningsgrad: 33.0 %
Appendices
54
Betingelse: if(i>0)
i = 42
Dekningsgrad: 33.0 %
We see that the generated test data are correct for the example. The test data
generator cannot handle complex cases, e.g. method-calls within conditions.
ST-F-4 The test code coverage for AnotherClass.java must be 66% since the constructor
always is invoked, and either the second or the third method invocation will take
place. As we can see from the previous example, the calculated test code coverage
was not correct. However, if we remove the constructor invocation, the
generated test code coverage is calculated to be 50%, which is correct.
ST-F-5 The system shows the conditions for method call inside a grey-coloured hexagon,
as shown in figure 22. If-then-else constructions have their own vertex and all the
parts of the construct is shown below in the graph.
ST-F-6 The system is able to tell standard Java-methods from other methods (see ST-F7), but they are not visually different from the defined methods.
ST-F-7 There are two standard Java-methods in the example with both classes (figure
22). By de-selecting “Vis standard Javametoder” on the “Verktøy”-menu, they
both disappear from the call graph, but the defined methods remain visible, as
shown in figure 23.
Appendices
55
Figure 23: Call graph for AnotherClass.java and Main.java without standard Java-methods
ST-F-8 When a new analysis is started, two progress bars, showing the progress of the
analysis, are presented to the user, see figure 24.
Figure 24: The progress dialogs shows information about the current state of the application
Appendices
56
ST-F-9 The system has a graphical user interface
ST-F-10 By clicking on the zoom-in icon or selecting “zoom inn” on the “Verktøy”-menu,
the graphs are enlarged.
ST-F-11 By clicking on the zoom-out icon or selecting “zoom ut” on the “Verktøy”menu, the graph size is reduced.
ST-F-12 When trying to analyse a .txt-file, the system generated the following message in a
message box: “Ingen Java-filer valgt”.
ST-F-13 The class hierarchy graph of the analysed files is presented by default; there is no
need for the user to ask the system to present it.
ST-F-14 The system presents the name of the class the method is called on behalf of. In
the example presented above, AnotherClass.exit() is displayed in the graph,
and not ac.exit() which is written in the code.
ST-F-15 From the code in example 11, we see that there are two calls to
System.out.println(), but there is only one such vertex in the graph
(figure 23).
ST-F-16 It is possible to scroll horizontally in the graph, if the graph is too wide for the
window.
ST-F-17 It is possible to scroll vertically in the graph, if the graph is too high for the
window.
ST-F-18 There are two calls to System.out.println() in the test example, but only
one edge showing the call.
ST-F-19 We marked a part of the graph, and chose to print it. The printout showed
exactly the area we marked. We also saved the graph as a jpeg-image with parts of
it selected and the result is shown in figure 25.
Appendices
57
Figure 25: A selected part of the graph saved
ST-F-20 When printing a large graph, the graph was printed over several pages. Some of
the pages were blank, but the whole graph was printed.
ST-F-21 The system has got a Windows-based user interface.
Appendices
58
16 APPENDIX B
16.1 KNOWN PROBLEMS
In this section we present some shortcomings and problems in Annotert Kallgraf version
1.0.
16.1.1 Grammer/Parsing
Arrays
The brackets must be placed after the variable name, e.g. int array[], and not int []
array. Both are allowed in Java, but the second will cause parse error in Annotert
Kallgraf.
Switch-statements
Support is not implemented
Do-while
Support is not implemented
Comments
Using the comment construction:
/*******COMMENT******/
causes severe problems.
The use of one such comment line (a string with several stars on both sides) will be parsed
as the start of a comment. This means that all code between two such lines will not be
parsed, and any method invocation will be ignored. One such comment line outside a
method (or another block) and one inside will cause a parse error, due to a missing brace ({
or }).
Special characters
The use of special characters will cause parsing error, e.g. $, @ and #.
16.1.2 Test Data Generation
-
Generates data only for float, int and double variables in conditions
Does not generate data for equality expressions (==), and inequality
expressions(!=)
Problems generating data for if-then-else with small changes in variables. The test
data generator increments/decrements variable values by 1.0 when trying to fulfil
conditions. When an increment/decrement of less than 1.0 is needed, as in example
12, the test data generator enters into an eternal loop.
12 Example
100
101
102
103
if(a > 0.2)
System.out.println();
else if (a > 0.1)
System.out.println();
Appendices
59
104
105
-
else
System.out.println();
Calculates the test coverage correctly only in basic examples
16.1.3 User Interface
-
Problems previewing and printing large graphs (due to “out of memory exception”
in the Java virtual machine)
Problems saving large graphs as images (due to “out of memory exception” in the
Java virtual machine)
Positioning of large graphs is very time consuming and the system seems to “hang”
during this operation
Using the Java look and feel and JDK version 1.4.0 will cause exception during
saving of an open analysis (probably a bug in Java and not the application).
Appendices
60
17 APPENDIX C
17.1 IMPLEMENTATION OF THE REQUIREMENTS SPECIFICATION
In this chapter we present a table that shows which classes that implement the functional
requirements presented in section 5.1. The table may be subject to discussion because of
dependencies among classes. For example, requirement F-16 states that it must be possible
to navigate horizontally in the call graph. This requires that the call graph already exists, but
the classes responsible for this part of the system are not checked in the table. In general,
we have checked those classes that are most important in fulfilling the given requirement.
The parsing package is fundamental, and most functionality requires all these classes.
In the top row, the number of the functional requirement is found. The first column shows
the packages and all their classes.
1
Parsing
Yylex
PTParser
PTNode
PTUnaryNode
PTBinaryNode
PTTrinaryNode
PTCompilationUnit
PTTypeDeclarations
PTClassDeclaration
PTMultipleModifiers
PTModifier
PTClassBodyDeclarations
PTFieldDeclaration
PTVariableDeclarators
PTIdentifier
PTMethodHeader
PTConstructor
PTInnerClassDeclaration
PTMethod
PTMethodInvocation
PTArgumentList
PTIfThenStatement
PTIfThenElseStatement
PTForStatement
PTWhileStatement
PTMethodDeclaration
PTBlockStatements
PTLocalVariableDeclaration
PTBinaryExpression
PTUnaryExpression
PTBlock
PTCatchClauses
PTCatchStatement
PTConstants
PTConstructorDeclarator
PTConstructorInvocation
PTFormalParameter
PTFormalParamList
PTLiteral
PTQualifiedName
x
x
x
x
x
x
x
x
x
x
x
x
x
x
x
x
x
x
x
x
x
x
x
x
x
x
x
x
x
x
x
x
x
x
x
x
x
x
x
x
2
3
4
1
3
1
4
X
X
X
X
X
x
x
x
x
x
x
x
x
x
x
x
x
x
x
x
x
x
x
x
x
x
x
x
x
x
x
5
6
x
x
x
x
x
x
x
x
x
x
x
x
7
8
9
1
0
1
1
1
2
x
x
x
x
x
x
x
x
x
x
x
x
1
5
1
6
1
7
1
8
1
9
2
0
2
1
Appendices
PTTryCatchStatement
PTVariableInitializer
PTDeclarator
Visualization.Algorithms
ALGOSugiyama
ALGODoubleArraySorter
Visualization.GUI
GUIAboutDialog
GUIAppFrame
GUIClassListDialog
GUIDialog
GUIDrawGraph
GUIDrawCallGraph
61
1
x
x
x
2
3
4
6
7
8
9
1
0
1
1
1
2
1
3
1
4
1
5
1
6
1
7
1
8
1
9
2
0
2
1
x
x
x
x
x
x
x
x
x
x
x
x
x
x
GUIDrawClassHierarchyGraph
GUIExitListener
GUIGraphs
GUIHelp
GUIImageToClipboard
GUIIntFrame
GUIMenuAndToolBar
GUIOpenFileDialog
GUIPrintPreview
GUIProgressDialog
GUISetLookAndFeel
GUISplashWindow
GUITestDataDialog
GUITextFilter
PackageInterfaces
GraphInterface
VisualInterface
Graph
Vertex
GraphInformation
Edge
Graph.ClassHierarchyGraph
CHGClassNode
CHGMemberVariable
CHGMethod
CHGConstructor
CHGGraph
Graph.CallGraph
CGCallGraph
CGMethodInvocation
CGConditionVertex
CGInvocationVertex
CGFormalParameter
CGConditionString
CGConditionParser
CGLocalVariable
The Util Package
UTILVariableStack
UTILNodeVector
5
x
x
x
x
x
x
x
x
x
x
x
x
x
x
x
x
x
x
x
x
x
x
x
x
x
x
x
x
x
x
x
x
x
X
x
x
x
x
x
x
x
x
x
x
x
x
x
x
x
x
x
x
x
x
x
x
x
x
x
x
x
x
x
x
x
x
x
x
x
x
x
x
x
x
x
x
x
x
x
x
x
x
x
x
x
x
x
x
x
x
x
x
x
x
x
x
x
x
x
x
x
x
x
x
x
x
x
x
x
x
x
x
x
x
x
x
x
x
x
x
x
x
x
x
x
x
x
x
x
x
x
x
x
x
x
x
x
x
x
x
x
x
x
x
x
x
x
x
x
x