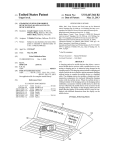
1
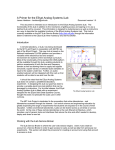
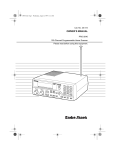
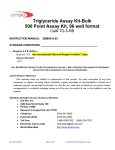
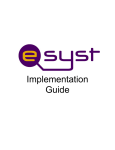
AC 2012-4608: AN IMPROVED OPERATIONAL AMPLIFIER ILAB WITH
A MORE REALISTIC LOOKING INTERFACE
Mr. Babatunde Isaac Ishola
Mr. Olawale Babatunde Akinwale, Obafemi Awolowo University
Prof. Lawrence O Kehinde P.E., Obafemi Awolowo University, Ile-Ife, Nigeria
Professor Kehinde has been a Professor of Electronic and Electrical Engineering at the Obafemi Awolowo
University, Ile-Ife, Nigeria since 1988. He was the Director of ICT as well as the founding Principal
Investigator of the University’s iLab group in collaboration with MIT, USA. Currently he coordinates a
State Research and Educational Network. His present work includes developing virtual and remote labs
for students’ experimentation. He just concluded a 3-year visiting Professor job at the Texas Southern
University, Houston.
Dr. Kayode Peter Ayodele
Mr. Oluwapelumi Olufemi Aboluwarin
c
American
Society for Engineering Education, 2012
AN IMPROVED OPERATIONAL AMPLIFIER ILAB WITH A
REALISTIC LOOKING INTERFACE
Abstract
Realistic interfaces for iLab-based operational amplifier experiments have previously been
reported. Motivated by experiences and students' feedback gathered in the past, an even more
realistic interface for op-amp experimentation using iLab technology is hereby presented.
The emphasis in the current work was on the design of a new client and consequently, the system
under test (SUT) remains largely unchanged from previously-reported iterations of the lab. The
only notable exception is that in the current SUT, the operational amplifier circuit also allows the
construction of a difference amplifier. As before, remote configurability and data acquisition are
achieved through a 100-channel switch array and a NI USB-6251 DAQ card controlled by the
experiment engine respectively.
The realistic-looking interface of the circuit is implemented using Adobe Flex technology. It
utilizes a metaphor fabricated around realistic images of the breadboards, electronic components
and instruments. To allow the flexibility available in a real lab where students can utilize an
arbitrary set of breadboard nodes in wiring up a particular circuit, the client utilizes a depth-firstsearch algorithm to construct circuits from an arbitrary number of student node-to-node
connections. An attempt was made to prevent student disorientation by employing the use of
intuitive control actions to zoom and pan the view, as well as hide interface elements as desired.
Lab assessment was done in two phases. First, a questionnaire was administered to students after
using the lab. Their responses were compared with those for a previous generation of the
operational amplifier lab. Secondly, a small study was carried out to verify a previous argument
that realistic interfaces improved students’ laboratory experience. The results of the study are
discussed and attempts are made to extend the implications to other remote laboratories.
Furthermore, the performance of the LabVIEW dll approach to experiment control is compared
with a previous approach using the NI DAQmx library.
Keywords
iLab, Adobe Flex, operational amplifier, realistic interface, RIAs, DFS
I.
Introduction
Physical experiments are indispensable for developing skills to deal with physical processes and
instrumentation 1. Experimentation has therefore long been an integral part of engineering
education, due to the fact that it bridges the gap between theoretical and practical knowledge.
Students perform experiments to verify the theories taught in class and ultimately relate the
laboratory and real-world experience. The latter is crucial to a student of engineering as he must
be able to identify and operate equipment relevant to his discipline. The use of traditional
laboratories in curricula however presents educators with unique attendant challenges. Notable
among these is the chronic underfunding of higher institutions of learning particularly in
developing countries such as Nigeria4, 14. This is compounded by the rising cost of laboratory
equipment and increasing student enrollment, which implies an increase in the amount of
laboratory space required to handle the large student populations. Furthermore, some items of
equipment are so sensitive and expensive that they cannot be made available to large student
classes, for fear that they would rapidly be damaged.
Alternative mechanisms for delivering student laboratory experiences, such as Computer Aided
Design (CAD) or Electronic Design Automation (EDA) software, simulations, and remote and
virtual laboratories 8 have been explored to overcome these difficulties. Remote laboratories in
particular have benefitted from some attention from educators and engineering education
researchers because of some advantages they possess 8, 12.
One of the remote laboratory frameworks is the MIT iLab shared architecture, which provides a
suite of software tools that serve as a framework for quick and easy laboratory development and
deployment. It hides the details involved in network communication from the developer and
provides robust infrastructure for administration and storage which lets the developer focus on
the actual experimentation setup. The iLab topology is three-tiered and includes the Lab Client,
Service Broker and the Lab Server 2, 3, 6, 7. The Lab Client is a software application that runs in a
browser. It provides an interface that allows the user to interact with the remotely located
laboratory equipment. The Service Broker is a web application that takes care of the
communication between the Lab Server and the Lab Client. In other words, all communication
between the Lab Client and the Lab Server is through the Service Broker. The Lab Server is
remote computer that interacts with hardware equipment that executes the experiments
forwarded to it from the lab client. A number of iLabs have been developed and deployed both in
and outside of MIT 2, 3, 7, 9.
This paper presents a new version of the operational amplifier iLab (“OpAmp iLab”) developed
at Obafemi Awolowo University (OAU), Nigeria 5, 7. The lab was originally developed for use in
an introductory course on operational amplifiers for third-year students of Electronic and
Electrical Engineering in the university, but has been used by other groups of students. It allows
students to investigate the properties of the different configurations of an operational amplifier.
While both previous iterations of the lab were enthusiastically received by students, it was
necessary to develop a new version to address three issues. Firstly, one of the major complaints
Nigerian educators have about the use of remote laboratories is that such labs allegedly cannot be
effective in getting students to really understand laboratory apparatus because they do not offer
student any kinaesthetic stimulation. While there is some basis to the concern of such educators,
a previous study indicated that creative use of realistic interface metaphor could help in giving
students a laboratory experiences closer to that of a real lab 5. Consequently, the first reason for
the new iteration of the OpAmp iLab was to provide an interface metaphor that is more similar to
what a student might encounter in a real lab. Secondly, this iteration was developed to provide
students with more circuit design flexibility than the previous two iterations. Both previous
iterations featured fixed sets of nodes and circuit branches. All that the student using either
design needed to do was to determine which branches to add or remove from the circuit. Such an
artificial constraint is not experienced in a real-life lab. Finally, the new design provides a
backend circuit that is much easier to expand and therefore more engaging for the students.
In this paper, we first provide a brief sketch of the first two generations of the OAU OpAmp
iLab so as to allow easy contrast of their features with those of the new version. We then
describe the architectural features of the new iteration. Subsequently, a detailed discussion of the
use of the new lab in a sample student experimentation session setting is undertaken. The paper
then details an account of the use of the lab in a credit awarding course, as well as the results of
the assessment of students’ use of the lab.
II.
Previous Generations of the OAU OpAmp iLab
The first generation of the OpAmp iLab 7 offered an interface where students modified an
existing operational amplifier circuit by drawing wires to connect a small set of pre-positioned
nodes (Fig 1a). The interface was implemented as a C# browser control.
The back-end system under test (SUT) was a dozen-impedance operational amplifier circuit 13
mounted on a National Instruments Educational Laboratory Virtual Instrumentation Suite (NI
ELVIS) prototyping board. Input signal generation and data acquisition was achieved through
the NI DAQmx signal processing library and an NI 6251 data acquisition card. The iLab was
severely crippled because the version of NI DAQmx available at the time throttled available data
acquisition bandwidth whenever simultaneous input and output operation were attempted. Hence
the lab could not generate input signals faster than 16 Hz for the operational amplifier circuit
while simultaneously sampling the output. The resulting output signals were plotted on a graph
using volt-per-division and timebase calibrations similar to a real oscilloscope as shown in
Fig.1b.
(a)
(b)
Fig. 1: Interface of the first generation OpAmp iLab showing (a) the circuit connection window
(b) the signal window showing input and output waveforms
The next version of the OpAmp iLab used an Adobe Flash based client 5. The use of a 2D vectorbased client provided more flexibility than C# (used in the first interface) and allowed the
representation of the backend as a printed circuit board (PCB) on which various components of
the circuit were laid out (Fig. 2a). The lab used a modified version of the MIT iLab architecture.
The Flash OpAmp iLab omitted the Service Broker, thus allowing direct client-to-server
communications using web services. The block diagram of the Flash OpAmp iLab is presented
in Fig. 2b. Like its predecessor, the lab server used a dozen impedance operational amplifier
circuit mounted on a NI ELVIS board and NI DAQmx library for data acquisition and signal
processing.
(a)
(b)
Fig. 2: (a) Client interface of the Flash OpAmp iLab5 (b) Block diagram of the Flash OpAmp
iLab5
III. The Improved Operational Amplifier iLab
Based on the responses of users of the previous implementations of the OpAmp iLab and the
result of the previous study on the effect of interfaces 5, 7 an improved version of the OpAmp
iLab has been developed.
The new OpAmp iLab utilizes the complete MIT iLab architecture, as shown in Fig. 3
Lab Server
Service Broker
Lab
Device
Experiment
Execution
Engine
LS Web
Service
Internet/
Intranet
Batched iLab SB
Lab Client
Internet/
Intranet
Built with
Adobe Flex
Switching
service
(web service)
Lab Server Database
Switch
Matrix
Service
Broker
Database
Fig. 3: The improved version of the OpAmp iLab utilizing the complete MIT iLab Architecture
The Lab Client
The Lab Client was developed with Adobe Flex 3.0, a framework for developing rich internet
applications (RIA). Adobe Flex was chosen for the interface because Flex controls are rendered
in browsers as Adobe Flash movies, and more than 99% of the computers on the Internet already
have the necessary plugin 11. The interface (shown in Figures 8-12) presents the picture of a
breadboard with components mounted on it and allows the student to set up any of the
operational amplifier configurations by drawing wires to connect components on the breadboard.
The components include an operational amplifier integrated circuit (IC), colour-coded resistors,
and connecting wires. The interface also includes the picture of a function generator and
oscilloscope that that allows the control of the remote equipment by operating the controls
(knobs and buttons) on the client virtual interface. Hence a student who wants to use the lab must
know how to set up an operational amplifier circuit, use a datasheet, understand resistor colourcoding, and use a breadboard, function generator and an oscilloscope. This interface is a closer
approximation to a real-life laboratory experience, where students interact not with schematics,
but with the real components.
As mentioned, one of the objectives was to provide students with flexibility in the choice of
nodes on the breadboard to utilize in completing a connection. To deal with this complexity, the
Depth First search (DFS) algorithm was employed to search through the connection matrix and
determine if a start node (root node) is ultimately connected to another node (goal node). In the
DFS implementation algorithm, DFS was used to search through an array of points that have
been connected. Since DFS is used to search a tree structure, the array (created on connecting
one node to another) is first converted into nodes, which are then used in the search. The method
for searching the tree structure takes two arguments; the two arguments of the method are objects
of the node class and they specify the two nodes we want, to determine their connectivity.
The System under Test
The SUT represented by the interface is a reconfigurable operation amplifier circuit as shown in
Fig. 4. It is capable, depending on switches closed/opened, of implementing four different
operational amplifier circuits mounted on the NI ELVIS experimentation board. Table 1 shows
position of switches for the four experiments. The student never sees an actual switch depicted
on the interface. Instead, by dragging across two breadboard holes of interest, the student can
“connect” two nodes. Once the all nodes are connected, the client computes the corresponding
switch pattern using the DFS algorithm. For example, Fig. 5 shows the configuration for an
inverting amplifier on the lab client interface as connected by a student during a typical lab
session. This is realized on the lab server by closing, switches 1, 3, 4, 6 in Fig. 4 while other
switches are opened.
Fig. 4: A reconfigurable operational amplifier circuit that implements four op-amp
configurations
Table 1: Switching Table for four experiments
Switch Conditions
Experiment
S1
S2
S3
S4
Inverting Op-Amp
close open close close
Non-Inverting Opclose open close open
Amp
Unity Gain Op-Amp open close open open
Differentiator
close open close close
S5
open
S6
close
S8
open
S9
open
S10
open
close open
close open
open
open
open
open
close open open open
open close close close
open
open
S7
open
Fig. 5: An inverting operational amplifier as connected by a student
Signal acquisition and processing was achieved through the NI USB-6251 DAQ card connected
to NI ELVIS experimentation board on which the operational amplifier circuit was set. It was
controlled by the experiment execution engine; a C# program that controls the execution of
experiment by selecting experiment specification from an MS-SQL database, forwarding it to the
laboratory device for execution and a purpose-built LabVIEW dynamic link library (dll) that
serves as the entry point to the NI ELVIS experimentation board. The remote re-configurability
of the op-amp circuit was achieved through a switching matrix using an NI SCXI 1169 100channel single–pole-single-throw (SPST) switch array and a web service that allows the switches
in the array to be remotely controlled. The switching matrix web service, implemented in
Microsoft.Net Framework, controls the NI 1100 chassis which houses the NI SCXI 1169 and in
turn switches on the desired switches to configure the circuit.
Lab Server
Fig. 6 shows a pictorial representation of the lab server and shows how it interacts with the SUT
and other hardware. The experiment engine polls the lab server database for new experiment.
When an experiment has been submitted to the lab server for execution, the experiment engine
loads the next experiment on the MS SQL database based on the priority, and forwards the
experiment configuration to a Microsoft.Net switching matrix web service used to implement the
remote re-configurability of the op-amp circuit. This in turn closes the required switch to form a
particular operational amplifier circuit configuration. Once the circuit is set, the experiment
engine sends the signal configuration received from the lab client through the purpose built
LabVIEW dll to the NI USB 6251 connected to the NI ELVIS workstation which executes the
experiment. The output of the system is sent through the same channel back to the experiment
engine which inserts the result into the MS SQL database. The result when requested by the lab
client is used to plot the output waveform on the virtual oscilloscope.
Fig. 6: Pictorial representation of the Lab Server showing how the various components are
connected
a.
LabVIEW dll
The SUT was mounted on the NI ELVIS which is used for the signal acquisition and processing.
NI ELVIS hardware is controlled by LabVIEW, a software suite also from National Instrument.
The lab client was however not designed with LabVIEW. Therefore, to enable the experiment
engine written in C# to control the LabVIEW VI, the VI was converted to a dll function and
exported into C# so that the VI can be controlled using a C# method call. The LabVIEW dll
approach made it possible to process signals of frequencies ranging from 5Hz to 250kHz (which
is the same frequency range supported by NI ELVIS function generator 10) as against the NI
DAQmx approach which could only process signals between 0Hz to 16Hz.
b.
Switching Matrix (NI SCXI 1169, 1000, DB-50)
The Switching Matrix (see fig. 6) comprises of a matrix of switches controlled over the internet
using web services. It consists of the NI SCI Chassis 1000, NI SCXI 1169, an LFH200 cable and
NI TBX DB-50. The NI SCI chassis houses the NI SCXI 1169 100 SPST switch which is
controlled by a Microsoft.net web service. The switches are controlled based on the arguments of
a method contained in the switching matrix web service implemented with Microsoft.NET C#.
An LFH 200 cable was connected to the NI SCXI 1169 switch matrix to route the signals to the
circuit. NI TBX DB-50 was used between the 1169 and the circuit to help identify the switches
and also to make the circuit a lot neater since a DB 25 connector (which is connected to the
switches) on the circuit can be plugged into the TBX 50.
IV. Using the Interface in a Typical Experimentation Session
To carry out experiments on the OpAmp iLab, a student must log into the Service Broker. If the
student does not already have an account, one must be created. Once the OpAmp iLab client is
launched, most of the student’s laboratory activities would be carried out on one of three screens
(the function generator screen, the breadboard screen or the oscilloscope screen). The sequence
of a student’s activities during a typical experiment session is depicted by a flow chart in Fig. 7.
Fig.7: flow chart showing sequence of a student’s activities during a laboratory session
By far the most time-consuming aspect of working on the client interface is the connection of the
various operational amplifier circuits, which students must carry out by drawing multiple
segments of wires to connect different points on the breadboard. Figs.8a-c, show different node
connection steps a student could go through in configuring an inverting amplifier on his client
computer using the datasheet of the LM741 op-amp IC. Each view indicates the circuit diagram
of an inverting amplifier shown on the interface (Circuit Selector). The student uses this as a
guide to connecting up the correct operational amplifier circuit.
Once a circuit has been constructed, the student must then verify that it is a valid circuit by
clicking the “verify circuit” button. The “run” button, which is used to submit the experiment for
execution, is disabled until a circuit has been verified in this manner. Fig. 9 shows the resulting
screen after the inverting amplifier circuit connected above was verified. The DFS algorithm
reduced the student’s connections to its minimal form and then determines whether it fitted one
of the standard operational amplifier circuits. Figs. 10a-c show some of the errors a student can
encounter when using the lab. Fig.10a. shows a wrong inverting amplifier connection at pin7 of
the LM741. The student has connected Rf and Vout to pin 5 instead of pin6. Hence the “run”
button was not enabled and the experiment could not be forwarded to the lab server for
execution. Fig.10b show a typical error a student can get when he is trying to do something
inappropriate on a breadboard like connecting a wire across the same node or trying to make a
slant connection. Note that a slant connection is not necessarily invalid but unprofessional. Fig.
10c shows what a student gets when the remote lab could not be reached or is unavailable.
Once the circuit is verified, the student can click on the “run” button to submit it for execution.
The client then monitors the server for completion of execution. The student can then go to the
oscilloscope screen to view the output waveform once the results are downloaded. Fig. 11 shows
the oscilloscope displaying the signals from the SUT. The Zoom button toggles zoom-in and
zoom-out effect.
(a)
(b)
(c)
Fig. 8: sample steps in the connection of an inverting amplifier circuit
Fig. 9: screen capture showing message to student when an inverting amplifier circuit was
successfully constructed and verified
(a)
(b)
(c)
Fig. 10: Error screens a student might encounter when he tries to verify or submit an experiment
Fig. 11: OpAmp iLab oscilloscope interface
As an aim of this work was to make the remote lab experience imitate a local laboratory as much
as possible, the lab client computer has embedded in it a help section which provides the students
with relevant materials like datasheet for the LM741 IC, resistor colour coding and information
relevant to the circuit and SUT. These go a long way in helping students to learn how to use
datasheets and identify resistors using their colour code. This way, students who use this iLab are
no less informed than those who work with the real devices.
V.
Evaluation and Discussion
Evaluation of the pedagogical value and hence, the effectiveness of the “realistic interface” was
carried out on the basis that if our hypothesis on the extra benefit of realistic interfaces was
correct, then students should be able to handle real systems better with the new interface than
with a schematic interface. Hence, in order to measure the effectiveness of the new interface,
students were given breadboards on which to connect op-amp circuits using the LM741 IC, and
two resistors. Two sets of students were used: one set that had used the new interface to perform
experiments; and a second set that were only conversant with the op-amp circuit schematics. Our
findings are presented in table 2.
The results (table 2) show overwhelmingly that having performed the OpAmp iLab experiment
served as a major plus to a student being able to connect the real circuit manually. Those who
had only interacted with circuit symbols and had not interacted with realistic looking interfaces
took much longer to familiarize themselves with the real components and understand how to
make the connections.
Table 2: Evaluation Pedagogical Value of Improved OpAmp iLab
Evaluation Criterion
Students who used
improved OpAmp iLab
Mean time for connection of circuit 8 minutes 55 seconds
Standard deviation of the time for
2 minutes 6 seconds
connection of the circuit
Percentage who could use
100%
component datasheets
Percentage who did not need the
60%
LM741 datasheet to make their
connections
Percentage who could use a
100%
breadboard
Percentage who connected the
60%
circuit correctly first-time
Students who did not use
the improved OpAmp iLab
27 minutes 25 seconds
4 minutes 55 seconds
60%
20%
60%
0%
A point to note from magnitude the standard deviation of the time for connection of the circuit
(table 2) is that some of the students who had performed the experiment using the improved
OpAmp iLab “knew what to do except how to do it”. They still had to spend a little time to
familiarize themselves with the real equipment as opposed to the rich-internet interface even
though both of these were similar. The time they took to familiarize themselves however was
much shorter than those who had not interacted with the improved OpAmp iLab. This suggests
that while being much better than the conventional symbol-based online laboratory client, the
realistic interface cannot completely replace the “real-life” experience with the physical
components – at least, not for all students. A more elaborate study is on-going to more
elaborately assess the pedagogical value of the realistic interface.
Also, we did compare the LabVIEW dll approach for signal processing used in the improved
OpAmp iLab with the previous NI DAQ-mx approach in terms of range of frequencies they can
process. This new approach made it possible to process a much wider range of frequency as it
has a frequency span of 249.995 kHz as compared to the 0.016 kHz span of the previous
implementation. Figs. 12a and 12b shows the result of the experiment when signals of frequency
0.2 kHz and 70 kHz were processed respectively.
(a)
(b)
Fig. 12: showing the signal returned from the improved OpAmp iLab indicating wide frequency
range
VI. Conclusion
The improved OpAmp iLab with a very realistic interface, a remote laboratory based on the MIT
iLab shared architecture, is the third iteration of the OpAmp iLab at OAU, Nigeria. The lab
client built with the Adobe Flex Framework mimics the real components, devices and equipment
to make the remote laboratory experience as close to real-life as possible. This was intended to
help students who use the OpAmp iLab relate such experiences in handling real systems. And as
the result of the study shows, the realistic interface to a reasonable extent aided the students’
understanding of the experiment. Our hypothesis is therefore valid: realistic interfaces improve
students' laboratory experience.
VII. Acknowledgement
The authors would like to thank Jud Harward and members of the Center for Educational
Computing Initiatives (CECI) at the Massachusetts Institute of Technology for assisting with
various aspects of the research. The research was funded by a grant from the Carnegie
Corporation of New York.
REFERENCES
1.
I. Gustavsson*, Remote Operation and Control of Traditional Laboratory Equipment, Sweden, 2006
2.
Del Alamo, J. A., L. Brooks, C. Mclean, J. Hardison, G. Mishuris, V. Chang, And L. Hui, "The Mit
Microelectronics Weblab: A Web-Enabled Remote Laboratory For Microelectronics Device Characterization."
2002 World Congress On Networked Learning In A Global Environment, Berlin (Germany), May 2002
3.
Gerado Viedma, Isaac J.Dancy, and Kent H. Lundberg, “A web-based Linear-Systems iLab”. Proceedings of
2005 American Control Conference
4.
Aina, O. I., 2003, Alternative Modes of Financing Higher Education in Nigeria and Implications for University
Governance’ in J. Babalola and B. O. Emunemu, (Eds), Issues in Higher Education: Research Evidence from
Sub-Saharan Africa, Association of African Universities and Higher Education Research Policy Network,
Accra
5.
Olowokere, D.; Ayodele, K. P.; Kehinde, L.O.; Jonah, O.; Ajayi, T.O.; Akinwunmi, O.O., Realistic Looking
Interfaces: in Search of the Best Ergonomic Metaphors for Remote and Virtual Laboratory Interfaces,
Proceedings of the ASEE Annual Conference and Exposition, June 2008, Pittsburgh
6.
V.Judson,“iLab: A Scalable Architecture for Sharing Online Experiments”, ICEE, Florida (USA), 2004
7.
K.P Ayodele et al., "Development of an Operational Amplifier Virtual Laboratory Based on iLab Architecture
and NI ELVIS," in ASEE Annual Conference and Exposition, Pittsburgh, PA, 2008, pp. AC 2008-1098
8.
Luís Gomes, Javier Garcia Zubía. Advances on Remote Laboratories and e-Learning Experiences. Bilbao:
University of Deusto, 2007, v. 6, p. 297-309
9.
Del Alamo, J.A., Chang, V., Hardison, J., Zych, D., and Hui, L.(2003): An Online Microelectronics Device
Characterization Laboratory with a Circuit-like User Interface, Proceedings of the International Conference on
Engineering Education, Valencia, Spain
10. NI Educational Laboratory Virtual Instrumentation Suite (NI ELVIS) Hardware User Manual, National
Instruments, August,2008
11. D. Blazakis. Interpreter exploitation: Pointer Inference and JIT spraying. In Blackhat, USA, 2010
12. Nedic, Z., Machotka, J., and Nafalski, A. 2003. Remote laboratories versus virtual and real laboratories. In
Proceedings of the 2003 33rd Annual Frontiers in Education Conference. Boulder, CO. T3E.1-T3E.6
13. Kehinde, L.O. (1989): The “Dozen-Impedance” Operational Amplifier Module for Experimentation.
International Journal of Electrical Engineering Education, vol. 26, No. 3, 1989, pp 224-232, ManchesterUP
14. Makoju G.A.E.: Nigeria Education Sector Diagnosis; A framework for Re-engineering the Education Sector,
Education Sector Analysis Unit Federal Ministry of Education, Nigeria, 2005