1
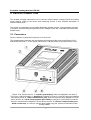
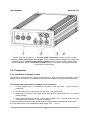
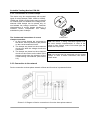
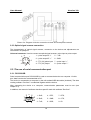
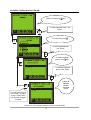
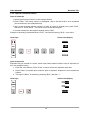
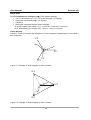
PTD – 3G Portable Testing Device for Testing of electricity meters User Manual version 2.0 "Elgama-Elektronika" Ltd 2009 1 2 Contents 1. INTRODUCTION................................................................................................................ 5 2. DEVICE CONNECTION ........................................................................................................ 7 2.1. Connectors ..................................................................................................................... 7 2.2. Preparation ..................................................................................................................... 8 2.2.1 Connection of voltage circuits.................................................................................... 8 2.2.2. Connection of current clamps ................................................................................... 9 2.2.3 Connection to the network ......................................................................................... 9 2.2.3 Optical signal scanner connection ........................................................................... 10 2.3. The use of serial communication port............................................................................ 10 2.3.1. RS 232/USB ........................................................................................................... 10 2.3.2. Electronic communication port “Current loop” ......................................................... 11 3. DEVICE CONTROL AND SETTINGS ................................................................................. 12 3.1. Introduction of information on the display ...................................................................... 12 3.1.1. Informational fields of indicator ............................................................................... 12 3.1.1.1 State bar ........................................................................................................... 13 3.1.1.2. Headline .............................................................................................................. 13 3.1.1.3. Menu bar.......................................................................................................... 13 3.1.1.4. Working area.................................................................................................... 13 3.1.2. Menu structure ....................................................................................................... 13 3.2. Keyboard ...................................................................................................................... 14 3.2.1 Device control in menu mode .................................................................................. 14 3.2.2. Input of numerical values........................................................................................ 16 3.3. Device configuration ..................................................................................................... 17 3.4. Information about device and its state........................................................................... 21 3.4.1. Information about device ........................................................................................ 21 THE FOLLOWING INFORMATION ABOUT DEVICE IS DISPLAYED ON LCD: ..................... 21 3.4.2. Information about device status .............................................................................. 21 4. METER TESTING ............................................................................................................... 22 4.1. Testing settings............................................................................................................. 22 4.1.1. Meter characteristics .............................................................................................. 22 4.1.2. Test conditions ....................................................................................................... 23 4.1.3. The tests performed ............................................................................................... 24 4.1.4. Command “Start” .................................................................................................... 24 3 4.2. Procedure of test performance...................................................................................... 24 4.3. Results of meter testing ................................................................................................ 26 5. INSTANTANEOUS VALUES ............................................................................................... 27 5.1. Review and storage ...................................................................................................... 27 Instantaneous values ....................................................................................................... 27 5.2. Record review and erasing ........................................................................................... 30 6. NETWORK QUALITY MONITORING.................................................................................. 31 6.1. Analysis of power quality............................................................................................... 31 6.2. Profile record ................................................................................................................ 31 6.3. Monitoring performance order ....................................................................................... 32 6.3.1. Monitoring settings ................................................................................................. 32 6.3.2. Function settings .................................................................................................... 32 6.3.3. Start of monitoring .................................................................................................. 34 6.4. Work with records ......................................................................................................... 35 6.4.1. Record review on the display.................................................................................. 35 6.4.2. Record erasing ....................................................................................................... 36 7. DEVICE KIT AND WARRANTIES ....................................................................................... 37 7.1. Device Kit...................................................................................................................... 37 7.2. Warranty ....................................................................................................................... 38 4 Portable Testing Device PTD-3G 1. INTRODUCTION PTD - 3G is a portable testing device for testing of electricity meters (further referred as device). It is used for the following aims: 1. On site testing of inductive and static electricity meters; 2. Analysis of network harmonics, energy quality monitoring functions (according to the EN 50160); 3. Measurement of instantaneous values listed below: current, voltage (of phase and line), active, reactive and total power, power factor (cos ϕ), frequency, vector diagram, (moreover, the device shows the load quadrant of each phase); 4. Profile recording of chosen measuring values. The results of meter testing, network quality monitoring, and snapshots of instantaneous values are being saved in the energetically independent memory. Saved data can be reviewed on the device indicator or PC. The device is controlled and configured by the interactive graphic interface: built-in keypad and menu system. All the information, entered using keyboard and the results of measurements and tests, are displayed on the graphic liquid crystal display (128 x 128 points). The results are displayed in indicator in text and graphic forms (graphs, histograms). The device is supplied from voltage circuits it is testing. Technical specifications of the device are presented in Table 1-1. 5 User Manual Version 2.0 Table 1-1. Technical specifications of the device Accuracy class 0.5 Energy consumption, VA: <2/phase Operating voltage range, V: 45 ... 276V Frequency range, Hz: 45 ... 65 Range of operating temperatures -20°C … +50°C Time base, s 1 Dimensions, mm: 157x189x67 Ingress protection IP 40 With 100 A current clamps With 1000 A current clamps With 1500 A current clamps Range of indications: Current ranges, A: 0,5 ...100; 1 ...1000; 10 ...1500 500mA ... 1500A Voltage measurement Measurement range, V Measurement error: 50 … 265 ±0,2% Frequency measurement Frequency range, Hz Resolution 45 … 65 0,01 Hz Power factor measurement Measurement range Resolution -1 … +1 0,01 Current measurements: Measurement of angles Phase shift angle Resolution Angles between voltage phases: Resolutions Error: ±0,5% ±0,2% ±0,5% 0,1° 1° Harmonics Voltage harmonic components Current harmonic components 1 … 30, 0-100% 1 … 30, 0-100% Meter error measurement Meter constant Indicated error 65535E-9 … 65535E9 0,1 … 999,9% Pulse outputs and inputs S0 input: Input constant, imp/kWh S0 output: Input constant, imp/kWh: IEC 62053-31 65535E-9 … 65535E9 65535E-9 … 65535E9 6 Portable Testing Device PTD-3G 2. DEVICE CONNECTION This chapter provides instructions how to connect current clamps, voltage circuits and optical signal scanner (OSS) to the device and measuring circuits. It also contains description of communication ports. The device is connected to a low voltage alternating network circuits. Current clamps are used to measure current flowing through the circuits. Voltage circuits are connected to the device by flexible wires. 2.1. Connectors Device’s exterior is presented in pictures 2-1A and 2-1B. The keypad and the indicator are mounted on the front part of the device (see Picture 2-1A), and all the connectors – on the upper (see Picture 2-1B) and lower covers (see Picture 2-1A). Picture 2-1A. Device exterior. 1 - Liquid crystal display. Data are displayed in the area of 73x73 mm (128X128 points). 2 - Keyboard. A keypad of 16 keys is used for data input, settings and device control. 3 - USB communication port. Used for communication between PTD-3G device and PC. 4 - Serial communication port RS232. Connection: 9 pole SUB-D connector. Used for communication between PTD-3G device and PC. 5 - Electric communication port 20mA current loop. It is used to transmit device data using the systems of automatic meter reading (AMR). 7 User Manual Version 2.0 Picture 2-1B. Device exterior. 1 – Current clamp connections. Used to connect current clamps. 2 - Phase connections for voltages. Used to connect phase voltages to the device by flexible wires. 3 – Neutral connection for voltage. Used to connect neutral voltage to the device by flexible wire. 4 - Universal connector. Used to connect an optical signal scanner, pulse input or pulse output. 2.2. Preparation 2.2.1 Connection of voltage circuits The device is connected to the voltage circuits by four (in case of three wire connection – three) flexible wires. The wires are connected to the measured voltage circuits by isolated terminals. The fundamental instructions for voltage circuit connection: 1. At first voltage wire is connected to the device, and only then – to the circuit for measuring. 2. At first neutral wire is connected, and only then – the phase wires; 3. Black wire is for neutral, and yellow, green and red wires, respectively for L1, L2 and L3 phase voltages. 4. When disconnecting the device, at first each voltage wire is disconnected from the measured circuit, and then – from the instrument. Device is switched on when neutral and at least one phase wires or at least two phase wires are connected to the circuit (Operating voltage range: 45 V ... 276 V ) . 8 Portable Testing Device PTD-3G 2.2.2. Connection of current clamps The device may be complemented with several types of current clamps (100A, 1000A or 1500A). 1000A and 1500A current clamps may be placed on isolated and non-isolated low voltage wires, whereas 100A clamps can be placed only on non-isolated low voltage conductors. Technical characteristics of current clamps existing in a concrete device complement are always submitted in pass of clamps. The fundamental instructions of current clamps connection: 1. At first current clamps are connected to the device, and only then they are placed on the current measured circuit. 2. The clamps are placed on the measured circuits only after the voltage circuits are connected. 3. The clamps are placed on the measured circuits so the cursors on the sides of the clamps would show the direction of the current flowing via conductor (see Picture 2-2). Picture 2-2 Note: the device is being calibrated together with the exact clamps complemented. In case of the usage of other clamps, even of the same type, the results are not precise. Note: the current may be measured only by current clamps. In case of direct connection, the device breaks down. 2.2.3 Connection to the network Device connection to three-phase network of three and four wires is presented below. Picture 2-3. Diagram of device connection to four wire three-phase network 9 User Manual Version 2.0 Picture 2-4. Diagram of device connection to three wire three-phase network 2.2.3 Optical signal scanner connection The characteristics of optical signal scanner, connection to the device and adjustments are introduced in its passport. Universal connector. Used to connect an optical signal scanner, pulse input or pulse output. 6 8 7 1 3 4 5 2 1 – pulse output A “+” 5 - +5В 2 – pulse output R “+” 6 - GND 3 - TTL (3V) pulse input 7 – pulse input “+” 4 - TTL (3V) output 8 – pulse output “-” 2.3. The use of serial communication port 2.3.1. RS 232/USB Serial communication port RS 232/USB is used to connect the device to a computer. Via this port, data from device are transmitted to PC. The device is connected to a computer by the null-modem/USB data cable (included). The data reading software “DevCom” is submitted together with the device. After connecting the device to a computer, communication parameters must be set. (see chapter 3.3). In addition, the manual of software describes specific work with software “DevCom”. 1 6 2 3 4 5 9 7 8 1 - DcD, 4 - DTR, 7 - RTS, 2 - RxD, 5 - GND, 8 - CTS, 3 - TxD, 6 - DSR, 9 - RI. 10 Portable Testing Device PTD-3G 2.3.2. Electronic communication port “Current loop” Electrical communication port 20mA “current loop” is used to connect the device to automated meter reading systems (AMR) as measuring point. After connecting the device to the data reading system, communication parameters are to be defined in the device configuration (see chapter 3.3). The data via current loop is transmitted using the IEC 1142 communication protocol. Reading of such data requires special software. 11 User Manual Version 2.0 3. DEVICE CONTROL AND SETTINGS The first part of this chapter describes the device menu system, the following one – the keypad, device control and input of numerals. Configurations are introduced in the third part, and the final part defines the possibilities of information review about the device and its state. 3.1. Introduction of information on the display The device is being controlled via interactive graphic interface; that is, a keyboard and menu system. The device menu or menu items chosen are shown on the display of the device switched on. A user may change the settings of device and test, perform information inputs and exercise other operations. Status bar Headline Working area Icon of menu chosen Icons of menus Menu bar Picture 3-1 3.1.1. Informational fields of indicator Device indicator may be conditionally divided into four informational fields (see picture 3-1): Status bar; Headline; Menu bar; Working area. 12 Portable Testing Device PTD-3G 3.1.1.1 State bar Picture 3-2 When the device operates in menu mode, four quantities are showed on the state bar (see Picture 3-2): time, network type, current clamps type, the sequence of voltage phases. Time – the time of internal clock. User can set date and time of internal clock using built-in keypad. Time format: hh:mm:ss. Network type. There are two possible network types: • "Y" – four-wire connection; • "∆" - three-wire connection. Current clamps type. Maximum current of chosen current clamps is shown. Every time new current clamps are connected to device, maximum current of connected clamps must be defined (for current clamps type changing instruction see chapter 3.3 ). 3.1.1.2. Headline The title introduced in the headline represents the nature of information present in the working field at that time. When you choose menu or submenu, or review the record saved in the memory, the headline introduces the title of chosen variant. 3.1.1.3. Menu bar Menu bar displays pictograms of all device menus. The background of chosen pictogram is dark, and the symbol is of a background color. The headline displays the title of menu chosen. The content of menu bar changes only when instantaneous values are shown. Menu bar presents the icons of instantaneous values groups and instantaneous data of the corresponding group (see chapter 5-1). 3.1.1.4. Working area Information field presents the actual information – the list of menus, submenus, commands or settings. At least one item in the list of working field is selected. The line of the selected item is colored in black, and the text – colored in background color. 3.1.2. Menu structure All commands and device settings accessible to a consumer are divided into seven menus. An icon is assigned to each menu (see picture 3-1). 13 User Manual Version 2.0 Each menu is a list of commands, choices and settings related to particular functions or operations. For example, the commands, provisions and choices of menu “Meter Info” are used to perform meter testing functions and settings. Commands, settings and variants grouped to one menu are divided into separate groups – submenus – according to their purpose. Example: all fields that are used to accumulate information on the meter tested are collected into one submenu “Meter Info”. Therefore, in case you want to record the information about the tested meter, you need to choose menu “Tests of accuracy” and then to choose “Meter Info” from the appeared list (such sequences of choices are further referred to as follows: Tests of accuracy → Meter Info). The list of meter characteristics appears on the indicator of working area. The settings are to be set in each list line: the numbers are introduced or the point is selected from the list of variants. 3.2. Keyboard The devise has a 16-key keypad witch is used to choose menu, submenu or commands, to perform device configurations and input of digital values. Table 3-1 introduces briefly the purpose of keys in different work modes. Table 3-1 Keys Purpose in menu mode Purpose in numeral recording Serial choice of menu Is not active in numeral recording mode Serial choice of submenu Is not active in numeral recording mode Return to the former field Deletes the last recorded numeral Calls the menu marked or switches recording menu on Confirms the numeral recorded Is not active in menu mode Record the numerals + Is not active in menu mode Enter decimal point + Is not active in menu mode negative numerals … 3.2.1 Device control in menu mode An example of device control in menu mode is shown in Picture 3-3. 14 Portable Testing Device PTD-3G Menu is chosen by key To enter selected menu, use "Enter". To select item use 1 Date/Time 3 Communication To enter selected item, use "Enter" To select required option, use key 1 PC To activate selected option, use "Enter" 1 PC A sign "X" appears beside activated option X To return one level up, use “Clear”. In menu mode, "Clear" does not unmake changes is made. Picture 3-3. An example of device control in menu mode 15 User Manual Version 2.0 3.2.2. Input of numerical values Input of numerals 1 Select input field (the first line in the example below). 2 Press “Enter”. The former value is to disappear, and in the field 0.00 is to be remained (the second line in the example below). 3 Input a new meaning with the keypad. In order to record a decimal point, press “Shift”, and then “0”. Press “Enter”. The curcor moves to the following line. 4 In order to delete the last symbol entered, press “Clear”. Example of entering is presented below. 50.45 - the former meaning, 50,65 – new value. Used keys Value in the display 50.45 0.00 50.65 50.65 Input of exponent Exponent may be entered for values, which input fields contains field for input of exponent (is as in the example below). 1. Enter the value fraction. Press “Enter” to move cursor into exponent input field. 2. Press “Enter” to activate input mode for input of exponent. Exponent is to be entered as fraction. 3. The sign of “Minus” is entered by pressing “Shift”, and then “+”. Used keys Value in the display 375e 4 375e 0 50.65 16 Portable Testing Device PTD-3G 3.3. Device configuration A consumer may change the following settings: Date/time of internal clock; Display backlight duration; Sensitivity of keyboard; Communication parameters; Network type; Type of current clamps; Voltage and current transformation coefficients; Password. Date/time setting 1 Choose Settings → Date/Time; 2 Enter the day (see chapter 3.2.2. about input of numerals) and press “Enter”. The cursor moves to the next line; 3 Enter month, year, seconds, minutes and hours in the same way; 4 Choose the command “Save changes”. Press “Enter”; Display backlight duration Backlight duration – time interval from the last press of key until the backlight is switched off. 1 Choose Configuration → Keyboard → Backlight. Press “Enter” 2 Enter backlight duration in seconds. Backlight duration may be determined from 1 to 255 seconds. Keyboard sensitivity There are five different keyboard sensitivity levels. To change sensitivity level: 1 Choose Settings → Keyboard → Speed. Press “Enter”. A drop down list of sensitivity levels appears. 2 Choose sensitivity level from the list and press “Enter”. The caption of selected level immediately appears in the line Speed. Communication settings In the communication settings, the appropriate external device (a computer or systems of automated meter reading) PTD-3G data is transmitted to. 1 Choose Settings → Communication. 2 From the list, select the external device, connected to RS 232/USB port. Press “Enter” to activate selected option. The sign “X” is to appear near the selected option. 17 User Manual Version 2.0 Network type settings This parameter holds information about network device is connected to. Two variants are possible: 4-wire (marked by symbol “Y” in state line), 3-wire (symbol “∆”). In order to indicate connection type, the following acts are to be performed: 1 Choose Connection. 2 From the list, select the appropriate option and press “Enter”. The sign “X” is to appear near the option chosen. Not more than after one second, network type indicator is to be changed in status bar. Settings of current clamps type The device may be used only with the current clamps from device kit. Constants of these clamps are entered in the device memory (clamps are listed in menu Current ranges). Every time the current clamps are changed, current clamps settings is to be changed as well. The current clamps type settings is defined in the following way: 1. Choose menu Current ranges. 2. From the list, select appropriate type. Press “Enter” and the sign “X” will appear near the type chosen. In case the type of current clamps is changed, the current clamps type indicator in status bar is changed no more than after one second. Voltage and current transformation coefficients There is possibility to perform measurements taking into consideration current and/or voltage transformations in front of and behind the circuits measured. Transformation coefficients are entered in the following way: 1 Choose Transformer ratio. 2 in the corresponding lines of the list, enter the values of voltage and/or current transformers. 3 In the lines “Current: primary” and “Voltage: primary” nominal current and voltage of primary circuit are indicated, and in the lines “Current: secondary” and “Voltage: secondary” - voltage and current of secondary circuit. The range of available values is from 1 to 65535. Password settings There are two device security levels: Access to the device is unlimited; Access to the device is limited by password. Increase of security level (require PIN): 1 Choose Settings → Security and Press “Enter”. 2 Choose “On”. Press “Enter”. Near the sign “On” the sign “X” is to appear. 18 Portable Testing Device PTD-3G Decrease the security (do not require the identification code): 1 Choose Settings → Security. Press “Enter”. 2 Choose “Off”. Press “Enter”. Near the sign “Off” the sign “X” is to appear. Change PIN 1. Choose Settings → Security → Change PIN and Press “Enter”. 2. In the line “Old PIN” enter the present PIN. Press “Enter”. 3. In the line “New PIN” enter the new PIN. Press “Enter”. 4. In the line “Repeat PIN” repeat new PIN and press “Enter”. In case the new PIN was entered correctly both times, a confirmation message is displayed. Press “Enter” to return one level up. Default settings The command sets default values (defined in the manufactory) to the common settings. Choose Settings → Reset Settings. Press “Enter”. To confirm command, press “Enter” (to cancel action, press “Clear”). Default values are presented in Table 3-3 19 User Manual Version 2.0 Table 3-3 Settings Default Value Menu item Backlight, s 120 Settings ->Keyboard ->Backlight Keyboard speed High Settings ->Keyboard ->Speed Communication PC Settings ->Communication Security Off (PIN =0000) Settings ->Security Connection 4-wired Connection Current ranges 0,5A – 1000A Current ranges Transformer ratio 1/1 Transformer ratio Serial number 0 Tests of Accuracy ->Meter Info Constant 5000 Tests of Accuracy ->Meter Info Class 0,5 Tests of Accuracy ->Meter Info Meter type Inductive Tests of Accuracy ->Meter Info Phase number 3 Tests of Accuracy ->Meter Info Skip pulses 4 Tests of Accuracy ->Test Config Mediate 10 Tests of Accuracy ->Test Config Evaluate 100 Tests of Accuracy ->Test Config Energy Active Tests of Accuracy ->Test Config Perc. Error No Tests of Accuracy ->Select Tests No Load No Tests of Accuracy ->Select Tests Starting No Tests of Accuracy ->Select Tests Constant No Tests of Accuracy ->Select Tests Test ID 0 Monitoring ->Test ID Phase voltage, V: 240/200/10 V Monitoring ->Power Quality Frequency, Hz: 55,50/05/45,50 Hz Time base, s 900 Monitoring ->Profiles Profile No Monitoring ->Select PQM Power quality No Monitoring ->Select PQM Power quality 20 Portable Testing Device PTD-3G 3.4. Information about device and its state 3.4.1. Information about device Choose Settings → General. The following information about device is displayed on LCD: • Serial Number; • Model; • Software version; • Information (up to 16 characters). This information is entered into device memory during factory parameterization. 3.4.2. Information about device status Device provides following information about it's state: Memory state; Battery state. Memory state Choose Settings → Data Storage. The following information is displayed on LCD: PQM Tests Free. Indicates number of power quality monitoring records which can be saved without deleting from memory existing records. PQM Tests Tot. – Number of PQM record which can be saved in meter memory. Snapshots Free: indicates number of instantaneous values snapshots available to be saved without deleting from memory existing records. Snapshots Tot. Number of snapshots which can be saved in meter memory. Meters Tests Free: number of meter tests records which can be saved without deleting of already saved records. Meters Tests Tot.: Number of meters tests results records which can be saved in meter memory. Battery state Choose Settings → Battery. In line Battery remain:, battery voltage is displayed (device has 3,6V Li battery). Below line Battery remain: the remaining energy of battery is displayed as progress bar and numerical value 21 User Manual Version 2.0 4. METER TESTING Meter testing functions are described in the present chapter. The first part of this chapter describes the settings required to perform before the meter testing. The order of tests performed is introduced in the second part, and the final part defines how to review and (or) delete results of meter testing stored in the device memory. The device can test both, inductive and static electricity meters. 100A current clamps are used for testing of direct connected meters. For testing of CT operated meters, 1000A or 1500A current clamps are used which are placed on the primary current circuits to obtain total results of both meter and transformers. During the testing the tests listed below may be performed: • To measure meter error; • No load condition test of a meter; • Meter starting test; • to test meter constant. 64 meter testing results may be stored in the device memory (each testing may be composed of up to four meter tests mentioned above). Before the performance of meter tests, it is required: • to input meter characteristics (see chapter 4.1.1); • to input test conditions (see chapter 4.1.2); • to define what tests will be performed (see chapter 4.1.3); • to test optical scanning head (see chapter 2.2.3); 4.1. Testing settings 4.1.1. Meter characteristics Characteristics of a meter tested are recorded via Tests of Accuracy → Meter Info. The following characteristics are introduced: Ser. No - serial number of a meter (up to 9 numbers). It is used to identify a meter; Const (meter constant is indicated on its panel). The number is to be indicated the fraction of which is 1 to 65535, and degree index – -9 to 9. It is allowed to enter only integer values while entering meter constant. In case meter constant is not integer, it is to be indicated with negative exponent index. For example, if one wants to write 37.5 meter constant, the format of number is to be 375 E-1. Class (accuracy class of a meter). The quantity entered is of informational nature. Accuracy class is to be recorded in the following way: 1 Choose Tests of Accuracy → Meter Info → Class and press “Enter”. 2 Use the keys and ↑↓ to choose accuracy class and press “Enter” to activate option selected. Inductive/Static. The type of meter tested is chosen in here. Cursor may be moved with the keys . In case inductive type is chosen, green color LED for backlight of meter disk switches on in the optical scanning head. 3 phase/1 phase. Phase number of the network where the meter is connected is chosen in here. Cursor may be moved with the keys . 22 Portable Testing Device PTD-3G 4.1.2. Test conditions Test conditions are to be determined by choosing Tests of Accuracy → Test Config. Test conditions are listed below. The use of the determinations indicated below depends upon load current, meter constant, etc. Mediate. It is used only for the test of measurement errors. This quantity is used to calculate the intermediate results of relative error, and to define the number of pulses chosen to determine the average result. It is suggested choosing the value, which would be 5 to 10 times less than the number of total pulses. The range of values is to be 1 to 225. Skip. It is used only for test of measurement error. It indicates the number of pulses required to skip before the calculation is started. Evaluate. It is used only for test of measurement error. It indicates the number of pulses to be used for the calculations of average error. Number of pulses is calculated according to formula 4-1. N= P ⋅C ⋅t 60000 4-1 Where P – average power, [W] C – meter constant, [imp/kwh] t – test duration, [min] test duration depends on load variation (see table 4-1). Generally, 5 min is enough to perform error measurement. In case of big variation of mediate test results, test duration have to be set to 10min. If there is need to calculate load variations nicely, use formula 4-2. ∆P = Pavg − Pmd Pavg ⋅100% 4-2 Where Pavg – average load; Pmd – maximum deviation from Pavg Time interval of measuring of Pavg and Pmd must be no less than 1min. Table 4-1. Test duration dependency from load variation Load variation ∆P, % Recommended test duration Load variation ∆P, % Recommended test duration 0 1 25 16 5 4 30 18 10 7 35 21 15 10 40 24 20 13 50 30 Energy. It is used in all tests. It indicates what energy measured (active, reactive or total) the test is performed for. 23 User Manual Version 2.0 4.1.3. The tests performed Before the meter testing, it is required to activate tests to be performed (it is possible to perform up to 4 different tests by one request, defined at the beginning of this chapter). During the testing only activated tests are to be performed. Test activity indicator Chose Tests of Accuracy → Select Tests. The list of tests appears on the display. Test activity is indicated on the right side of each line near the title of a test. It shows whether the test will be performed during the meter testing. Two evaluations of test activity are possible: if the test is activated, the indication is “Yes”; if the test is not activated, the indication is “No”. Test activation 1 Choose Tests of Accuracy → Select Tests. 2 Choose the test you want to activate. Press “Enter”. The activity indication has to be changed into “Yes”. Test deactivation 1 Choose Tests of Accuracy → Select Tests. 2 Choose the test you want to deactivate. Press “Enter”. The activity indication has to be changed into “No”. Note: meter testing function is active if at least one test is activated. 4.1.4. Command “Start” Command Start initiates meter testing. The instructions of the choice of command are listed below. 1 Choose Tests of Accuracy → Start. The list of tests and their activity indications are introduced on the display. 2 Be sure that the tests are activated correctly. a) If any changes are required to make, press “Clear”. Menu Tests of Accuracy is opened. b) If the tests are activated correctly, press “Enter”. 3 A message appears on the display defining what test will be performed, and if needed, indicating what is required to do before the test. Do the operations indicated in the message and press “Enter”. 4.2. Procedure of test performance Procedure of test performance is described below when only one test is being performed. The device must be prepared for operation in accordance with the instructions listed in 2.2.1, 2.2.2 and 2.2.3 chapters of this manual before any test performance. Meter error measurement 1 Record meter characteristics (see chapter 4.1.1). 2 Indicate test conditions (see chapter 4.1.2). 3 Activate only the test of meter error measurement (see chapter 4.1.3). 4 Choose Tests of Accuracy → Start (see chapter 4.1.4). 24 Portable Testing Device PTD-3G The test is to be performed after all operations described in chapter 4.1.4 are finished. During the test the display shows: at the beginning of the test – the date and time in format yy/dd/mm hh:mm; the time (in seconds) from the beginning of the test; relative percentage error of last period; relative average error in percents. No load condition test. When the voltage is applied with no current flowing in current circuit, the test output of the meter shall not produce more than one pulse. The matter of the no load condition test – to test this meters condition. 1 Perform the actions described in the instructions (1-2 points) of error measurement test (see the same page above). 2 Activate only no load condition test. 3 Disconnect the load from the meter. 4 Choose Tests of Accuracy → Start and start the test (see chapter 4.1.4.). The information indicated below is presented on LCD during the test: at the beginning of the test – the date and time in format yy/dd/mm hh:mm; the time (hh:mm:ss) from the beginning of the test; the number of pulses recorded. The test is stopped with the key “Enter” or stops automatically if device registers 4 pulses of meter test output. Starting test. The meter shall start and continue to register at the starting current value. The test matter is to test this condition of the meter. 1 Perform the actions described in the instructions (1-2 points) of error measurement test (see chapter 4.2, "Meter error measurement"). 2 Activate only the test of starting. 3 Connect active load, equal to the sensitivity threshold of the meter. 4 Choose Tests of Accuracy → Start and start the test (see chapter 4.1.4.). During the test the information presented is the same as during the no load test. Test is stopped by “Enter”. Meter constant test The relations between the test output and the indication in the display shall comply with the marking of the name plate. The test matter is to test this relation. 1 Perform the actions described in the instructions (1-2 points) of error measurement test ((see chapter 4.2., "Meter error measurement"). 2. Activate only the test of registers. 3 Choose Tests of Accuracy → Start and start the test (see chapter 4.1.4.). 4 Record the register value of the meter from which the test is to be performed and the register value of the meter up to which the test is to be performed. 5 Choose Start. The test of registers is being started. 6 Observe the indications of meter register. When the indications of the meter reaches meaning entered below the line “Press Enter when register reach:”, press “Enter”. 25 User Manual Version 2.0 During the test the following information is shown on LCD:: the time (hh:mm:ss) from the beginning of the test; below the line “Press Enter when register reach:”, the register value of the meter is presented up to which the test will be performed; below the line “Delivered energy” the meaning of energy delivered, registered by the device, is presented; below the line “Consumed energy” the meaning of energy consumed, registered by the device, is presented; In case you want to stop the test, press the key “Clear”. After test the following data is shown on LCD: • Date and time of test start; • Test duration [hh:mm:ss]; • Delivered energy error; • Consumed energy error In case you need to perform more than one test, activate the tests interested. In this case, when one test ends, a message with instructions, which have to be performed before starting the other test, appears. After the actions defined are finished, press “Enter”. 4.3. Results of meter testing Up to 64 meter testing results can be stored in the meter memory. Each meter testing performed is automatically saved in the device memory. The records may be reviewed, transmitted into computer or erased from the memory. The records in the device are listed by the date and time of meter testing (see the illustration below). Review of the results on the display The instructions of the review of records are listed below: 1 Choose Tests of Accuracy → Storage → Review Records; 2 Choose the record from the record list presented and press “Enter”; 3 Meter characteristics and the list of possible commands are presented on the LCD. Choose Review Results; 4 The list of tests performed appears on the indicator. Choose the test and press “Enter”. The results of the test chosen are shown on the display. Erasing of records The record may be deleted according to the following instructions: 1 Choose Tests of Accuracy → Storage → Review Records; 2 Choose the record and press “Enter”; 3 In the window of meter characteristics choose Delete Test; 4 A confirm message appears on the indicator. Press “Enter” (to cancel, press “Clear”). All records of meter testing results, stored in the device memory are to be deleted in the following way: 1 Choose Tests of Accuracy → Storage → Delete All; 2 A confirm message appears. Press “Enter” (or “Clear” to cancel action). Transmission of the results into a computer The results of meter testing are transmitted into a computer using the software “DevCom” of “ELGAMA-ELEKTRONIKA” Ltd. The software “DevCom” is described in the instructions of the manual. 26 Portable Testing Device PTD-3G 5. INSTANTANEOUS VALUES The present chapter describes the measurement of instantaneous values. The first part of the present chapter describes how to review instantaneous values on the device indicator and how to save their snapshot in the device memory. The second part analyses how to review and (or) delete one or all items of data stored in the memory. The device measures the following instantaneous values: phase and lineal voltages; currents in each phase; power of each phase and active power summed; power of each phase and reactive power summed; power of each phase and total power summed; cosϕ of each phase and aggregate cosϕ; angles between phase voltages; frequency; vector diagrams; coefficients of voltages and currents harmonic. The device defines load quadrants in each phase. Load quadrants, vector diagrams and harmonic coefficients are displayed on the indicator graphically. However, harmonic coefficients may be displayed in textual form using tables as well. Time base of Instantaneous values measurement is 1s. Instantaneous values measured may be reviewed on the meter indicator. Moreover, their snapshot may be saved in the device memory. 5.1. Review and storage Review of instantaneous values Instantaneous values may be review in the following way: Choose Instantaneous → Display. 1. With the keys choose the right size pictogram in the menu line. The indicator displays the values chosen. Icon Instantaneous values Phase and lineal voltages Currents in each phase Power of each phase and active and reactive powers summed Power of each phase and total power summed cos ϕ of each phase and aggregate cos ϕ, frequency Vector diagram Harmonic coefficients 27 User Manual Version 2.0 Power factor Choose Instantaneous → Display → ϕ, f. The indicator displays: • cosϕ of each phase (PF1, PF2, PF3) and the angle ϕ in degrees; • aggregate cosϕ and the angle ϕ in degrees; • frequency; • the angles in degrees between phase voltages: for 4-wire network (see chapter 5-1): ∠U12(α12), ∠U23(α23), ∠U31(α31); for 3- wire network (see chapter 5-2): ∠U1(α1), ∠U2(α2), ∠U3(α3). Vector diagram Figures 5-1 and 5-2 presents the examples of vector diagrams corresponding to 4-wire and 3wire connection. U3 I3 ϕ3 I1 α13 α23 α12 ϕ1 U1 ϕ2 I2 U2 Figure 5-1. Example of vector diagram for 4-wire network. U3 α3 I1 α1 ϕ1 ϕ2 I2 α2 U2 Figure 5-2. Example of vector diagram for 3-wire network. 28 U1 Portable Testing Device PTD-3G Review of network harmonic coefficients Network harmonic coefficients are displayed in the form of tables or histograms. Network harmonics may be reviewed in the following way: 1 Choose Instantaneous → Display. 2 With the keys choose the pictogram of harmonics (see Table 5-1, 7 pictogram). The change of representation mode of harmonics After the operations listed above are completed, the meter indicator displays network harmonic coefficients. The information presented below indicates the mode of display (table, graph), phases and size of harmonic showed In case the harmonics have not been reviewed since the switch on of the device, the histogram of phase L1 harmonics is being displayed; In case the harmonics have been reviewed since the switch on of the device, the phase, form (table, histogram) and size of harmonic reviewed for the last time are being displayed. For the review of harmonics the following keys are being used: ↑↓ - switches to the review of harmonics of a different size. The sizes are switched in the following sequence: U1, I1, U2, I2, U3, I3; + - changes the display form of harmonics (table – histogram). Command “Hold” This command stops the renewal of instantaneous values displayed on the indicator until the command is performed once more. Note: the command is invalid when the harmonic coefficients are being displayed. Performance of command “Hold” 1 Choose the menu needed of review of instantaneous values (see chapter 5-1). 2 Press “Enter”. The note “Hold” is to appear on the top corner of the indicator. In case you want to cancel the command “Hold” press “Enter” once more or go to another review menu of instantaneous values. Snapshot saving 1 Choose command Instantaneous → Save. An input field appears. Enter snapshot ID and press "Enter". Note “Please wait!” appears, and the snapshot recording progress bar is displayed under it. 2 When the record is saved a corresponding note appears. Press “Enter”. Menu of instantaneous values is displayed. Up to 64 snapshot records may be saved in the device memory. When the memory allotted to the snapshots is full, new snapshot records are not saved. In this case, choosing the command Instantaneous → Save, will show a corresponding warning message. In this case, at least one snapshot record should be deleted in order to save a new record. 29 User Manual Version 2.0 5.2. Record review and erasing Snapshot records saved in the memory may be: reviewed in the device indicator; transmitted into a computer; deleted. Record review In the list of snapshots saved in the memory date and time is displayed. The note “Empty” indicates empty record fields. The instructions presented below describe how to review the snapshot record: 1 Choose Instantaneous → Records. 2 Mark the record you want to review. Press “Enter”. 3 With the keys choose the pictogram of the right size from the menu line (see Table 51). Information of state line while reviewing the records Reviewing a snapshot the state line displays the date and the time of record creation. Transmission into a computer Transmission of snapshots into a computer is to be made via the software “DevComm” of “Elgama - Elektronika” Ltd. The instructions of record transmission is presented in “DevComm” manual. Record erasing 1 Choose Instantaneous → Records. 2 Choose the record and press “Enter”. The indicator displays the information about the record date and time, current clamps used, network type, and the sequence of voltage phases. Choose the command Delete. 3 In order to confirm the command press “Enter”. Erasing of all records saved 1. Choose Instantaneous → Delete Records; 2. With the key “Enter” confirm the command. 3. The indicator displays the message that all records have been deleted. Press “Enter”. 30 Portable Testing Device PTD-3G 6. NETWORK QUALITY MONITORING This chapter presents the functions of network quality monitoring and of profile records of values chosen. The first part describes the parameters of power quality measured. The following part analyses the functions of profile records of values measured, and the third part presents the order of monitoring performance. The last part of the present chapter introduces work instructions with the monitoring records saved in the memory. The settings of network monitoring and commands are placed in the menu “Monitoring”. The following functions of network quality monitoring are possible: analysis of power quality and report formation; profile record of values measured; 6.1. Analysis of power quality The device performs the following functions of power quality analysis: voltage fluctuation monitoring; frequency fluctuation monitoring. Performing the power quality monitoring permissible limits of voltage fluctuation and the value of the lowest permissible voltage are being introduced. In case the voltage falls below the defined limit in any phase not shorter than for one second, the device registers the disappearance of voltage. The maximum and the minimum permissible frequency values are indicated in frequency fluctuation monitoring. During the monitoring the device measures average voltages of each phase every 10 minutes and frequency – every 10 seconds. Moreover, it checks whether the values obtained comply with the limits defined. The following power quality parameters are calculated in accordance with the data stored: • percentage portion of time when average values of voltage or/and frequency do not comply with the limits defined (in case the average voltage or frequency values do not comply with the limits defined during the period, it is maintained that the value does not comply with the limits defined during all period duration); • the number of power outages in each phase and power outages in all phases power outage is registered if it have taken not shorter than 1 second). Power quality report is being formulated according to the results of the whole monitoring period. It is saved in the device memory. Up to 32 power quality reports may be saved in the device memory. (see chapter 6.4). 6.2. Profile record The device may record up to 6 any profiles of values measured. For each profile register it is possible to choose one out of five algorithms: • Instant value at the end of measuring period (instant); • Minimum value during the measuring period (minimum); • Average value of measuring period (average); • Maximum value during the measuring period (maximum); • Standard deviation (Stdev). 31 User Manual Version 2.0 Measuring period –interval of time during witch the minimum, average, maximum values and standard deviations are being calculated. Measuring period for all channels is the same. Possible period values are from 10 s to 3600 s (1 hour). 6.3. Monitoring performance order In order to perform network quality monitoring, it is required to define the monitoring settings described below: 6.3.1. Monitoring settings Test identification (Test ID). Monitoring number. Any integer from 0 to 255. Setting order: 1. Choose Monitoring → Test ID. 2. Record test number. Active functions. During the network monitoring the power quality analysis or/and profile record of values chosen may be performed simultaneously. During monitoring only activated functions are performed. The meanings of activity indicators, and the function choice order are all identical to those described in chapter 4.1.3. Function activation order of monitoring is presented below: 1. Choose Monitoring → Select PQM. 2. The list of functions and their activity indicators are shown on the display. Select the monitoring functions needed. (see chapter 4.1.3). 6.3.2. Function settings Settings of power quality analysis 1 Choose Monitoring → Power Quality; 2 Input the limits of voltage and frequency: a) Umax – maximum allowed voltage value; b) Umin – minimum allowed voltage value; c) Uoff – in case the voltage value falls below the limits for longer than one second, it is registered as voltage disappearance; d) Fmax – maximum allowed frequency value; e) Fmin – minimum allowed frequency value; 3 In case you want to return to the former menu, press “Clear”. Note: it is allowed to return to menu in case voltage and frequency limits are entered correctly (Umax is bigger than Umin, Uoff is less than Umax and Umin, and Fmax is bigger than Fmin). Profile settings. The following profile registration provisions are to be defined: • Choose the channel in which the profile will be registered, • Define all provisions of the channel chosen: o Choose the value measured, o Delete the algorithm registered, o Determine the measuring period. Measuring period is the same for all channels. 32 Portable Testing Device PTD-3G Channel – memory area allocated for the data of one profile. Setting of profile parameters is described below. In case at least one parameter is not set (the meaning “None”), the profile is not registered in this channel. Choice of channel 1 Choose Monitoring → Profiles. Press “Enter”. 2 Choose Channel. The channel for profile registration is indicated in this field. Channel numbers are zero based. Press “Enter”. 3 Choose the channel. Channel number may be increased with the key ↑↓, and decreased with . Press “Enter”. In case the value measured and its registration algorithm have been chosen earlier in the channel settings registered, in the line “Value” abbreviated title of value chosen is indicated, and in the line “Algorithm” – profile registration algorithm chosen. In case these values are not indicated in channel settings, both lines will bear the note “None”. Indication of value measured 1 Choose the line Value. In this field the value measured, the profile of which will be registered, is presented. Press “Enter”. 2 With the keys and ↑↓, choose the value measured. Press “Enter”. In the line “Value” abbreviated titles of values measured are indicated. All values measured and their abbreviated titles are presented in Table 6-1. Choice of algorithm 1. Choose the line Algorithm. Algorithm of profile registration is indicated in this field. Press “Enter”. 2. With the keys and ↑↓ choose the algorithm of profile registration. Delete the algorithm of profile registration. Press “Enter”. The line shows abbreviated titles of algorithms (see chapter 6-2). Registration of measuring period 1. Choose the line Time base. Press “Enter”. 2. Register the duration of measurable period in seconds. The line Duration presents maximum duration of profile registration in case measuring period is indicated. The duration of measuring period may be in range 10s to 3600s. Channel capacity - 1024 of values. The maximum duration of profile registration is to be calculated according to the following formula: t= 1024 ⋅ t p 3600 where t – the maximum duration of profile registration in hours, tp – duration of measurable period. Review of channel settings The order of review of channel settings is presented below. 1 Choose Monitoring → Profiles. 33 User Manual Version 2.0 2 In the line Channel choose the channel the settings of which you want to review. The lines Value and Algorithm display the value attributed to this channel and the algorithm of its profile registration. Table 6-1 Title Full Active positive power of all phases summed Active negative power of all phases summed Reactive power of all phases summed in quadrant I Reactive power of all phases summed in quadrant II Reactive power of all phases summed in quadrant III Reactive power of all phases summed in quadrant IV Total positive power of all phases summed Total negative power of all phases summed Aggregate power factor cosϕ Frequency Active power in phase L1 Reactive power in phase L1 Current in phase L1 Voltage in phase L1 Power factor cosϕ of phase L1 Active power in phase L2 Reactive power in phase L2 Current in phase L2 Voltage in phase L2 Power factor cosϕ of phase L2 Active power in phase L3 Reactive power in phase L3 Current in phase L3 Voltage in phase L3 Power factor cosϕ of phase L3 Abbreviated +P (L sum) -P (L sum) Q I (L sum) Q II (L sum) Q III(L sum) Q IV (L sum) +S (L sum) -S (L sum) PF (Res) f (Res) P (L1) Q (L1) I (L1) U (L1) PF (L1) P (L2) Q (L2) I (L2) U (L2) PF (L2) P (L3) Q (L3) I (L3) U (L3) PF (L3) 6.3.3. Start of monitoring Check the monitoring settings once more. 1 Choose Monitoring → Start; 2 The list of functions and their activity indicators are presented on the display. Press “Enter” (if you want to activate other tests, press “Clear”). 3 The following information is presented on the indicator during the monitoring: a) date and time of the beginning of monitoring; b) time from the begging of monitoring (dd hh:mm:ss); c) the line of profile registration where the channel part filled is presented graphically and in numbers. To cancel monitoring, press “Enter”. In case during the monitoring power outages occur, monitoring is performed further if network voltage appears at least in one phase. 34 Portable Testing Device PTD-3G 6.4. Work with records Up to 32 results of network quality monitoring may be saved in the device memory. The following information may be stored in each record: report of power quality analysis; up to 6 profiles of measuring values. Results of network monitoring saved in the memory may be: reviewed in the device indicator; transmitted into a computer; deleted from the memory. 6.4.1. Record review on the display The results of network monitoring saved in the device memory are identified according to the date and time of the beginning of monitoring (MM/mm/dd hh:mm). Unfilled records are indicated as “Empty”. Review of monitoring results is to be performed by the following way: • Choose Monitoring → Storage → Review Records. • Record list appears on the indicator. Choose the record and press “Enter”. • Detailed information about the test is presented on the indicator: o test ID; o date and time of the beginning; o duration of monitoring; o list of tests (the word “Yes” is by the tests performed, and the word “No” – not performed); • Mark the test performed and press “Enter”. The indicator presents the results of the test performed. Test results The results of network monitoring are presented in two tables The first table includes: voltage and frequency limits; percentage part of time when voltage did not comply with the limits determined (the results are presented for each phase separately); percentage part of time when frequency did not comply with the limits determined. The second table includes: numbers of power outages in each phase; number of power outages in all phases. The display presents the list of profiles recorded while reviewing the profiles of instantaneous values recorded (of record chosen). The graph of profile is being introduced when choosing the profile and pressing “Enter”. 35 User Manual Version 2.0 Additional profile functions may be used while reviewing profile drawing: Move of axis X. It is switched on with the key 1. With the key move forward, and with the key ↑↓ return back. change of scale of axis X. It is switched on with the key 2. With the key the scale is increased, and with the key ↑↓ it is decreased. change of scale of axis Y. It is switched on with the key 5 when you want to change it considerably. It is switched on with the key 4 when you want to change it slightly. With the key ↑↓ the scale is increased, and with the key it is decreased. Information of state line reviewing the records The following information is displayed in the state line while reviewing the profiles registered: date and time of a record; keys of additional functions and their purpose; algorithm of profile registration used. While reviewing the reports of network quality monitoring the state line indicates the date and time of the record. 6.4.2. Record erasing Monitoring results saved in the memory may be deleted one by one or all records at once. Erase of record. • Choose Monitoring → Storage → Review Record. • Choose the record from the list. • Detailed test information is presented on the display. Choose the last line Delete Record. • Warning message appears on the display. Confirm the choice by pressing “Enter” (“Clear” cancels action). Elimination of all records • Choose Monitoring → Storage → Delete All. • Warning message appears on the display. Confirm the choice by pressing “Enter” (to cancel action, press “Clear”). 36 Portable Testing Device PTD-3G 7. DEVICE KIT AND WARRANTIES 7.1. Device Kit Kit of the PTD-3G device: No. Component Quantity 1. PTD-3G unit 1 2. Current clamps C112 (1000 A) 3 3. Current clamps M1.M (100 A) 3 4. Wires for current clamp connection with safety sockets for output (red) 3 5. Wires for current clamp connection with safety sockets for output (black) 3 6. Wire for voltage neutral connection with safety sockets for output (black) 1 7. Wires for voltage phase connection with safety sockets for output (red) 3 8. Conductor terminal “crocodile” for neutral connection (black) 1 9. Conductor terminal “crocodile” for voltage phase connection (red) 3 10. Optical scanning head 1 11. Cable Null-modem 1 12. Auxiliary power supply cable 1 13. Software DEVcom (CD) 1 14. Tool case 1 15. PTD-3G unit leather tool case 1 16. PTD-3G User manual 1 17. OSS User manual 1 18. Software DEVcom User manual 1 19. Calibration Certificate 1 20. Current clamp PINCE C112 User manual 1 21. Current clamp M1.M specification 1 Note, that kit composition can be changed according to order agreement with customer. 37 User Manual Version 2.0 7.2. Warranty Device complies requirements of standard IEC EN 61010 in case the device is used in conformity with transportation, storage and exploitation requirements. Warranty time for meter storage is 6 months from manufacturing date. Warranty term of device use is 36 months from manufacturing date. Repairs and replacements of the device under warranty will be made without charge. Warranty does not applies to the device if: Device was used not in conformity with transportation, storage, exploitation requirements and safety requirements; • Any item including current clamps wires, voltage wires, and other items from third parts was used with device instead of original items from device kit; • Any item was used from device kit, which is damaged case, insulation or any other damages; • The LCD display of the device or case of electronic block or seals is damaged; • The device was damaged by lightning or due to incorrect installation. Calibration certificate Portable Testing Device PTD – 3G, serial number ________________ complies with the requirements of IEC EN 61010 standard, is calibrated and is suitable for use. Number of calibration certificate_______________ Date of manufacturing Manufacturer representative ______________________________ (seal and signature) 38


![CAST for PSI user`s manual [v07]](http://vs1.manualzilla.com/store/data/005903758_1-a858c2dfda3ffb28451a6ec48d1cfa02-150x150.png)