1
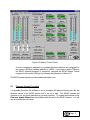
MCAP
MULTI-CHANNEL AUDIO PROCESSOR
"Creating New Directions in Digital Audio Electronics"
MCAP
MULTI-CHANNEL AUDIO PROCESSOR
User's Manual
Version 4.2
Revised
May 10, 2000
Document Number 960598A
Digital Audio Company
A DRI Company
5121 Holly Ridge Drive
Raleigh, NC 27612
Phone: 877 5DACAUD (532 2283)
Fax: 877 5DACFAX (532 2329)
www.dacaudio.com
Copyright © 2000 by Digital Audio Company
All rights reserved.
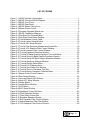
TABLE OF CONTENTS
FOREWORD ................................................................................................................. vii
1. SYSTEM BASICS........................................................................................................ 1
1.1 System Configuration ........................................................................................... 1
1.2 External Processor Capability............................................................................... 2
1.3 External Processor Front Panel ............................................................................ 3
1.4 External Processor Rear Panel ............................................................................ 5
2. INSTALLATION INSTRUCTIONS ............................................................................... 6
2.1 Cautions to User ................................................................................................... 6
2.2 Installation Procedure........................................................................................... 6
2.3 Firmware Update Procedure................................................................................. 8
3. GETTING STARTED ................................................................................................. 10
3.1 Fast Start ............................................................................................................ 10
3.2 MCAP Tutorial .................................................................................................... 13
3.3 Training CD Recording ....................................................................................... 29
4. MCAP SOFTWARE REFERENCE MANUAL ............................................................ 31
4.1 Master Control Panel .......................................................................................... 31
4.2 Input and Output Processors .............................................................................. 35
4.2.1 Input Path Delay Lines ................................................................................ 35
4.2.2 Input and Output Highpass Filters (HPFs)................................................... 36
4.2.3 Digitally-Controlled Limiter .......................................................................... 38
4.2.4 Digitally-Controlled AGC ............................................................................. 40
4.2.5 On-Screen Headphone Control ................................................................... 41
4.3 DSP Processor Selection ................................................................................... 42
4.3.1 Filter Selection Window............................................................................... 42
4.3.2 Equalizer Selection Window........................................................................ 44
4.4 DSP Filter Control Windows ............................................................................... 44
4.4.1 Ref Canceller (formerly 2CH Adaptive) Filter .............................................. 45
4.4.2 1CH Adaptive Filter ..................................................................................... 48
4.4.3 Lowpass Filter ............................................................................................. 52
4.4.4 Highpass Filter ............................................................................................ 53
4.4.5 Bandpass Filter............................................................................................ 55
4.4.6 Bandstop Filter ............................................................................................ 58
4.4.7 Comb Filter .................................................................................................. 60
Page i
4.4.8 Inverse Comb Filter ..................................................................................... 63
4.4.9 Notch Filter .................................................................................................. 65
4.4.10 Multiple Notch Filter..................................................................................... 67
4.4.11 Slot Filter ..................................................................................................... 69
4.4.12 Multiple Slot Filter........................................................................................ 71
4.4.13 Spectral Inverse Filter ................................................................................. 74
4.4.14 Hi-Res Graphic Filter................................................................................... 85
4.4.15 20-Band Graphic Filter ................................................................................ 92
4.4.16 Tri Parametric Filter ..................................................................................... 93
4.4.17 Limiter/Compressor/Expander ..................................................................... 95
4.5 DSP Equalizer Control Windows ........................................................................ 99
4.5.1 20-Band Graphic Equalizer ......................................................................... 99
4.5.2 Spectral Graphic Equalizer........................................................................ 101
4.5.3 Dual Parametric Equalizer......................................................................... 102
4.5.4 Limiter/Compressor/Expander ................................................................... 102
4.6 DSP Display Selection...................................................................................... 103
4.6.1 Spectrum Analyzer and Coefficient Display Buttons ................................. 103
4.6.2 Display Select Window.............................................................................. 103
4.7 Spectrum Analyzer Window.............................................................................. 104
4.8 Coefficient Display Window.............................................................................. 108
4.9 Master Control Pulldown Menus ....................................................................... 111
4.9.1 Storing Setups to Disk Files ...................................................................... 111
4.9.2 Recalling Setups from Disk Files............................................................... 112
4.9.3 Viewing DSP Displays ............................................................................... 114
4.9.4 Storing Setups to External Processor Stand-Alone Memories .................. 114
4.9.5 Generating Setup Reports......................................................................... 116
4.9.6 Getting Online Help ................................................................................... 116
5. OPERATING MCAP STAND-ALONE...................................................................... 118
6. MCAP CUSTOMIZATION OPTIONS....................................................................... 120
6.1 Configuring MCAP for Different COM Ports...................................................... 120
6.2 Configuring MCAP for Different Baud Rates .................................................... 121
6.3 Customizing Screen Colors .............................................................................. 123
6.4 Operating a Remote MCAP via Modem............................................................ 123
7. DEDICATED 920-LINE SPECTRUM ANALYZER OPERATION ............................. 126
8. PASSTHRU REMOTE MCAP OPERATION............................................................ 127
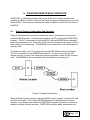
8.1 General System Configuration And Operation ................................................. 127
Page ii
8.2 Program Features and Options ........................................................................ 128
8.2.1 PASSTHRU Program Icon......................................................................... 128
8.3 PASSTHRU Program Main Screen................................................................... 129
8.3.1 PASSTHRU Configure Drop-Down Menu.................................................. 130
8.4 Program Operation ........................................................................................... 131
8.4.1 Base Location - One Time Initialization Only ............................................ 132
8.4.2 Remote Location - One Time Initialization Only ........................................ 132
8.4.3 Remote Location - Normal Operation Each Session ................................. 133
8.4.4 Base Location - Normal Operation Each Session ..................................... 134
8.4.5 In Case Of Trouble .................................................................................... 134
9. MCAP SPECIFICATIONS........................................................................................ 136
Page iii
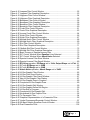
LIST OF FIGURES
Figure 1-1: MCAP System Configuration ........................................................................ 1
Figure 1-2 MCAP Functional Block Diagram................................................................... 3
Figure 1-3 MCAP Front Panel ......................................................................................... 4
Figure 1-4 MCAP Rear Panel.......................................................................................... 5
Figure 2-1 MCAP Master Control Icon ............................................................................ 7
Figure 2-2 Master Control Panel ..................................................................................... 8
Figure 2-3 Firmware Upgrade Wizard Icon ..................................................................... 9
Figure 3-1 MCAP Connection Diagram ......................................................................... 11
Figure 3-2 Fast Start File Pulldown Menu ..................................................................... 12
Figure 3-3 Fast Start Recall Setup Window .................................................................. 12
Figure 3-4 Tutorial Master Control Panel ...................................................................... 14
Figure 3-5 Tutorial Limiter Setup Window..................................................................... 16
Figure 3-6 Tutorial AGC Setup Window........................................................................ 17
Figure 3-7 Tutorial Filter Selection Window and Combo Box ....................................... 18
Figure 3-8 Tutorial 1CH Adaptive Filter Control Window .............................................. 18
Figure 3-9 Tutorial Lowpass Filter Control Window ...................................................... 19
Figure 3-10 Tutorial Equalizer Selection Window ......................................................... 20
Figure 3-11 Tutorial 20-Band Graphic Equalizer Control Window ................................ 21
Figure 3-12 Tutorial Store 20-Band Graphic Equalizer Window ................................... 21
Figure 3-13 Tutorial Recall 20-Band Graphic Equalizer Window.................................. 23
Figure 3-14 Tutorial Spectrum Analyzer Window.......................................................... 24
Figure 3-15 Tutorial Display Select Menu ..................................................................... 25
Figure 3-16 Tutorial File Pulldown Menu ...................................................................... 26
Figure 3-17 Tutorial Save Setup File Window .............................................................. 26
Figure 3-18 Tutorial Store in File Name Text Box ......................................................... 27
Figure 3-19 Tutorial Report Generator Pulldown Menu ................................................ 28
Figure 4-1 Master Control Panel Features .................................................................... 31
Figure 4-2 Path Delay Window ..................................................................................... 35
Figure 4-3 Input and Output HPF Buttons ..................................................................... 37
Figure 4-4 Input HPF Setup Window............................................................................. 37
Figure 4-5 Limiter Button............................................................................................... 38
Figure 4-6 Limiter Setup Window.................................................................................. 39
Figure 4-7 AGC Button .................................................................................................. 40
Figure 4-8 AGC Setup Window ..................................................................................... 41
Figure 4-9 Headphone Control Window........................................................................ 42
Figure 4-10 Filter Selection Window ............................................................................. 43
Figure 4-11 Filter Select Combo Box ............................................................................ 43
Figure 4-12 Equalizer Selection Window ........................................................................ 44
Figure 4-13 Ref Canceller Filter Control Window ......................................................... 45
Figure 4-14 Adjust Maximum Filter Size Window.......................................................... 46
Figure 4-15 1CH Adaptive Filter Control Window ......................................................... 49
Page iv
Figure 4-16 Lowpass Filter Control Window ................................................................... 52
Figure 4-17 Lowpass Filter Graphical Description ........................................................ 53
Figure 4-18 Highpass Filter Control Window ................................................................ 54
Figure 4-19 Highpass Filter Graphical Description ....................................................... 55
Figure 4-20 Bandpass Filter Control Window ............................................................... 56
Figure 4-21 Bandpass Filter Graphical Description ...................................................... 58
Figure 4-22 Bandstop Filter Control Window ................................................................ 59
Figure 4-23 Bandstop Filter Graphical Description ....................................................... 60
Figure 4-24 Comb Filter Control Window...................................................................... 61
Figure 4-25 Comb Filter Graphical Description............................................................. 63
Figure 4-26 Inverse Comb Filter Control Window ......................................................... 64
Figure 4-27 Notch Filter Control Window...................................................................... 66
Figure 4-28 Notch Filter Graphical Description ............................................................. 67
Figure 4-29 Multiple Notch Filter Control Window ........................................................ 68
Figure 4-30 Multiple Notch Filter Graphical Description ............................................... 69
Figure 4-31 Slot Filter Control Window ......................................................................... 70
Figure 4-32 Slot Filter Graphical Description ................................................................ 71
Figure 4-33. Multiple Slot Filter Control Window ............................................................. 72
Figure 4-34 Multiple Slot Filter Graphical Description................................................... 73
Figure 4-35 Basic Process of Spectral Inverse Filter .................................................... 75
Figure 4-36 SIF Control Window When Equalize Voice Selected................................ 76
Figure 4-37 SIF Control Window When Attack Noise Selected................................... 78
Figure 4-38 Spectral Inverse Filter Store Window ........................................................ 80
Figure 4-39 Spectral Inverse Filter Recall Window....................................................... 80
Figure 4-40 EQ Voice operation, EQ Range set to 10db, Output Shape set to Flat .. 81
Figure 4-41 SIF with EQ Range set to 20dB ................................................................ 82
Figure 4-42 SIF with EQ Range set to 50dB ................................................................ 83
Figure 4-43 Attack Noise operation, Attack Range set to 30dB................................. 84
Figure 4-44 Hi-Res Graphic Filter Window ................................................................... 85
Figure 4-45 Hi-Res Filter Store Window ....................................................................... 86
Figure 4-46 Hi-Res Graphic Filter Recall Window ........................................................ 87
Figure 4-47 New Hi-Res Graphic Filter Display ............................................................ 87
Figure 4-48 Hi-Res Graphic Draw in Progress.............................................................. 89
Figure 4-49 Completed Hi-Res Graphic Draw............................................................... 89
Figure 4-50 Hi-Res Graphic Edit Window ..................................................................... 90
Figure 4-51 Hi-Res Graphic Define Edit Region ........................................................... 90
Figure 4-52 Hi-Res Edit In Progress ............................................................................. 91
Figure 4-53 Completed Hi-Res Graphic Edit................................................................. 91
Figure 4-54 Normalized Hi-Res Graphic Filter .............................................................. 92
Figure 4-55 Tri Parametric Filter ................................................................................... 94
Figure 4-56 Graphical Representation of a Parametric Filter........................................ 95
Figure 4-57 Limiter/Compressor/Expander Control Window......................................... 97
Figure 4-58 20-Band Graphic Equalizer Control Window ........................................... 100
Figure 4-59 Dual Parametric Filter .............................................................................. 102
Page v
Figure 4-60 Spectrum Analyzer and Coefficient Display Buttons................................ 103
Figure 4-61 Display Select Window ............................................................................ 103
Figure 4-62 Spectrum Analyzer Window..................................................................... 105
Figure 4-63 Coefficient Display Window ....................................................................... 109
Figure 4-64 Store Setup File Window........................................................................... 112
Figure 4-65 Recall Setup File Window ......................................................................... 113
Figure 4-66 Stand-Alone Pulldown Menu...................................................................... 115
Figure 4-67 Auxiliary Switch Function Window ............................................................. 115
Figure 4-68 ReportGenerator Pulldown Menu............................................................... 116
Figure 4-69 Help Pulldown Menu ................................................................................ 117
Figure 6-1 ComPort Selection Menu............................................................................. 120
Figure 6-2 BaudRate Selection Menu ........................................................................... 122
Figure 6-3 Remote Connect ComPort Selection Menu ............................................... 124
Figure 6-4 Modem Phone Number / Password Window ................................................ 124
Figure 8-1 System Configuration .................................................................................. 127
Figure 8-2 PASSTHRU Program Icon ......................................................................... 128
Figure 8-3 PASSTHRU Program Main Screen............................................................ 129
Figure 8-4 Configure Drop-Down Menu ...................................................................... 130
Figure 8-5 Advanced Session Setup Screen............................................................... 131
Figure 8-6 Set Entry Password Screen ....................................................................... 131
Page vi
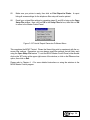
FOREWORD
The MCAP Multi-Channel Audio Processor is a new and powerful digital audio processor.
The MCAP offers the following advantages over other PC-based audio processors:
•
Compact rack-mountable packaging.
•
Both 9-18 VDC and 110/220 VAC (50/60Hz) auto-sensing supplies are built-in - no
external AC adaptor is required.
•
Up to thirteen stages of mono enhancement processing (nine stereo stages), including
digital parametric equalizers.
•
Four analog signal inputs (1 PRI + 3 REFs mono, LEFT+RIGHT+LREF+RREF stereo),
two analog signal outputs.
•
AES/EBU digital audio interface with selectable digital output sample rate.
•
Path Correction delay lines on all four signal inputs to correct for gross delay mismatch
(ie, satellite delays).
•
Dedicated D/A converter for headphone output, allowing non-intrusive monitoring of any
digital filter output.
•
All WindowsTM-based control: versatile configuration and easy adjustment.
•
Controlled by a laptop or desktop computer (minimum of 800x600 pixel display
required).
•
Built-in dual channel 920-line FFT spectrum analyzer with dedicated RS232 output.
•
Built-in digital filter coefficient display.
•
Disk file storage/recall of filter setups.
•
Stand-alone operation allowing the MCAP to be operated at desired settings without
PC.
•
Report generator for hardcopy printouts and word processor files of filter setups.
•
Unmatched flexibility and performance.
Page vii
The MCAP is applicable to a broad spectrum of voice and similar audio signals. It attacks a
wide variety of noises in forensic applications. Body microphone, cassette, microcassette,
telephone, broadcast, and hi-fi audio signals can all be processed efficiently, since the
MCAP can be set to operate at bandwidths of 3.2, 5.4, 6.5, 8.0, 11, and 16 kHz.
The MCAP is designed to replace an entire rack of audio processing equipment. With
monophonic signals, as many as thirteen sequential stages of processing (twelve of which
are digital) can be performed simultaneously. With stereo signals, nine sequential stages
of stereo processing (eight of which are digital) for each channel are also available. The
digital stages can implement a broad selection of filter types.
An easy-to-use Microsoft Windows-based Master Control program allows intuitive control of
the entire process, including bandwidth selection, mono/stereo configuration, and number
of digital processing stages. Individual process controls and filter modes for each digital
stage are easily specified. Input and output level bargraphs are displayed, and the signal
frequency spectrum at any point in the process can be displayed utilizing the MCAP's builtin 920-line spectrum analyzer.
Page viii
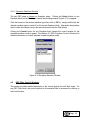
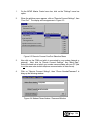
1. SYSTEM BASICS
1.1
System Configuration
The basic configuration of the MCAP system is illustrated in Figure 1-1:
Figure 1-1: MCAP System Configuration
The MCAP Master Control program is written to be run on any Microsoft Windows
95/98/NT IBM PC-compatible computer. For best performance the following minimum
system is recommended:
•
Intel Pentium CPU processor (at least 166 MHz)
•
32 Megabytes of RAM
•
2.1 GB hard disk drive
•
CD-ROM Drive
•
800x600 color SVGA display with 0.28 or better dot pitch
•
Two-button mouse
•
At least one spare RS232 port
•
Laser or dot-matrix printer
Performance will improve with higher speed CPUs.
Page 1
1.2
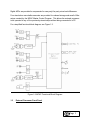
External Processor Capability
The MCAP EXTERNAL PROCESSOR unit is a high-performance, self-contained digital
signal processor and contains 49 DSP microprocessors, which are allocated as follows:
•
Thirty-two FIR filter processors which can be configured as a single 8192-tap
adaptive digital filter or up to 8 1024-tap independent audio processors. These
flexible processors may be combined into mono and stereo configurations. Any of
the processors may be configured as an adaptive or adjustable digital filter.
•
Two FIR fixed filter processors which are dedicated as output spectral equalizers.
•
Two 65536-times oversampling FIR filter processors which allow the AES/EBU
digital audio input sample rate to be converted to the MCAP’s sample rate for
processing, then back to the specified AES/EBU digital audio output sample rate for
recording onto a DAT.
•
Three FIR fixed filter processors which perform up to 4X oversampling for the analog
inputs and outputs.
•
Six FIR fixed filter processors which perform digital highpass (rumble) filtering on all
inputs (pre-process) and all outputs (post-process) with adjustable cutoff.
•
Four general-purpose microprocessors which execute special DSP software,
implement the dual FFT spectrum analyzer, communicate with the PC via RS232,
and provide system control.
Programmable-gain input amplifiers allow input levels to be adjusted either on-screen
(when operating under PC CONTROL) or by front panel knobs (when operating STANDALONE).
Microprocessor-controlled limiters are provided on all four analog inputs to prevent
overload.
Analog-to-digital conversion is performed by two stereo sigma-delta 16-bit converters which
64X oversample the incoming analog audio. Digital-to analog conversion is performed by
two stereo delta-sigma 16-bit converters (one for line output, one for headphone output)
which 64X oversample the output audio.
The base sample rate is adjustable from 7.2 kHz (3.2 kHz bandwidth) to 36 kHz (16 kHz
bandwidth). All sample rates are exact multiples of 50 Hz and 60 Hz, allowing maximum
filter performance at harmonics of these frequencies.
Page 2
Digital AGCs are provided to compensate for near party/ far party voice level differences.
Four stand-alone nonvolatile memories are provided for onboard storage and recall of filter
setups created by the MCAP Master Control Program. This allows the external processor
to be operated in any of four previously-stored setups without being connected to a PC.
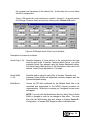
For a simplified functional block diagram, see Figure 1.2.
Figure 1-2 MCAP Functional Block Diagram
1.3
External Processor Front Panel
Page 3
The front panel controls are arranged into three logical groups: HEADPHONE
MONITORING controls, STAND-ALONE controls, and input level controls.
The MONITOR switch allows the user to listen to either the MAIN INPUTS, the REF
INPUTS, or OUTPUTS signals with a pair of stereo headphones connected to either of the
two 1/4" PHONES jacks. The SELECT switch allows the user to listen to the signals in
STEREO, or to focus on either the LEFT or the RIGHT signal. Switching the MONITOR or
the SELECT switch does not alter the signal flow to the LEFT and RIGHT analog line
output BNC connectors. The VOLUME can be adjusted to a comfortable listening level.
The STAND-ALONE controls allow the user to select and run one of four previouslyprogrammed filter setups stored in internal nonvolatile memory. The OPERATION switch
must be set to STAND-ALONE for these special controls to become operational. For
complete instructions on using the STAND-ALONE memories, see Sections 4.9.4 and 5.
.0.
The OPERATION switch selects whether the unit is to be operated by the MCAP Master
Control program via RS232 interface to a PC (PC CONTROL setting) or in a stand-alone
configuration without a PC (STAND-ALONE setting). For complete instructions on using
the STAND-ALONE feature, see Sections 4.9.3 and 5. .0.
Note:
If the OPERATION switch is moved from STAND-ALONE to PC CONTROL while
the MCAP master control program is operating, the RS232 interface must be
reinitialized. Do so by clicking on the Settings in the menu bar and then on
Connect to Local MCAP.
The POWER switch must be switched to the ON position in order for the unit to operate.
The front panel of the MCAP external processor appears as follows (Figure 1-3):
Figure 1-3 MCAP Front Panel
The input level controls allow the user to adjust the input signals to the proper level for
STAND-ALONE processing (screen controls can be used when operating with a PC).
Tricolor LEDs are provided to indicate signal levels; when the LEDs are GREEN, the
signals are at the proper levels, while YELLOW indicates caution. RED indicates input
overload. Input signal levels are also indicated by the displayed bargraphs on the MCAP
Master Control Panel (See Section 4. ).
Page 4
1.4
External Processor Rear Panel
The rear panel of the MCAP external processor appears as follows (Figure 1-4):
Figure 1-4 MCAP Rear Panel
BNC jacks for line-level input and output signal connections are provided. Normally, the
ANALOG MAIN INPUTS are used for signal inputs, but if extra REFERENCE signals need
to be provided for Ref Canceller operation, the REF INPUTS may be used. Additionally,
XLR connectors are provided for AES/EBU digital input/output.
A two-position slide switch allows selecting between ANALOG or DIGITAL MAIN INPUTS
for the LEFT (PRI) and RIGHT (REF1) signals; the LREF (REF2) and RREF (REF3) inputs
are always analog. A second three-position slide switch allows the user to specify the
DIGITAL OUTPUT SAMPLE RATE for recording onto DAT or CD.
AC power (85-263VAC, 47-63Hz) is supplied through the AC POWER jack using the
supplied IEC line cord.
If the DC POWER option is purchased with the unit, the DC POWER jack can be used to
input 9 - 18 VDC source using the supplied pigtail.
A 9-pin RS232 jack is provided to connect the MCAP external processor to the CONTROL
PC (normally used) using the supplied cable. A second 9-pin RS232 jack and cable allows
connecting a second computer to be used as a dedicated spectrum analyzer display
(optionally used). The supplied SPEC DISP utility allows this feature to operate ( see
Section 7. ).
Page 5
2. INSTALLATION INSTRUCTIONS
2.1
Cautions to User
To install the MCAP hardware and software, the user must have a good working knowledge
of IBM PC-compatible computers and the Microsoft Windows operating environment.
Particularly, the user must know which RS232 COM ports are COM1, COM2, COM3, etc.
Usually, a serial mouse will be installed on COM1, leaving COM2 available for connecting
the MCAP external processor. If COM2 is not available in the user's PC, it will be
necessary to reconfigure the MCAP software COM port selection by performing the
procedure in Section 6.1 after completing the installation procedure in Section 2.2.
The Microsoft Windows operating environment must be in place prior to installing the
MCAP. All video drivers, device drivers, etc. must be installed and operating properly.
For advanced users who need to configure the MCAP to operate at RS232 symbol rates
slower than 38400 baud (factory default), please see Section 6.2. Note: Altering the
baud rate setting is not recommended.
2.2
Installation Procedure
1.
Carefully remove the MCAP external processor from the shipping container.
Confirm that the AC power cord, RS232 cables (2), demonstrator audio CD, and
software disk(s) are included. Also confirm that any optional accessories are
included.
2.
Make sure that the OPERATION switch on the MCAP front panel is set to the PC
CONTROL position.
3.
Connect the AC power cord to the MCAP rear panel AC POWER connector. Keep
the POWER switch OFF for now.
4.
With the MCAP POWER switch OFF, plug the AC power cord into an AC outlet.
5.
With the computer turned OFF, connect the supplied RS232 cable between the
CONTROL PC RS232 connector on the MCAP rear panel and the desired computer
COM port (You may need to purchase an adaptor if the COM port has 25 pins).
6.
Now that they are connected together, switch ON both the MCAP and the computer.
Page 6
7.
Once Windows has booted up (Windows 95/98 or NT), insert the MCAP Master
Control software CD into the CD-ROM drive in your PC. The installation program
should automatically run. If not, use the Run command in the Windows Start menu
to start the installation program.
If the machine you wish to install the MCAP Master Control Software does not have
a CD-ROM drive please contact Digital Audio Company for installation software on
diskettes.
9.
The MCAP Setup Utility will now install the MCAP Master Control software on your
PC's hard disk. Please follow any instructions displayed by the Setup Utility.
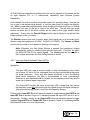
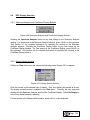
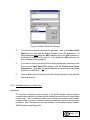
Once the Setup Utility has completed installing the software, the icon in Figure 2-1
should appear on your screen:
Figure 2-1 MCAP Master Control Icon
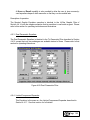
Double click on this icon now to run the program. A screen similar to Figure 2-2
should appear:
Page 7
Figure 2-2 Master Control Panel
If an error message is displayed, it is possible that the software is not configured for
the correct COM port (software defaults to COM2). If you know to which COM port
the MCAP external processor is connected, configure the MCAP Master Control
program for the correct COM port by following the procedure in Section 6.1.
The MCAP system should now be installed and ready to run.
2.3
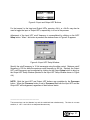
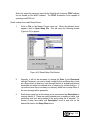
Firmware Update Procedure
It is possible that when the software is run a message will appear informing you that the
firmware version of the MCAP device itself is not up to date. The MCAP software will
continue to run, but some features may not work correctly. To update the firmware us the
Firmware Update Wizard that was installed with the rest of the MCAP software. You will
see an icon like the one below:
Page 8
Figure 2-3 Firmware Upgrade Wizard Icon
Clicking on the icon will start the Wizard which will walk you through updating. The top
cover of the MCAP will need to be removed so a Phillips head screwdriver is required.
Page 9
3. GETTING STARTED
Operation of the MCAP system is highly intuitive; most operators can quickly learn while
using. The Fast Start procedure in Section 3.1 should allow first time users to quickly begin
processing tapes and utilizing the basic enhancement capabilities of the MCAP system.
For a lesson in operating the MCAP controls, it is recommended that the user also
complete the MCAP Tutorial in Section 3.2. Section 3.3 applies the MCAP to different
noise problems contained on the MCAP Training CD.
In the following sections the Source Audio Player and an Enhanced Audio Recorder will be
referred to. The Source Audio Player can be any type of playback unit such as a CD, MiniDisk, Micro-cassette, or Digital Audio Tape (DAT) playback unit. The Enhanced Audio
Recorder can be any type of audio recorder such as a CD, Mini-disk, Micro-cassette, or
DAT recording device.
Always consider that the quality of the playback and recording media will limit the quality of
the processed and enhanced audio. The recommended device is a DAT recorder with
digital inputs because the MCAP can transfer the audio digitally. DAT recorders have
excellent bandwidth and signal-to-noise (SNR) ratio.
3.1
Fast Start
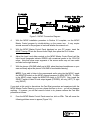
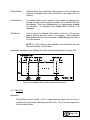
Fast start the MCAP as follows:
1.
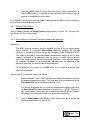
Connect the LEFT and RIGHT channel line-level audio outputs (AUDIO OUT jacks)
of your Source Audio Player to the LEFT (PRI) and RIGHT (REF1) ANALOG MAIN
INPUTS BNC jacks on the MCAP external processor rear panel as shown in Figure
3-1. Note that the RIGHT (REF1), LREF (REF2), and RREF (REF3) signals are
only used in stereo configuration and/or with the Ref Canceller Filter in any
configuration.
2.
If you wish to record the enhanced audio, connect the line-level audio inputs
(AUDIO IN jacks) of your Enhanced Audio Recorder to the LEFT (MONOUT) and
RIGHT (MONOUT) ANALOG MAIN OUTPUTS BNC jacks on the MCAP external
processor rear panel as shown in Figure 3-1.
3.
Connect your stereo headphones to either of the two PHONES jacks on the MCAP
external processor front panel as shown in Figure 3-1. Turn the phones VOLUME
control to MIN. It is also recommended that headphones be connected to the
Enhanced Audio Recorder's headphone jack to confirm that the output signal is
being properly recorded.
Page 10
Figure 3-1 MCAP Connection Diagram
4.
With the MCAP installation procedure in Section 2.2 complete, run the MCAP
Master Control program by double-clicking on the screen icon. It may require
several seconds for the program to load and initialize the external unit.
5.
With the MCAP Master Control Panel displayed on your PC screen, insert the
MCAP Training CD into the Source Audio Player, then press the PLAY button.
6.
Adjust the Input Level slider controls on the MCAP Master Control Panel until the
Input Levels bargraphs indicate GREEN with occasional peaks in the YELLOW
range. Note that some mono segments of the source audio may not have audio
recorded on the right channel.
7.
With the phones VOLUME initially set to MIN, place the stereo headphones on your
ears and slowly adjust the phones VOLUME for comfortable listening.
NOTE: If you wish to listen to the unprocessed audio going into the MCAP, toggle
the MONITOR switch on the MCAP external processor to MAIN INPUTS. To listen
to the MCAP output, toggle the MONITOR switch to OUTPUTS. Also, toggle the
SELECT switch to listen to both output signals (STEREO), left only (LEFT), or right
only (RIGHT).
If you wish at this point to discontinue the Fast Start procedure and experiment with the
MCAP Master Control Panel on your own, please feel free to do so - you will not damage
anything. If, however, you still feel unsure of what to do, please continue the Fast Start
procedure as follows:
8.
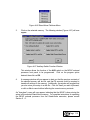
From the MCAP Master Control Panel menu bar, click on File. This will cause the
following pulldown menu to appear (Figure 3-2):
Page 11
Figure 3-2 Fast Start File Pulldown Menu
9.
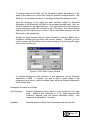
Click on Open Setup File to bring up a window similar to Figure 3-3:
Figure 3-3 Fast Start Recall Setup Window
10.
The Setup Files box should contain a list of all MCAP setup files on your hard disk.
The installation procedure in Section 2.2 should have installed several setup files
which have the .DAC extension onto your hard disk. Included in these setup files
are:
PHONE.DAC
-
Telephone audio enhancement
BODYMIKE.DAC
-
Body microphone/recorder audio enhancement
HUMBUZZ.DAC
-
Powerline hum and buzz removal
REVERB.DAC
-
Cancellation of room echoes and reverberations
Page 12
RADIOTV.DAC
-
Cancellation of radio and/or TV audio from live or
recorded audio using a reference
These basic setups should be able to enhance most voice recordings. To begin
processing audio with one of these setups, recall the desired setup file by clicking
on its filename in the Setup Files box, then click on OK.
11.
When the mouse cursor returns to normal, the setup file recall will be complete.
Toggle the MONITOR switch on the MCAP external processor between MAIN
INPUTS and OUTPUTS to hear the difference between the unprocessed input
signal and the processed output signal.
Feel free to experiment with the MCAP Master Control Panel settings - you may recall the
original setup at any time by repeating steps 8-12. If you wish to try loading any of the
other basic setup files, repeat steps 8-12.
Once you become comfortable recalling the basic setup files, it is strongly recommended
that you complete the MCAP Tutorial in Section 3.2.
3.2
MCAP Tutorial
This brief tutorial should allow the user to quickly learn the basic operation of the MCAP's
controls. It should require about 1 hour to complete, yet it demonstrates the basic
functionality.
NOTE: A subset of the MCAP's functions are utilized in this tutorial. Refer to Chapter 4. .
MCAP SOFTWARE REFERENCE MANUAL for detailed information on all of the MCAP's
functions.
Tutorial Steps:
1.
With the installation procedure in Section 2.2 completed, run the MCAP Master
Control program by double clicking the MCAP Master Control icon in Microsoft
Windows. A window similar to Figure 3-4 will appear:
Page 13
Figure 3-4 Tutorial Master Control Panel
This is the Master Control Panel, from which all features can be accessed. The
Master Control Panel is organized logically from left to right, with audio input
controls at the far left, digital processing controls in the middle, and audio output
controls at the far right.
2.
Use the mouse* to set up the Input HPF In/Out, Limiter In/Out, Output HPF In/Out,
AGC In/Out, System Bandwidth, Configuration, Number DSP Stages, Adapt
Enabled/Disabled, and Processor In/Out buttons as they are shown in Figure 3-4.
Do not set up the Filter blocks and Equalizer blocks at this time.
3.
Connect the LEFT and RIGHT outputs (AUDIO OUT jacks) of a audio player to the
LEFT and RIGHT ANALOG MAIN INPUTS jacks on the MCAP external processor.
Note: Make sure that the MAIN INPUTS switch on the rear panel is set to ANALOG.
Insert the MCAP Training CD and rewind to the beginning.
___________________________________
*
Additionally, the control buttons may be selected with the <Tab> key highlighting that button. Once
selected, the button may be toggled with the <Space> or <Enter> keys. Fast keys are also available for
buttons having an underlined letter. Pressing <Alt> in combination with the letter causes that button to
toggle, e.g. pressing <Alt-P> toggles the Processor In/Out button.
Page 14
4.
Connect a pair of stereo headphones to the PHONES jack on the MCAP external
processor. Switch the MONITOR switch to MAIN INPUTS, switch the SELECT
switch to LEFT, and adjust the headphone VOLUME control to MIN. Mono
headphones should not be used.
5.
Play the demonstration audio. Adjust the MAIN INPUTS level knobs on the MCAP
so that the peak audio level, as measured by the bargraphs, is approximately -6 dB.
Alternately, click on Settings, then uncheck Enable Panel Input Level Controls to
use the input level “sliders” on the MCAP Master Control Panel instead of the front
panel knobs.
NOTE: The audio needs to be playing throughout this tutorial. If you reach the end
of the audio before completing the tutorial, please restart it (some CD players allow
a track to be continually repeated.)
6.
With the demonstration audio playing, slowly increase the headphone VOLUME
until audio can be clearly heard.
7.
Click on the Filter button in both the Filter 1 block and the Filter 2 block until both
buttons indicate Filter Out (bypassed).
8.
Click on the Equalizer button in the Equalizer block until the button indicates
Equalizer Out (bypassed).
9.
Switch the MONITOR switch on the MCAP external processor to the OUTPUTS
position. Readjust the headphone VOLUME if necessary.
10.
Switch the Input HPF in and out by clicking on the Input HPF button in the Input
Levels block. You should hear the low frequency effects of this control. Restore the
button to the Input HPF Out indication.
11.
Switch the Output HPF in and out by clicking on the Output HPF button in the
Output Levels block. You should hear the low frequency effects of this control.
Restore the button to the Output HPF Out indication.
12.
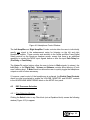
Click on the Limiter Setup button in the Input Levels block. The following window
(Figure 3-5) will appear:
Page 15
Figure 3-5 Tutorial Limiter Setup Window
13.
Use the mouse to set the Release Time to 0.250 seconds and the Threshold to
-9dB, as shown in Figure 3-5. Click on OK when done*.
14.
Adjust the headphone VOLUME control to MIN. Adjust the inputlevels to maximum.
This should cause the MCAP audio inputs to overload (this will not damage the unit
but will distort the audio). The tricolor level LED should indicate RED on peaks, and
the Left bargraph in the Input Levels block should be frequently popping up into the
RED zone, indicating overload.
15.
Slowly increase the headphone VOLUME until distorted audio can be clearly heard.
16.
Switch the Limiter In and Out by clicking on the Limiter button in the Input Levels
block. You should notice the indicated bargraph levels decrease to -9dB and the
audio quality (as heard through the headphones) dramatically improve whenever the
button indicates Limiter In. The input limiter is electronically lowering the INPUT
LEVEL to avoid overload. Restore the button to the Limiter Out position and
restore the input levels to normal.
17.
Click on the AGC Setup button in the Output Levels block. The following window
(Figure 3-6) will appear:
___________________________________
*
If you try to click anywhere on the Master Control Panel while a control window (such as the Limiter Setup
window) is displayed, a warning beep will sound, indicating that you need to first close the control window by
clicking the OK button.
Page 16
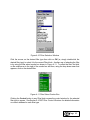
Figure 3-6 Tutorial AGC Setup Window
Use the mouse to set the Release Time to 200 milliseconds and the Maximum Gain
to 20dB, as shown in Figure 3-6. Make sure the AGC button indicates AGC Out.
Click on OK when done.
18.
Reduce the input level until the Output Level Bargraphs indicate a peak signal level
of approximately -36dB.
19.
Switch the AGC in and out by clicking on the AGC button in the Output Levels block.
You should notice the output level bargraphs slowly increase to approximately
-18dB indicated level and the audio level as heard through the headphones
dramatically increase whenever the button indicates AGC In. The AGC attempts to
make the Output Level constant and is useful in near party/far party situations.
Restore the button to the AGC Out indication, and restore the input levels to normal.
20.
Click on the Select button in the Filter 1 block. A window similar to the one in
Figure 3-7 will appear. Use the mouse to click on 1CH Adaptive, then OK*. The
Filter 1 block should now indicate that the selected mode is 1CH Adaptive.
Alternately, click the “down arrow” button on the Filter 1 combo box to select 1CH
Adaptive from the drop-down menu.
___________________________________
*
Double-clicking the desired filter mode will avoid having to click the OK button.
Page 17
Figure 3-7 Tutorial Filter Selection Window and Combo Box
21.
Select Lowpass for the Fitler 2 block using the same technique as in step 20.
22.
Click on the Control button in the Filter 1 block. The window in Figure 3-8 will
appear:
Figure 3-8 Tutorial 1CH Adaptive Filter Control Window
This is the 1CH Adaptive Filter Control Window. It is used to select Filter Size,
Adapt Rate, Prediction Span, and Adapt Mode. It also permits configuration of the
Page 18
filter for Conditional Adaptation (see Section 4.4.2 for further information on how to
setup this filter).
23.
Use the mouse to set all controls to match the settings shown in Figure 3-8*. Do not
click on the OK button at this time.
24.
Listen to the filter OUTPUT through your headphones. Note the effect on the signal
as the Filter button is toggled between Filter In and Filter Out. You should notice a
reduction in background noise whenever the button indicates Filter In. Press the
Clear button to cause Filter 1 to readapt to the input signal.
25.
Restore the Filter button to the Filter Out indication and click on OK to exit the 1CH
Adaptive Filter Control Window.
26.
Click on the Control button in the Filter 2 block. The window in Figure 3-9 will
appear:
Figure 3-9 Tutorial Lowpass Filter Control Window
This is the Lowpass Filter Control Window. It is used to select Cutoff Frequency,
Stopband Attenuation, and Transition Slope.
27.
Use the mouse to set all controls to match the settings shown in Figure 3-9. Do not
click on the OK button at this time.
28.
Listen to the filter OUTPUT through your headphones. Note the effect on the signal
as the Filter button is toggled between Filter In and Filter Out. You should notice a
dramatic reduction in high-frequency sound whenever the button indicates Filter In.
___________________________________
*
Scroll bars are used throughout the MCAP to adjust various filter parameters. Drag the scroll box "slider" or
click within the scroll bar to make coarse adjustments. Click on the scroll arrows on either end of the scroll bar
to make fine adjustments.
Page 19
Try adjusting the Cutoff Frequency control to various settings; as the Cutoff
Frequency is increased, you should hear high-frequency sounds increase, and as
Cutoff Frequency is reduced, high-frequency sounds will be reduced.
29.
Click on OK to exit the Lowpass Filter Control Window.
30.
Click on the Filter button in the Filter 2 block until it indicates Filter Out.
31.
Click on the Equalizer button in the Equalizer block until it indicates Equalizer In.
32.
Click on the Select button in the Equalizer block. The window in Figure 3-10 will
appear.
Figure 3-10 Tutorial Equalizer Selection Window
Use the mouse to click (try double clicking to avoid clicking on OK) on 20-Band
Graphic. The Equalizer block should now indicate that the selected mode is 20Band Graphic.
33.
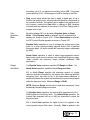
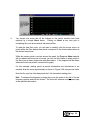
Click on the Control button in the Equalizer block. The window in Figure 3-11 will
appear.
This is the 20-Band Graphic Equalizer Control Window. The twenty vertical scroll
bars, or "sliders", are used to set the equalizer attenuation for each of the 20
frequency bands.
34.
Use the mouse to set all sliders to match the settings shown in Figure 3-11.
Page 20
35.
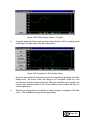
Click on the Store button to bring up the Store 20-Band Graphic Equalizer window
as in Figure 3-12.
Figure 3-11 Tutorial 20-Band Graphic Equalizer Control Window
Figure 3-12 Tutorial Store 20-Band Graphic Equalizer Window
36.
Click on the 1 button to store your slider settings in Memory 1*. (We will recall these
settings later.) Once you have clicked this button, the system will automatically
return to the 20-Band Graphic Equalizer control window.
37.
While listening to the OUTPUT audio with the headphones, adjust the sliders and
listen to how each affects the sound. (Remember, you can drag the box, click in the
bar, or click on the end arrows. Also note that the gain value is displayed above
each bar.) Observe the effect on the signal as the Equalizer button is toggled
___________________________________
*
Each of the six system bandwidths has its own set of 10 memories.
Page 21
between Equalizer In and Equalizer Out. Also, note that whenever a slider is
adjusted, the Equalizer button will automatically be switched from Equalizer In, if it
was in Equalizer Out.
38.
Click on the All Down 1dB button a few times and see how all the sliders move
down together 1dB at a time. (This enables you to increase the gain of a slider
previously at 0 dB.) Click on the Normalize button and see how all the sliders will
instantly move up together so that the highest slider is exactly 0dB. (Once the
equalizer is adjusted, it should be normalized to minimize signal loss.)
39.
Click on the Make All 0dB button to instantly set all the sliders to the 0dB position.
The original slider settings would now be lost had we not previously stored them in
step 36.
40.
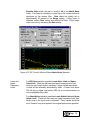
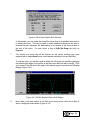
Click on the Recall button to bring up the Recall 20-Band Graphic Equalizer
window. The window in Figure 3-13 will appear.
41.
Click on the 1 button to recall the slider settings previously stored in Memory 1.
(The Previous button will recall the last settings, in case you intended to, but forgot
to save them.) Once you have clicked this button, the system will automatically
return to the 20-Band Graphic Equalizer control window and the original slider
settings will be restored from Memory 1.
42.
Click on OK to exit the 20-Band Equalizer Control Window.
43.
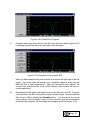
Click on the Spectrum Analyzer button. This will cause the Spectrum Analyzer
window to appear as shown in Figure 3-14: (The actual spectral display will depend
upon the audio being processed.)
Use the mouse to set up all controls as they appear in Figure 3-14. Make sure that
the Primary In selection is highlighted in the Yellow Signal Select box, that the Line
Output selection is highlighted in the Blue Signal Select box, and that Display is set
to Both.
Page 22
Figure 3-13 Tutorial Recall 20-Band Graphic Equalizer Window
44.
Try adjusting the Num Averages slider control. Note that as the Num Averages
parameter is increased, the spectrum traces react more slowly and smoothly to the
input signal. Return the Num Averages setting to 8.
45.
Click on the Run/Freeze button until Freeze is indicated. You should see the
spectrum waveform stop updating.* Click on the Clear button in the Averager block;
both spectrum waveforms should now be cleared completely away. Restore the
Run/Freeze button to the Run indication to allow the spectrum waveform to resume
responding to the input signal.
46.
Click the mouse anywhere on the spectral waveforms to move the vertical red
marker to that point. A readout of frequency (Freq:) and magnitude (Mag:) of the
Yellow and Blue traces will be indicated below the display grid. Use the horizontal
scroll bar in the Marker block for more precise marker control.
47.
Click the Find Peak button to automatically move the marker to the largest
magnitude displayed. Adjust the Gain controls for both the Yellow and Blue traces
and note how the indicated magnitude for each trace is increased as gain is
increased.
___________________________________
*
The spectral analysis freezes immediately; however, the display will briefly continue to update as remaining
data is read from the MCAP external processor.
Page 23
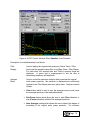
Figure 3-14 Tutorial Spectrum Analyzer Window
48.
Set the Gain controls for the Yellow trace to 40dB and the Blue trace to 0dB. While
the demo audio is playing, notice how the word Gain changes to OVL* (display
overload) for the Yellow trace and how the magnitude (Mag:) indication for the
Yellow trace changes color from yellow to red whenever strong peaks occur.
Reduce the Gain to prevent overload distortion from affecting the spectral display.
49.
Return both Gain controls to 0dB.
50.
Click outside the Spectrum Analyzer window on the Master Control Panel window to
bring up that window, leaving the spectrum analyzer active. Do not close the
Spectrum Analyzer window. Make sure that the two HPFs, Limiter, AGC, Filters,
and Equalizer are all switched OUT. Click on the Filter 2 Control button to bring up
the Lowpass filter control window.
___________________________________
*
The GAIN affects the display only, enabling weaker signals to be seen; an OVL indication will not distort the
processed audio.
Page 24
51.
Notice how the Lowpass and Spectrum Analyzer windows are displayed on the
same screen. Click the Filter button in the Lowpass window until it indicates Filter
In. The Yellow trace now displays the signal going into the Lowpass filter, while the
Blue trace displays the signal coming out of the Lowpass filter. Adjust any of the
Lowpass filter controls, noting the effect on the Blue trace* .
52.
Click on the OK button in the Lowpass window to return to the Master Control Panel.
53.
To return to the Spectrum Analyzer display, click on View and select the Spectrum
Analyzer menu option as shown in Figure 3-15.
54.
Note that this menu option allows the user to access either the Coefficient Display or
the Spectrum Analyzer display, or to turn all Displays Off. Click on Spectrum
Analyzer to return to the Spectrum Analyzer window. This two-step sequence is the
same as clicking on the Spectrum Analyzer Button in the Master Control Panel
(step 43).
Figure 3-15 Tutorial Display Select Menu
55.
Now turn off the spectrum analyzer by clicking on the Close button in the Spectrum
Analyzer window. The system will now return to the Master Control Panel.
56.
Access the Save Setup File feature by clicking on File in the menu bar. The
pulldown menu in Figure 3-16 will appear.
57.
Click on Save Setup File to bring up the Save Setup File window as shown in
Figure 3-17.
For now, do not change the Drives or Directories settings; just keep in mind that
you could change these settings to allow setup files to be stored to any directory of
any drive.
___________________________________
*
The Spectrum Analyzer functions may be adjusted by moving the mouse cursor to that window. The
spectrum Analyzer window may not by closed at this time, however.
Page 25
Figure 3-16 Tutorial File Pulldown Menu
Figure 3-17 Tutorial Save Setup File Window
58.
Click your mouse cursor on the Description text box, which should currently contain
only the “.dac” extension. Using your keyboard, delete all characters in the text box,
then type in My First Setup. See Figure 3-18.
Page 26
Figure 3-18 Tutorial Store in File Name Text Box
59.
Now click your mouse cursor on the Store in File Name text box. Use the left arrow
key to move the cursor to just before the “.dac” extension, then type mysetup.
These entries should appear as in Figure 3-18.
60.
Click on OK to store your first setup file and return to the Master Control Panel.
61.
Click on File to access the File Pulldown Menu as in step 56. Click on Open Setup
File to bring up the Open Setup File window similar to Figure 3-3, but with
mysetup.dac added to the Setup Files list.
For now, do not change the Drives or Directories settings; just keep in mind that
you could change these settings to allow setup files to be recalled from any directory
of any drive.
62.
Click on each file listed in the Setup Files list box. Notice how the Description and
Date for each appears at the bottom of the window as each is clicked.
63.
Click on PHONE.DAC, then click on OK to recall the recommended settings for
processing telephone audio. If you do not have a printer installed on your computer,
skip now to step 66.
64.
Access the hardcopy report generator by clicking on ReportGenerator in the menu
bar. The pulldown menu shown in Figure 3-19 will appear.
Page 27
65.
Make sure your printer is ready, then click on Print Report to Printer. A report
listing all screen settings for the telephone filter setup will now be printed.
66.
Recall your original filter settings by repeating steps 61 and 62 to bring up the Open
Setup File window. Next, click on OK in the Setup Files list box, then click on OK
to return to the Master Control Panel.
Figure 3-19 Tutorial Report Generator Pulldown Menu
This completes the MCAP Tutorial. Please feel free at this point to experiment with the onscreen filter settings. Remember you can always recall filter settings that will likely work
using the Open Setup File feature. To exit the MCAP Master Control Panel, either double
click on the “X” button at the upper right corner of the window, or click on the File menu bar
option, then click on Exit.
Please refer to Chapter 4. .0 for more detailed instructions on using the windows in the
MCAP Master Control program.
Page 28
3.3
Training CD Recording
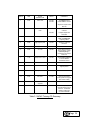
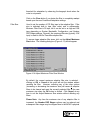
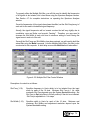
The MCAP Training CD supplied with the MCAP is a useful training tool. Each of its 13
noise sample recordings is accompanied by a suggested Setup File, installed on your
comptuer along with the other MCAP software by the installation procedure.
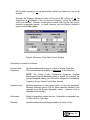
Table 3.1 summarizes the contents of the training CD. The SETUP column contains the
name of the setup file installed on the disk as part of the MCAP software installation
procedure (Section 2.2). To access a setup file, click on File in the Master Control menu
bar (or press <Alt-F>). Next, click on Open Setup File (or press <Alt-O>). The available
setup files should then appear in the Setup Files box; setup files have the extension .dac.
If the needed setup file is not displayed, the Drive or Directories may require changing.
Refer to Section 4.9.2 for additional details.
According to Table 3.1, the setup file s03.dac is the suggested setup file for track 3 (voice
plus swept tones). In all cases the name of the proper setup file for a particular training
track is in the form sXX.dac, where XX is the track number.
All recordings except track 13 are monophonic, i.e., the left and right channels have the
same audio. The 13th recording is a 2CH adaptive (Ref Canceller) filtering example and
has the microphone audio on the left channel and the TV reference audio on the right
channel.
Playback the CD on a standard CD player connecting its Left and Right Line Outputs to the
MCAP's LEFT (PRI) and RIGHT (REF) ANALOG MAIN INPUTS, respectively. As each
track is played, recall the suggested setup file (sXX.dac). Try varying individual control
parameters to observe overall processing effects.
Page 29
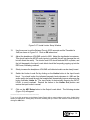
TRACK
TIME
NOISE
DESCRIPTION
SETUP
COMMENTS
1
00:00
500 Hz tone
s01a.dac
s01b.dac
Adjust Notch Freq or
recorder Pitch to null tone
Single tone requires small
filter size
2
02:30
400 Hz and 1100 Hz
tones
s02a.dac
Adjust recorder Pitch to
null tones
s02b.dac
Compare adaptive and
notch filters
3
05:30
Swept tones
s03.dac
Adjust Prediction
Span and Adapt Rate
comparing effects
4
06:20
High frequency hiss
s04.dac
Adjust LPF cutoff and
attenuation
5
08:50
Radio interference
s05.dac
6
09:40
A.C. hum
s06.dac
Hi Res Graphic restores
high frequencies. Adjust
Comb Frequency or
recorder pitch to minimize
60 Hz hum
7
11:00
Telephone A.C. hum
s07.dac
Adjust Comb Frequency
or recorder Pitch to
minimize 60 Hz hum
8
13:55
Acoustic resonances
s08.dac
9
16:30
Jail Cell
s09.dac
10
19:20
Body transmitter
s10.dac
11
20:45
Bar music
s11.dac
12
23:25
Interview and
argument
s12.dac
13
25:50
Radio/TV
s13.dac
Hi Res Graphic restores
high frequencies
Filter cannot separate
voices (spoken or sung) but
does reduce muffling
2CH adaptive (Ref
Canceller) filtering using a
reference. Cancellation
limited by analog tape
recorder's wow/flutter
Table 3.1 MCAP Training CD Summary
Page 30
4. MCAP SOFTWARE REFERENCE MANUAL
This portion of the user's manual is designed as a reference guide to which the user may
refer for more detailed information on specific windows in the MCAP Master Control
program. It is assumed in this section that the user has a good working knowledge of
Microsoft Windows, has properly installed the MCAP hardware and software using the
installation instructions in Section 2.2, and has completed the MCAP Tutorial Section in
3.2.
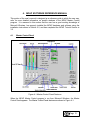
4.1
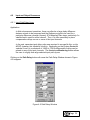
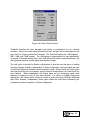
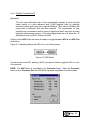
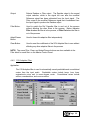
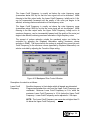
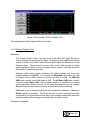
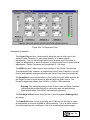
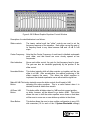
Master Control Panel
Figure 4-1 Master Control Panel Features
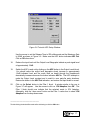
When the MCAP Master Control program is run from Microsoft Windows, the Master
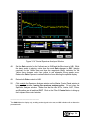
Control Panel appears. The Master Control Panel features are shown in Figure 4-1.
Page 31
From this screen, all external processor capabilities can be accessed. The Master Control
Panel is organized logically from left to right, with audio input controls at the far left, digital
signal processing controls in the middle, and audio output controls at the far right. Master
Control functions are as follows:
Menu Bar:
Used to access the Master Control pulldown menus which allow
storage and recall of filter setups from disk files, configuring RS232
communication with the external processor, viewing signal spectra
and filter coefficients, storage of filter setups in nonvolatile memories
inside the external processor for Stand-Alone operation, generation of
hardcopy setup reports, and getting online help. See Section 4.9
Master Control Pulldown for further details on these features.
Input Levels
Box:
Used to view input signal levels via bargraph display, adjust input
levels via slider controls if desired, setup Input HPFs, and switch
them In and Out of the process, setup input Limiters and switch them
In and Out of the process, and to setup the Path Delay lines. See
Section 4.2 Input and Output Processors for further details on the
Input HPFs, Limiters, and Path Delay lines.
System Bandwidth
Box*:
Used to select the bandwidth of the audio processor which most
closely matches that of the input signals (physically adjusts the
sampling rate of the MCAP). For speech processing applications,
settings of 3.2kHz to 6.5kHz work best. For wider bandwidth signals
applications, 8.0kHz to 16kHz is recommended. NOTE: This is
completely independent of the sample rates used for digial
input/output when digital I/O is used.
Configuration
Box**:
Selects mono or stereo filter configurations. Mono configuration
allows the user to enhance a single input signal with as many as nine
successive stages of digital signal processing. Stereo, Linked
configuration allows the user to process two input signals
simultaneously with as many as five stages of digital signal
processing; each stage is identical for both the left and right channels.
Stereo, Indep. configuration is the same as Stereo, Linked, except
that the processing stages may be set up differently for the left and
right channels.
___________________________________
*
Changing any of these settings will automatically clear all 2CH Adaptive, 1CH Adaptive, Multiple Notch,
Multiple Slot, Spectral Inverse, and Hi-Res Graphic Filters.
**
Ibid.
Page 32
Number DSP
Stages Box*:
Selects the number of DSP (Digital Signal Processing) processing
stages that are to be used. DSP stages consist of both Filter stages
and Equalizer stages. At least two stages are always available (1
DSP Filter + 1 DSP Equalizer), but depending on System Bandwidth
and Configuration, as many as nine stages can be available.
Filter Box(es):
Used to control each DSP Filter Stage. In Mono and Stereo, Indep.
configurations, as many as eight Filter boxes will be displayed; in
Stereo, Linked configuration, as many as four Filter boxes will be
displayed. Select the type of filter to be implemented by each stage
by using the Select button to pull up the Filter Selection Window (See
Section 4.3.1 Filter Selection Window.) Set up the selected filter's
parameters by using the Control button to display the control screen
for that filter (See 4.4 DSP Filter Control Windows.) Switch each
filter stage In or Out of the process using the Filter In/Out button.
Reset and freeze each adaptive filter stage without affecting the other
stages using the Clear and Adapt/Freeze buttons.
Equalizer
Box(es):
Used to control each DSP Equalizer stage. In Mono and Stereo,
Linked configurations, one Equalizer box will be displayed. In Stereo,
Indep. configuration, a separate Equalizer box will be displayed for
each channel. Select the type of equalizer to be implemented by
using the Select button to display the Equalizer Selection Window
(see Section 4.3.2 Equalizer Selection Window). Set up the selected
equalizer's parameters by using the Control button to display the
control screen for that equalizer (See Section 4.5 DSP Equalizer
Control Windows.) Switch each equalizer stage In or Out of the
process using the Equalizer In/Out button.
Clear All
Button:
Clears the filter coefficients of any adaptive filters selected. If no
adaptive filters are present, then the Clear All button has no effect.
NOTE: To individually clear any adaptive filter without disturbing other
adaptive filters, click on the Clear button in its Filter Box.
Adapt Button:
Toggle control used either to freeze all adaptive filters (Adapt Disable
displayed) or to allow non-frozen filters (as specified by the
Adapt/Freeze button in each Filter block) to adapt.
Processor Button:
Toggle control used to specify whether the original input signal(s) is
(are) routed to the line output(s) (Processor Out displayed) or
___________________________________
**
Ibid.
Page 33
whether the product(s) of the digital processor is (are) routed to the
line output(s) (Processor In displayed).
Coefficient
Display Button:
Allows user to quickly activate built-in coefficient display (see
Section 4.8 Coefficient Display Window).
Spectrum
Analyzer
Button:
Allows user to quickly activate the built-in spectrum analyzer display.
(See Section 4.7 Spectrum Analyzer Window.)
Output
Box:
Used to view output signal levels via bargraph display, setup
the Output HPFs and switch them In and Out of the process, setup
output automatic gain controls (AGCs) and switch them In and Out of
the process, and to utilize the optional on-screen Headphone
controls. See Section 4.2 Input and Output Processors for further
details on the Output HPFs, AGCs, and Headphone controls.
Status Box:
Used to indicate RS232 COM port status. The images that can be
displayed by the Status Icon are:
Selected COM port located and MCAP
external
processor
communication
established.
PC is unable to establish a link with the
MCAP on the selected COM port at the
selected Baud Rate
Master Control Panel software is currently
dialing a remote MCAP.
The Master Control Panel software is
configured for a Remote MCAP
connection and is currently “hung up”.
The Master Control Panel is connected to
a remote MCAP via the PassThru.exe
software.
Page 34
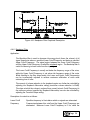
4.2
Input and Output Processors
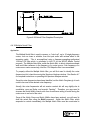
4.2.1 Input Path Delay Lines
Application:
In field enhancement operations, there can often be a large delay difference
between signals to be processed and the Reference signal to be used for a
particular reference canceller (formerly 2CH Adaptive) filter stage, particularly if a
satellite feed is used for either channel. Thus, it is often necessary to place
compensation delays on one or more of the input channels.
In the past, separate signal delay units were required to accomplish this; on the
MCAP, however, this capability is built-in. Depending on the System Bandwidth
selected, from 0 to a maximum of 14563 to 72818 milliseconds of delay can be
placed on any of the input channels. The Headphone Monitoring feature allows
the user to roughly time-align selected input pairs by ear.
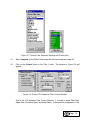
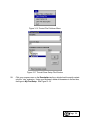
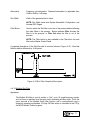
Clicking on the Path Delay button will cause the Path Delay Window shown in Figure
4-3 to appear.
Figure 4-2 Path Delay Window
Page 35
All Path Delays are specified in milliseconds, and can be adjusted in increments as fine
as eight samples (0.2 to 1.1 milliseconds, depending upon selected System
Bandwidth).
Each channel has both a text box and a slider control for specifying delay. Use the text
box to type in the desired delay directly, or use the slider control to adjust the delay by
ear. Make coarse delay adjustments by either dragging the slider scroll box or clicking
on the scroll bar area to the left or right of the scroll box. The left and right arrow
buttons on either end of the slider controls can be used for fine (eight sample) delay
adjustment. At any time, the Zero All Delays button can be clicked to set all the Path
Delay settings to zero (no delay).
The Monitor controls are used to select which input signal pair is to be aurally timealigned using the headphones (Pri/Ref1, Pri/Ref2, or Pri/Ref3). The Volume and Mute
controls are provided for the operator’s listening convenience.
Note: Whenever the Path Delay Window is opened, the headphone outputs
automatically switch to monitoring the specified input pair. This does not affect
the MAIN OUTPUTS line output signals. The headphones will be restored to
their original state when the Path Delay Window is exited.
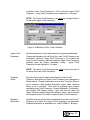
4.2.2 Input and Output Highpass Filters (HPFs)
Application:
The Input HPFs are used to remove rumble or other low-frequency noises which
occur below 100 Hz to 500 Hz (adjustable) from the input signals before they enter
the digital processors. Since very little speech information is lost in bandlimiting
below these frequencies, this filter is recommended for voice enhancement.
However, for wide bandwidth and Hi-fi signals, the low-frequency cutoff may result in
some loss of desired signal components.
The Output HPFs function the same as the Input HPFs, except that they remove
low-frequency noise after the input signal has passed through the digital processors.
(Signal processing may restore some of the low-frequency energy.)
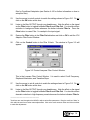
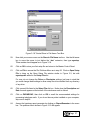
Clicking on the Input HPF Button will cause its caption to toggle between Input HPF In and
Input HPF Out as shown in Figure 4-3, indicating whether the Input HPFs are in or out of
the process. Similarly, clicking on the Output HPF Button will cause its caption to toggle
between Output HPF In and Output HPF Out as shown in Figure 4-3, indicating whether
the Output HPFs are in or out of the process.
Page 36
Figure 4-3 Input and Output HPF Buttons
For fast access* to the Input and Output HPFs, pressing <Alt-I> or <Alt-O> may also be
used to toggle the Input or Output HPFs, respectively, in or out of the process.
Adjustment of the Input HPF cutoff frequency is accomplished by clicking on the IHPF
Setup button. When this button is pressed, the window shown in Figure 4-4 appears.
Figure 4-4 Input HPF Setup Window
Specify the cutoff frequency in 10 Hz increments using the slider control. Minimum cutoff
frequency is 100 Hz, while the maximum cutoff frequency is 500 Hz. Similarly, the Output
HPF cutoff frequency can be adjusted by clicking on the Output Setup button to bring up
the Output HPF Setup Window (identical to the Input HPF Setup Window shown in Figure
4-4).
NOTE: Both the Input HPF and Output HPF buttons are overridden by the Processor
button. When the Processor button is set to Processor Out, both the Input HPF and the
Output HPF will be bypassed, regardless of their buttons' status.
___________________________________
*
Fast access keys use the Alternate key and the underlined letter simultaneously. The letter is not case
sensitive, i.e. <Alt - i> and <Alt-I> are interpreted the same way.
Page 37
4.2.3 Digitally-Controlled Limiter
Application:
The four-channel input Limiter automatically protects the input circuits from overload
distortion by reducing input signal levels whenever loud sounds, such as door slams,
exceed a specified Threshold. When the overload goes away, the Limiter returns
the input signal levels to their original settings over the specified Release Time
interval. If no loud sounds exceed the specified Threshold, the Limiter will not affect
the input signals. In Stereo configurations, the four inputs may be linked, allowing an
overload on any input channel to reduce the gain equally on all inputs, which
minimizes the impact on signal processing.
Clicking on the Limiter Button will cause its caption to toggle between Limiter In and
Limiter Out as shown in
Figure 4-5, indicating whether the Limiter is in or out of the process.
Figure 4-5 Limiter Button
For fast access to the Limiter, pressing <Alt-L> may also be used to toggle the Limiter in or
out of the process.
NOTE: The Limiter Button is never overridden by the Processor In/Out button.
The Limiter Setup button is used to adjust the control settings for the Limiter. When this
button is pressed, the window shown in Figure 4-6 appears.
This window allows the user to adjust the Release Time, Threshold, and Link settings of the
Limiter.
Release Time specifies how quickly input signal levels will return to normal after an
overload condition goes away; the shorter the Release Time, the more quickly the levels
will return to normal. The Release Time options are 0.125 seconds (fastest), 0.250
seconds, 0.500 seconds, and 1.0 seconds (slowest). The 0.250 seconds setting is
recommended for voice applications. Release Time settings longer than 0.250 seconds
may result in excessively long periods of reduced signal level after an overload occurs.
Page 38
Figure 4-6 Limiter Setup Window
Threshold specifies the input bargraph level which is considered to be an overload
condition; any time an input signal exceeds this level, the gain will be decreased for that
input until it no longer exceeds the Threshold. The Threshold options are -6dB (highest), 9dB, -12dB, and -15dB (lowest). The -9dB setting is recommended for most applications.
In general, Threshold settings lower than -9dB will provide better overload protection, but
with significant sacrifice in peak signal level (dynamic range).
The Link option is provided in Stereo configurations to give the user the option of making
the input channels Linked or Independent (In Mono configuration, the extra inputs are used
only with the Reference Canceller, and are always Linked). When Linked, the Limiter gains
are equal at all times for all channels, and are reduced in response to an overload on any
input channel. When Independent, the Limiter gains are not necessarily equal, each
reduced in response to only its own input channel. For stereo or multiple microphone
applications, the Limiter inputs should be Linked to avoid annoying Left/Right differential
gain shifts; however, Independent Limiter gains should be used when processing two
unrelated monophonic signals in a Stereo configuration.
Page 39
4.2.4 Digitally-Controlled AGC
Application:
The dual output Automatic Gain Control automatically attempts to boost low-level
output signals to a peak reference level (-18dB bargraph level) by gradually
increasing output signal gain over a specified Release Time interval until either the
proper level or Maximum Gain has been reached. This compensates for near
party/far party conversations and for losses in signal level which may have occurred
during the enhancement process. If the output signal levels are at or above the -18
dB reference level, the AGC will have no effect.
Clicking on the AGC Button will cause its caption to toggle between AGC In and AGC Out
as shown in
Figure 4-7, indicating whether the AGC is in or out of the process.
Figure 4-7 AGC Button
For fast access to the AGC, pressing <Alt-G> may also be used to toggle the AGC in or out
of the process.
NOTE: The AGC Button is overridden by the Processor button. When the Processor
button is set to Processor Out, the AGC will be bypassed, regardless of its button status.
Page 40
Figure 4-8 AGC Setup Window
When the AGC Setup button is pressed. The window in Figure 4-8 will appear. This
window allows the user to adjust the Release Time, Maximum Gain, and Link settings of the
AGC.
Release Time specifies how quickly the AGC will react to decreases in output signal level.
The shorter the Release Time, the more quickly the AGC will react. The Release Time
options are 50 milliseconds (fastest), 100 milliseconds, 200 milliseconds, and 400
milliseconds (slowest). For most voice applications, the 200 milliseconds setting is
recommended. Release Time settings less than 200 milliseconds may result in annoying
"pumping" sounds as the AGC changes gain during rapid-fire conversations,.
Maximum Gain specifies how much gain the AGC can apply in its attempt to bring the
output signal up to the proper level. The greater the Maximum Gain, the lower the output
signal level that can be brought up to proper level. The Maximum Gain options are 5dB,
10dB, 15dB, 20dB, 25dB, 30dB, and 35dB. For most near party/far pary applications, the
10dB setting is recommended. Maximum Gain settings greater than 10dB may elevate
background noise during pauses in speech. A “soft AGC” using 5dB is often useful even
when large voice level differences are not present.
The Link option is provided in Stereo configurations to give the user the option of making
the two output channels Linked or Independent (In Mono configuration, outputs are always
Linked). When Linked, the AGC gains are equal at all times, and are increased in
response to the largest signal level of the two output channels. When Independent, the
AGC gains are not necessarily equal, each increased in response to only its own output
channel. For most applications, the AGC outputs should be Linked to avoid annoying
Left/Right differential gain shifts; however, Independent AGC gains should be used when
processing two unrelated monophonic signals in a Stereo configuration.
4.2.5 On-Screen Headphone Control
On-Screen control of the Headphone monitoring system is accomplished by clicking on
the Headphones button in the Output Levels box to bring up the Headphone Control
Window shown in Figure 4-9.
Page 41
Figure 4-9 Headphone Control Window
The Left Amplifier and Right Amplifier Combo controls allow the user to individually
specify any signal in the enhancement setup for listening on the left and right
headphone outputs. These controls work similarly to the Yellow and Blue Trace Signal
Select controls on the Spectrum Analyzer screen, except that there is an additional
capability to monitor the MCAP input signals before or after the input Path Delay line
(Pre-Delay or Post-Delay).
The Listen To option buttons allow the user to listen to Both signals (in stereo), the
Left Only, or the Right Only. Volume and Balance controls allow tailoring of both
ears’ listening level. A Mute check box allows the user to quickly toggle the headphone
outputs on and off when necessary.
If, however, panel control of the headphones is preferred, the Enable Panel Controls
check box can be selected to enable the VOLUME, MONITOR, and SELECT controls
in the HEADPHONE MONITORING block on the MCAP front panel.
4.3
DSP Processor Selection
4.3.1 Filter Selection Window
Clicking the Select button in any Filter block (not an Equalizer block) causes the following
window (Figure 4-10) to appear.
Page 42
Figure 4-10 Filter Selection Window
Click the mouse on the desired filter type then click on OK (or, simply double-click the
desired filter type) to select it for the current Filter block. Another way of selecting the filter
is by using the filter select combo box shown in Figure 4-11. To select the filter, first click
on the small arrow to the right of the combo box and then, using the drop down menu that
appears, click on the desired filter.
Figure 4-11 Filter Select Combo Box
Clicking the Control button in any Filter block causes the control window for the selected
filter type to appear. See Section 4.4 DSP Filter Control Windows for detailed information
on control windows for each filter type.
Page 43
4.3.2 Equalizer Selection Window
The last DSP stage is always an Equalizer stage. Clicking the Select button for any
Equalizer block (not a Filter block) causes the following window (Figure 4-12) to appear.
Click the mouse on the desired equalizer type then click on OK (or, simply double-click the
desired equalizer type) to select it for the current Equalizer block. Alternately the equalizer
select combo box can be used in the same manner as with the Filter blocks.
Clicking the Control button for any Equalizer block causes the control window for the
selected equalizer mode to appear. See Section 4.5 DSP Equalizer Control Windows for
detailed information on control windows for each equalizer mode.
Figure 4-12 Equalizer Selection Window
4.4
DSP Filter Control Windows
This section provides detailed description of the control window for each filter mode. For
any DSP Filter block, the control window for the selected filter is accessed by clicking on
the Control button.
Page 44
4.4.1 Ref Canceller (formerly 2CH Adaptive) Filter
Application:
The Reference Canceller filter is used to automatically cancel from the filter input any
audio which matches the selected Reference input. For example, suppose the LEFT
(PRI) MAIN INPUT is microphone audio with desired voices masked by radio or TV
sound; the radio/TV interference can be cancelled in real-time if the original
broadcast audio, usually available from a second receiver, is simultaneously
connected to the RIGHT (REF1) MAIN INPUT. Optionally, the LREF (REF2) and
RREF (REF3) REF INPUTS are also available for canceling multiple interfering
sources.
Figure 4-13 Ref Canceller Filter Control Window
Description of controls (Figure 4-13) is as follows:
Conditional
Adaptation:
For advanced users only. Novice users should keep Filter will
adapt set to Always. The Threshold setting has no effect in this
case.
Conditional Adaptation allows the adaptive filter to automatically
Adapt/Freeze based upon signal input or output levels. This can be
very useful in situations where there are pauses, or breaks, in the
speech being processed.
Hint: Conditional adaptation is useful in maintaining adaptation once
the filter has converged. Motion in the room and air temperature
changes affect the filters operation. First allow the filter to converge in
Always and then click on If Output < Threshold. Adjust the
Page 45
threshold for adaptation by observing the bargraph levels when the
voice is not present.
Click on the Clear button if you desire the filter to completely readapt
based upon the new Conditional Adaptation settings.
Filter Size:
Used to set the number of FIR filter taps in the adaptive filter. Filter
size is indicated both in taps (filter order) and in milliseconds.
Minimum Filter Size is 32 taps, but it can be set to as high as 8192
taps depending on System Bandwidth, Configuration, and Number
DSP Stages settings. Normally, the maximum filter size (typically 1024
taps) is used for the Ref Canceller adaptive filter.
To access larger adaptive filter sizes, click on the Adjust Maximum
Size button. The following dialog box (Figure 4-13) should appear:
Figure 4-14 Adjust Maximum Filter Size Window
By default, the current maximum adaptive filter size is selected clicking on OK or Cancel at this point will exit the window without
resetting the filter. However, selecting any of the other options
(increasing or decreasing the maximum size) will cause all adaptive
filters to be cleared and reset the currently selected filter to the new
maximum size when the OK button is clicked. Click Cancel at any
time to exit the Adjust Maximum Size window without affecting any
filters.
Please Note: Any time the maximum size of any adaptive filter is
increased, the Number DSP Stages options may be reduced and
subsequent filter stages may be dropped due to the MCAP’s physical
Page 46
limitation of 8192 total filter taps for all filters. When this increase
occurs, the Oversized Filters caption will appear in the Number DSP
Stages block. Therefore, the user should strive to minimize the sizes
of all adaptive filters used in order to maximize the number of
available filter stages.
Adapt Rate:
Used to set the rate at which the adaptive filter adapts to changing
signal conditions (mathematically known as Mu). A Mu of 1 x 2-14
provides very slow adaptation, while a Mu of 5884 x 2-14 provides
fastest adaptation.* As a rule set this rate to 256 x 214 initially, to
establish convergence, then back off to a smaller value to maintain
cancellation.
Warning: Be careful when using Adapt Rates larger than 256x2-14, as
the instability could cause the filter to crash!
Delay Channel:
Specifies whether the delay line is to go into either the filter Input
channel or the selected Reference channel. For most applications , a
slight delay (typically 5 msec) is placed in the Input channel, For
applications with long distances between the mike and radio/TV, a
delay in the Reference channel may be required. Extreme caution
should be exercised when using reference channel delay; excessive
delay in that channel will not allow cancellation to take place.
Delay:
Sets the number of audio samples in the delay line. Delay is indicated
both in samples and in milliseconds. Minimum Delay is 1 sample, but
can be set to as high as 32768 samples depending on Configuration
and Number DSP Stages settings.
Please Note: If multiple Ref Canceller stages are placed in series,
only place delay in the Input channel of the first filter (set all other
stages’ Input delays to 1 sample), as this delay will be propagated
through the system to all subsequent stages. However, if Reference
delays are used, each Ref Canceller stage delay line will need to be
configured separately.
Auto/Fixed Mode:
Selects Auto(matic) or Fixed adaptation rate. Auto is recommended.
When Fixed is selected, the specified Adapt Rate Mu is applied to the
filter at all times. When Auto is selected, the specified Adapt Rate is
continuously power normalized depending upon the input signal level.
The Auto mode generally results in faster convergence for a given Mu.
___________________________________
*
2^-14 is an alternate means of expressing 2-14 = 0.000061; 256 x 2^-14 is, therefore, equal to 0.016.
Page 47
Output:
Selects Residue or Filter output. The Residue output is the normal
output selection, which is the signal left over after the modified
Reference signal has been subtracted from the Input signal. The
Filter output is the modified Reference signal that is subtracted from
the Input signal to produce the Residue output.
Filter Button:
Used to switch the Ref Canceller filter in and out of the process
without affecting the other filters in the process. Button indicates
Filter In when the filter is in the process, or Filter Out when the filter is
out of the process.
Adapt/Freeze
Button:
Used to freeze this adaptive filter independently.
Clear Button:
Used to reset the coefficients of the 2CH Adaptive filter to zero without
affecting any other adaptive filters in the process.
NOTE: The same Filter, Clear, and Adapt/Freeze buttons are also available in the
Filter block for each filter on the Master Control Panel.
4.4.2
1CH Adaptive Filter
Application:
The 1CH Adaptive filter is used to automatically cancel predictable and convolutional
noises from the input audio. Predictable noises include tones, hum, buzz,
engine/motor noise, and, to some degree, music. Convolutional noises include
echoes, reverberations, and room acoustics.
Page 48
Figure 4-15 1CH Adaptive Filter Control Window
Description of controls (Figure 4-15) is as follows:
Conditional
Adaptation:
For advanced users only. Novice users should keep Filter will `
adapt set to Always. The Threshold setting is meaningless in this
case.
Conditional Adaptation allows the adaptive filter to automatically
Adapt/Freeze based upon signal input or output. This can be very
useful in situations where there are pauses, or breaks, in the speech
being processed. For example, if you only desire the filter to adapt
when no one is talking, you will first need to observe the Input
bargraph levels to determine the dB level below which no talking
occurs. Then, click on If Input<Threshold and set the Threshold to
the observed dB level. Click on the Clear button if you desire the filter
to completely readapt based upon the new Conditional Adaptation
settings.
Filter Size:
Used to set the number of FIR filter taps (filter order) in the adaptive
filter. Filter size is indicated both in taps and in milliseconds.
Minimum Filter Size is 4 taps, but it can be set to as high as 8192 taps
depending on System Bandwidth, Configuration, and Number DSP
Stages settings.
Small filters are most effective with simple noises such as tones and
music. Larger filters should be used with complex noises such as
severe reverberations and raspy power hums. A nominal filter size of
512 to 1024 taps is a good overall general recommendation.
To access larger adaptive filter sizes, click on the Adjust Maximum
Size button. The dialog box shown in Figure 4-14 should appear. By
default, the current maximum adaptive filter size is selected - clicking
on OK or Cancel at this point will exit the window without resetting the
filter. However, selecting any of the other options (increasing or
decreasing the maximum size) will cause all adaptive filters to be
cleared and reset the currently selected filter to the new maximum size
when the OK button is clicked. Click Cancel at any time to exit the
Adjust Maximum Size window without affecting any filters.
Please Note: Any time the maximum size of any adaptive filter is
increased, the Number DSP Stages options may be reduced and
subsequent filter stages may be dropped due to the MCAP’s physical
Page 49
limitation of 8192 total filter taps for all filters. When this increase
occurs the Oversized Filters caption will appear in the Number DSP
Stages block. Therefore, the user should strive to minimize the sizes
of all adaptive filters used in order to maximize the number of
available filter stages.
Adapt Rate:
Used to set the rate at which the adaptive filter adapts to changing
signal conditions (Mathematically known as "Mu"). A Mu of 1 x 2-14
provides very slow adaptation, while a Mu of 5884 x 2-14 provides
fastest adaptation.
Warning: Be careful when using Adapt Rates larger than 256x2-14, as
the instability could cause the filter to crash!
Larger adapt rates should be used with changing noises such as
music; whereas, smaller adapt rates are acceptable for stable tones
and reverberations. Larger adapt rates sometimes affect voice
quality, as the filter may attack sustained vowel sounds.
Prediction Span:
Sets the number of samples in the prediction span delay line.
Prediction span is indicated both in samples and in milliseconds, and
can be adjusted from 1 to 4096 samples (or higher, depending upon
maximum filter size). Shorter prediction spans allow maximum noise
removal, while longer prediction spans preserve voice naturalness
and quality. A prediction span of 2 or 3 samples is normally
recommended.
Auto/Fixed Mode:
Selects Auto(matic) or Fixed adaptation rate. Auto is recommended.
When Fixed is selected, the specified Adapt Rate Mu is applied to the
filter at all times. However, when Auto is selected, the specified Adapt
Rate is continuously rescaled depending upon the input signal level.
Overall convergence rate is faster with Auto.
Processor Output:
Selects Residue or Predict output. The Residue output is the normal
output selection, which is the signal left over after the predicted noise
signal has been subtracted from the input signal. The Predict output
is the predicted noise signal.
Filter Button:
Used to switch the 1CH Adaptive filter in and out of the process
without affecting the other filters in the process. Button indicates
Filter In when the filter is in the process, or Filter Out when the filter is
out of the process.
Adapt/Freeze
Used to freeze this adaptive filter independently.
Page 50
Button:
Clear Button:
Used to reset the coefficients of the 1CH Adaptive filter to zero without
affecting any other adaptive filters in the process.
NOTE: The Filter, Clear, and Adapt/Freeze buttons are also available in the Filter block for
each filter on the Master Control Panel.
Page 51
4.4.3 Lowpass Filter
Application:
The Lowpass filter is used to decrease the energy level (lower the volume) of all
signal frequencies above a specified Cutoff Frequency, thus reducing high-frequency
noises, such as tape hiss, from the input audio. The Lowpass filter is sometimes
called a "hiss filter."
The Cutoff Frequency is usually set above the voice frequency range so that the
voice signal will not be disturbed. While listening to the filter output audio, the Cutoff
Frequency can be incrementally lowered from its maximum frequency until the
quality of the voice just begins to be affected, achieving maximum elimination of highfrequency noise.
The amount of volume reduction above the Cutoff Frequency can further be
controlled by adjusting the Stopband Attenuation setting (maximum volume
reduction is 60dB). The slope at which the volume is reduced from normal (at the
Cutoff Frequency) to the minimum volume (specified by Stopband Attenuation) can
also be controlled by adjusting the Transition Slope setting.
Figure 4-16 Lowpass Filter Control Window
Description of controls is as follows:
Cutoff
Frequency:
Specifies frequency in Hertz above which all signals are attenuated.
Frequencies below this cutoff are unaffected. Minimum Cutoff
Frequency is 100 Hz, while the maximum Cutoff Frequency depends
upon the System Bandwidth setting. Cutoff Frequency can be
adjusted in 1 Hz steps.
Page 52
Stopband
Attenuation:
Specifies amount in dB by which frequencies above the Cutoff
Frequency are ultimately attenuated.
Stopband attenuation is
adjustable from 10dB to 60dB in 1 dB steps.
Transition
Slope:
Specifies slope at which frequencies above the Cutoff Frequency are
rolled off in dB per octave. Sharpest roll off occurs when Transition
Slope is set to maximum, while gentlest roll off occurs when Transition
Slope is set to minimum. Sharp rolloffs may cause the voice to sound
hollow but will allow more precise removal of high frequency noises.
Note that the indicated value changes depending upon Cutoff
Frequency, System Bandwidth, Configuration, and Number DSP
Stages settings.
Filter Button:
Used to switch the Lowpass filter in and out of the process without
affecting the other filters in the process. Button indicates Filter In
when the filter is in the process, or Filter Out when the filter is out of
the process.
NOTE: The Filter button is also available in the Filter block for each
filter on the Master Control Panel.
A graphical description of the lowpass filter and its controls is given in Figure 4-17.
Figure 4-17 Lowpass Filter Graphical Description
4.4.4 Highpass Filter
Application:
Page 53
The Highpass filter is used to decrease the energy level (lower the volume) of all
signal frequencies below a specified Cutoff Frequency, thus reducing low-frequency
noises, such as tape or acoustic room rumble, from the input audio (The Highpass
filter is sometimes called a "rumble filter").
The Cutoff Frequency is usually set below the voice frequency range (somewhere
below 300 Hz) so that the voice signal will not be disturbed. While listening to the
filter output audio, the Cutoff Frequency, initially set to 0 Hz, can be incrementally
increased until the quality of the voice just begins to be affected, achieving maximum
elimination of low-frequency noise.
The amount of volume reduction below the Cutoff Frequency can further be
controlled by adjusting the Stopband Attenuation setting (maximum volume
reduction is 60dB). The slope at which the volume is reduced from normal (at the
Cutoff Frequency) to the minimum volume (specified by Stopband Attenuation) can
also be controlled by adjusting the Transition Slope setting.
Figure 4-18 Highpass Filter Control Window
Description of controls is as follows:
Cutoff Frequency:
Specifies frequency in Hertz below which all signals are attenuated.
Frequencies above this cutoff are unaffected. Minimum Cutoff
Frequency is 0 Hz (no frequencies attenuated), while the maximum
Cutoff Frequency depends upon the System Bandwidth setting.
Cutoff Frequency can be adjusted in 1 Hz steps.
Stopband
Attenuation:
Specifies amount in dB by which frequencies below the Cutoff
Frequency are ultimately attenuated.
Stopband attenuation is
adjustable from 10dB to 60dB in 1 dB steps.
Page 54
Transition Slope:
Specifies slope at which frequencies below the Cutoff Frequency are
attenuated in dB per octave. Sharpest attenuation occurs when
Transition Slope is set to maximum, while gentlest attenuation occurs
when Transition Slope is set to minimum. Note that the indicated
value changes depending upon Cutoff Frequency, System Bandwidth,
Configuration, and Number DSP Stages settings.
Filter Button:
Used to switch the Highpass filter in and out of the process without
affecting the other filters in the process. Button indicates Filter In
when the filter is in the process, or Filter Out when the filter is out of
the process.
NOTE: The Filter button is also available in the Filter block for each
filter on the Master Control Panel.
A graphical description of the highpass filter and its controls is as follows in Figure 4-19.
Figure 4-19 Highpass Filter Graphical Description
4.4.5 Bandpass Filter
Application:
The Bandpass filter is used to decrease the energy level (lower the volume) of all
signal frequencies below a specified Lower Cutoff Frequency and above a specified
Upper Cutoff Frequency, thus combining the functions of a seriesed Lowpass and
Highpass filter into a single filter. The signal region between the Lower Cutoff
Frequency and the Upper Cutoff Frequency is called the passband region. The
Bandpass filter is useful for simultaneously reducing both low-frequency rumble and
high-frequency hiss.
Page 55
The Lower Cutoff Frequency is usually set below the voice frequency range
(somewhere below 300 Hz) so that the voice signal will not be disturbed. While
listening to the filter output audio, the Lower Cutoff Frequency, initially set to 0 Hz,
can be incrementally increased until the quality of the voice just begins to be
affected, achieving maximum elimination of low-frequency noise.
The Upper Cutoff Frequency is usually set above the voice frequency range
(somewhere above 3000 Hz) so that the voice signal will not be disturbed. While
listening to the filter output audio, the Upper Cutoff Frequency, initially set to its
maximum frequency, can be incrementally lowered until the quality of the voice just
begins to be affected, achieving maximum elimination of high-frequency noise.
The amount of volume reduction outside the passband region can further be
controlled by adjusting the Stopband Attenuation setting (maximum volume
reduction is 60dB). The slope at which the volume is reduced from normal (at each
Cutoff Frequency) to the minimum volume (specified by Stopband Attenuation) can
also be controlled by adjusting the Transition Slope setting.
Figure 4-20 Bandpass Filter Control Window
Description of controls is as follows:
Lower Cutoff
Frequency:
Specifies frequency in Hertz below which all signals are attenuated.
Frequencies between this cutoff and the Upper Cutoff Frequency are
unaffected. Minimum Lower Cutoff Frequency is 0 Hz, while the
maximum Lower Cutoff Frequency is 10 Hz below the Upper Cutoff
Frequency. Lower Cutoff Frequency can be adjusted in 1 Hz steps.
NOTE: The Lower Cutoff Frequency can never be set higher than 10
Hz below the Upper Cutoff Frequency.
Page 56
Upper Cutoff
Frequency:
Specifies frequency in Hertz above which all signals are attenuated.
Frequencies between this cutoff and the Lower Cutoff Frequency are
unaffected. Minimum Upper Cutoff Frequency is 10 Hz above the
Lower Cutoff Frequency, while the maximum Upper Cutoff Frequency
depends upon the System Bandwidth setting.
Upper Cutoff
Frequency can be adjusted in 1 Hz steps.
NOTE: The Upper Cutoff Frequency can never be set lower than 10
Hz above the Lower Cutoff Frequency.
Transition Slope:
Specifies slope at which frequencies below the Lower Cutoff
Frequency and above the Upper Cutoff Frequency are attenuated in
dB per octave. Sharpest attenuation occurs when Transition Slope is
set to maximum, while gentlest attenuation occurs when Transition
Slope is set to minimum. Note that the indicated value changes
depending upon Cutoff Frequency, System Bandwidth, Configuration,
and Number DSP Stages settings. Also, note that the Lower and
Upper Transition Slopes always have different values; this is because
the frequency width of an octave is proportional to Cutoff Frequency.
Stopband
Attenuation:
Specifies amount in dB by which frequencies below the Lower Cutoff
Frequency and above the Upper Cutoff Frequency are ultimately
attenuated. Stopband Attenuation is adjustable from 10dB to 60dB in
1 dB steps.
Filter Button:
Used to switch the Bandpass filter in and out of the process without
affecting the other filters in the process. Button indicates Filter In
when the filter is in the process, or Filter Out when the filter is out of
the process.
NOTE: The Filter button is also available in the Filter block for each
filter on the Master Control Panel.
A graphical description of the Bandpass filter and its controls follows in Figure 4-21.
Page 57
Figure 4-21 Bandpass Filter Graphical Description
4.4.6 Bandstop Filter
Application:
The Bandstop filter is used to decrease the energy level (lower the volume) of all
signal frequencies above a specified Lower Cutoff Frequency and below a specified
Upper Cutoff Frequency. The signal region between the Lower Cutoff Frequency
and the Upper Cutoff Frequency is called the stopband region. The Bandstop filter is
useful for removing in-band noise from the input signal.
The Lower Cutoff Frequency is usually set below the frequency range of the noise,
while the Upper Cutoff Frequency is set above the frequency range of the noise.
While listening to the filter output audio, the Lower and Upper Cutoff Frequencies
can be incrementally adjusted to achieve maximum elimination of noise while
minimizing loss of voice.
The amount of volume reduction in the stopband region can further be controlled by
adjusting the Stopband Attenuation setting (maximum volume reduction is 60dB).
The slope at which the volume is reduced from normal (at each Cutoff Frequency) to
the minimum volume (specified by Stopband Attenuation) can also be controlled by
adjusting the Transition Slope setting.
Description of controls is as follows:
Lower Cutoff
Frequency:
Specifies frequency in Hertz below which no signals are attenuated.
Frequencies between this cutoff and the Upper Cutoff Frequency are
attenuated. Minimum Lower Cutoff Frequency is 0 Hz, while the
Page 58
maximum Lower Cutoff Frequency is 10 Hz below the Upper Cutoff
Frequency. Lower Cutoff Frequency can be adjusted in 1 Hz steps.
NOTE: The Lower Cutoff Frequency can never be set higher than 10
Hz below the Upper Cutoff Frequency.
Figure 4-22 Bandstop Filter Control Window
Upper Cutoff
Frequency:
Specifies frequency in Hertz above which no signals are attenuated.
Frequencies between this cutoff and the Lower Cutoff Frequency are
attenuated. Minimum Upper Cutoff Frequency is 10 Hz above the
Lower Cutoff Frequency, while the maximum Upper Cutoff Frequency
depends upon the System Bandwidth setting.
Upper Cutoff
Frequency can be adjusted in 1 Hz steps.
NOTE: The Upper Cutoff Frequency can never be set lower than 10
Hz above the Lower Cutoff Frequency.
Transition
Slope:
Specifies slope at which frequencies above the Lower Cutoff
Frequency and below the Upper Cutoff Frequency are attenuated in
dB per octave. Sharpest attenuation occurs when Transition Slope is
set to maximum, while gentlest attenuation occurs when Transition
Slope is set to minimum. Note that the indicated value changes
depending upon Cutoff Frequency, System Bandwidth, Configuration,
and Number DSP Stages settings. Also, note that the Lower and
Upper Transition Slopes always have different values; this is because
the frequency width of an octave is proportional to Cutoff Frequency.
Stopband
Attenuation:
Specifies amount in dB by which frequencies above the Lower Cutoff
Frequency and below the Upper Cutoff Frequency are attenuated.
Stopband attenuation is adjustable from 10dB to 60dB in 1 dB steps.
Page 59
Filter Button:
Used to switch the Bandstop filter in and out of the process without
affecting the other filters in the process. Button indicates Filter In
when the filter is in the process, or Filter Out when the filter is out of
the process.
NOTE: The Filter button is also available in the Filter block for each
filter on the Master Control Panel.
A graphical description of the Bandstop filter and its controls follows in Figure 4-23.
Figure 4-23 Bandstop Filter Graphical Description
4.4.7 Comb Filter
Application:
The Comb filter is used to remove, or "notch out", harmonically related noises
(noises which have exactly equally-spaced frequency components), such as powerline hum, constant-speed motor/generator noises, etc., from the input audio. The
filter response consists of a series of equally-spaced notches which resemble a hair
comb, hence the name "Comb filter".
Adjust the Comb Frequency to the desired spacing between notches (also known as
"fundamental frequency"). Set the Notch Limit to the frequency beyond which you
do not want any more notches. Set the Notch Depth to the amount in dB by which
noise frequency components are to be reduced.
Normally, the Notch Harmonics option will be set to All, causing frequencies at all
multiples of the Comb Frequency (within the Notch Limit) to be reduced. However,
Page 60
certain types of noises have only the odd or even harmonic components present. In
these situations, set the Notch Harmonics option to either Odd or Even.
Figure 4-24 Comb Filter Control Window
Description of controls is as follows:
Comb Frequency:
Specifies fundamental frequency in Hertz of comb filter. Notches are
generated at multiples, or harmonics, of this frequency.
NOTE: Comb Frequency changes whenever the System Bandwidth
setting is altered; if you change the System Bandwidth setting, you will
need to readjust the Comb Frequency for any Comb Filters selected.
Notch Limit:
Specifies frequency in Hertz above which no notches are generated.
Minimum Notch Limit is 100 Hz, while maximum Notch Limit depends
upon the System Bandwidth setting. Notch Limit is adjustable in 50
Hz steps.
Notch Depth:
Depth of notches that are generated. Notch Depth is adjustable from
10 dB to 60 dB in 1 dB steps.
Notch Harmonics:
Specifies whether notches will be generated at All, Odd, or Even
multiples, or harmonics, of the Comb Frequency. If, for example, the
Comb Frequency is set to 60.000 Hz, then selecting All will generate
notches at 60 Hz, 120 Hz, 180 Hz, 240 Hz, 300 Hz, etc. Selecting
Odd will generate notches at 60 Hz, 180 Hz, 300 Hz, etc. Selecting
Even will generate notches at 120 Hz, 240 Hz, 360 Hz etc.
Filter Button:
Used to switch the Comb filter in and out of the process without
affecting the other filters in the process. Button indicates Filter In
Page 61
when the filter is in the process, or Filter Out when the filter is out of
the process.
NOTE: The Filter button is also available in the Filter block for each
filter on the Master Control Panel.
Hint: A comb filter is adjusted in the following manner. Set the Notch Limit and Notch
Depth to their maximum positions; set notch harmonics to All. Next adjust the Comb
Frequency to achieve maximum hum removal; normally this will be in the vicinity of 60 or 50
Hz. (Analog recordings will seldom be exactly 50 or 60 Hz due to tape speed errors.
Next, adjust the Notch Limit down in frequency until the hum is bearly heard, then increase
it 100 Hz. Adjust the Notch Depth up following the same procedure. Finally, select the
Odd or Even if they do not increase the hum level; otherwise, use All.
This procedure minimizes the filtering to only that needed for the hum. Since a comb filter
is a reverberator, a 1CH Adaptive Filter is often placed after it to reduce the reverberation
and clean up any residual noises escaping the comb filter.
A graphical description of the Comb filter and its controls follows in Figure 4-25.
Page 62
Figure 4-25 Comb Filter Graphical Description
4.4.8 Inverse Comb Filter
Application:
The Inverse Comb filter is used to isolate everything but the harmonically related
sounds (sounds which have exactly equally-spaced frequency components) of
interest, such as power-line hum, constant-speed motor/generator noises, etc., from
the input audio. The filter response consists of a series of equally-spaced slot filters.
This filter is the exact opposite of the Comb Filter described in Section 4.4.7.
Adjust the Inverse Comb Frequency to the desired spacing between slots (also
known as "fundamental frequency"). Set the Harmonic Limit to the frequency
beyond which you do not want any more slots. Set the Attenuation to the amount in
Page 63
dB by which everything but the harmonically related slot frequencies are to be
reduced.
Normally, the Enhance Harmonics option will be set to All, causing all but the
frequencies at all multiples of the Fundamental Frequency (within the Harmonic
Limit) to be reduced. However, certain types of noises have only the odd or even
harmonic components present. In these situations, set the Enhance Harmonics
option to either Odd or Even.
Figure 4-26 Inverse Comb Filter Control Window
Description of controls is as follows:
Inverse Comb
Frequency:
Specifies fundamental frequency in Hertz of Inverse Comb filter.
Slots are generated at multiples, or harmonics, of this frequency.
NOTE: The Inverse Comb Fundamental Frequency changes
whenever the System Bandwidth setting is altered; if you change the
System Bandwidth setting, you will need to readjust the Fundamental
Frequency for any Inverse Comb Filters selected.
Harmonic Limit:
Specifies frequency in Hertz above which no slots are generated.
Minimum Harmonic Limit is 100 Hz, while maximum Harmonic Limit
depends upon the System Bandwidth setting. Harmonic Limit is
adjustable in 50 Hz steps.
Attenuation:
Depth of attenuation outside the slots. Attenuation is adjustable from
10 dB to 60 dB in 1 dB steps.
Enhance:
Specifies whether slots will be generated at All, Odd, or Even
Page 64
Harmonics:
multiples, or harmonics, of the Fundamental Frequency. If, for
example, the Fundamental Frequency is set to 60.000 Hz, then
selecting All will generate slots at 60 Hz, 120 Hz, 180 Hz, 240 Hz, 300
Hz, etc. Selecting Odd will generate slots at 60 Hz, 180 Hz, 300 Hz,
etc. Selecting Even will generate slots at 120 Hz, 240 Hz, 360 Hz etc.
Filter Button:
Used to switch the Inverse Comb filter in and out of the process
without affecting the other filters in the process. Button indicates
Filter In when the filter is in the process, or Filter Out when the filter is
out of the process.
NOTE: The Filter button is also available in the Filter block for each
filter on the Master Control Panel.
4.4.9 Notch Filter
Application:
The Notch filter is used to remove, or "notch out", a narrow-band noise, such as a
tone or a whistle, from the input audio with minimal effect to the remaining audio.
The Notch filter works best with stable noise sources which have constant frequency;
if the frequency of the noise source varies, then the 1CH Adaptive filter is
recommended.
To properly utilize the Notch filter, you will first need to identify the frequency of the
noise; this is best done using the Spectrum Analyzer window. See Section 4.7 for
complete instructions on operating the Spectrum Analyzer window.
Initially set the Notch Depth to 60 dB and the Notch Width to the narrowest possible
value. Next, set the Notch Frequency to the noise frequency. Fine adjustment of the
Notch Frequency may be necessary to place the notch precisely on top of the noise
signal and achieve maximum reduction of the noise. This is best done by adjusting
the Notch Frequency up or down 1 Hz at a time while listening to the Notch filter
output on the headphones.
Often, the noise frequency will not remain absolutely constant but will vary slightly
due to modulation, recorder wow and flutter, and acoustic "beating." Therefore, you
may need to increase the Notch Width from its minimum setting to keep the noise
within the notch.
For maximum noise reduction, set the Notch Depth to 60dB. It is best to adjust the
Notch Depth up from 60 dB until the tone is observed, then increase the depth 5 dB.
Page 65
Figure 4-27 Notch Filter Control Window
Description of controls is as follows:
Notch Frequency:
Specifies frequency in Hertz which is to be removed from the input
audio. Minimum Notch Frequency is 10 Hz, while maximum Notch
Frequency depends upon the System Bandwidth setting. Notch
Frequency is adjustable in 1 Hz steps.
Notch Depth:
Depth of the notch that is generated. Notch Depth is adjustable from
10 dB to 60 dB in 1 dB steps.
Notch Width:
Width of the generated notch in Hertz.
NOTE: Minimum Notch Width varies with System Bandwidth,
Configuration, and Number DSP Stages.
Filter Button:
Used to switch the Notch filter in and out of the process without
affecting the other filters in the process. Button indicates Filter In
when the filter is in the process, or Filter Out when the filter is out of
the process.
NOTE: The Filter button is also available in the Filter block for each
filter on the Master Control Panel.
Hint: A notch filter is best for stable tones. It has a sharp bottom. If a flatter bottom
(stopband) is needed the bandstop filter (Section 4.4.6) may be prefered. Also, a 1CH
Adaptive filter (Section 4.4.2) is useful in tracking varying tones.
A graphical description of the Notch filter and its controls follows in Figure 4-28
Page 66
Figure 4-28 Notch Filter Graphical Description
4.4.10 Multiple Notch Filter
Application:
The Multiple Notch filter is used to remove, or "notch out", up to 16 single-frequency
noises, such as tones or whistles, from the input audio with minimal effect to the
remaining audio. This is accomplished using a frequency-sampling-synthesized
1024-tap FIR filter which is calculated in the PC by the MCAP Master Control
program. The Multiple Notch filter, unlike the Notch filter, is able to tolerate moderate
wow and flutter variances in the frequency of a noise source; if the frequency of a
noise source varies excessively, then the 1CH Adaptive filter is recommended.
To properly utilize the Multiple Notch filter, you will first need to identify the noise
frequencies; this is best done using the Spectrum Analyzer window. See Section 4.7
for complete instructions on operating the Spectrum Analyzer window.
Once the noise frequencies have been identified, set the Notch Freq(uency) of each
notch to be used to the desired noise frequency.
Usually, the noise frequencies will not remain constant but will vary slightly due to
modulation, wow and flutter, and acoustic "beating". Therefore, you may need to
increase the Notch Width of each notch from its minimum setting to avoid having the
noise move in and out of the notch.
Once all the Notch Freqs and Notch Widths have been entered, you will need to
build the actual filter using the Build command. Unlike the Notch Filter, which
responds to controls immediately, the Multiple Notch Filter must be constructed in
Page 67
the computer and transferred to the external unit. A brief delay thus occurs before
the filter is implemented.
Figure 4-29 depicts the control window for notches 1 through 8. A second window
for 9 through 16 can be button accessed by clicking on the Control 9-16 button.
Figure 4-29 Multiple Notch Filter Control Window
Description of controls is as follows:
Notch Freq (1-16):
Specifies frequency in Hertz which is to be removed from the input
audio by each of the 16 notches. Minimum Notch Freq is 1 Hz, while
maximum Notch Freq depends upon the System Bandwidth setting.
Set Notch Freq to Out (scroll box in full left position) if the notch is not
desired. Notch Freq is adjustable in 1 Hz steps.
Notch Width
(1-16):
Specifies width in Hertz for each of the 16 notches. Minimum and
maximum Notch Widths and adjustment resolution depend upon the
System Bandwidth setting.
Build Button:
Causes the FIR filter coefficients for the Multiple Notch filter to be
calculated and downloaded to the MCAP external processor for
implementation. While this is occurring, an "hourglass" mouse cursor
will appear.
NOTE: You must click the Build button after any Notch Freq or Notch
Width is changed in order for the change to take effect. You must
also click the Build button after any change in System Bandwidth,
Configuration, or Number DSP Stages in order to rebuild the filter.
Page 68
Destroy Button:
Clears all Notch Freq and Notch Width settings for all 16 notches and
restores the Multiple Notch filter coefficients to an allpass filter (no
notches).
Control Button:
The Multiple Notch control window is only capable of displaying the
settings for eight notches at a time; Notches 1-8 or Notches 9-16 may
be displayed. Click on the Control button to toggle between Control
1-8 (Notches 1-8 displayed) and Control 9-16 (Notches 9-16
displayed).
Filter Button:
Used to switch the Multiple Notch filter in and out of the process
without affecting the other filters in the process. Button indicates
Filter In when the filter is in the process, or Filter Out when the filter is
out of the process.
NOTE: The Filter button is also available in the Filter block for each
filter on the Master Control Panel.
A graphical description of the Multiple Notch filter and its controls follows in Figure 4-30:
Figure 4-30 Multiple Notch Filter Graphical Description
4.4.11 Slot Filter
Application:
The Slot filter is used to isolate, or "slot", a single-frequency signal, such as a tone or
a whistle, in the input audio, attenuating all other audio. This is the exact opposite of
the Notch filter function.
Page 69
To properly utilize the Slot filter, you will first need to identify the frequency of the
signal to be isolated; this is best done using the Spectrum Analyzer window. See
Section 4.7 for complete instructions on operating the Spectrum Analyzer window.
Once the frequency of the signal has been identified, initially set Stopband
Attenuation to 60 dB and the Slot Width to the narrowest possible value. Next, set
the Slot Frequency to the signal frequency. Fine adjustment of the Slot Frequency
may be necessary to place the slot right on top of the signal. This is best done by
adjusting the Slot Frequency up or down 1 Hz at a time while listening to the Slot
filter output on the headphones.
Usually, the signal frequency will not remain constant but will vary slightly due to
modulation, recorder wow and flutter, and acoustic "beating". Therefore, you may
need to increase the Slot Width from its minimum setting to avoid having the signal
move in and out of the slot.
Figure 4-31 Slot Filter Control Window
To optimize background noise reduction for your application, set the Stopband
Attenuation to 60dB. If, however, you wish to leave a small amount of the
background noise mixed in with the isolated signal, adjust the Stopband Attenuation
to the desired value.
Description of controls is as follows:
Slot Frequency:
Specifies frequency in Hertz which is to be enhanced in the input
audio. Minimum Slot Frequency is 10 Hz, while maximum Slot
Frequency depends upon the System Bandwidth setting. Slot
Frequency is adjustable in 1 Hz steps.
Stopband
Specifies amount in dB by which frequencies other than the Slot
Page 70
Attenuation:
Frequency are attenuated. Stopband attenuation is adjustable from
10dB to 60dB in 1 dB steps.
Slot Width:
Width of the generated slot in Hertz.
NOTE: Slot Width varies with System Bandwidth, Configuration, and
Number DSP Stages.
Filter Button:
Used to switch the Slot filter in and out of the process without affecting
the other filters in the process. Button indicates Filter In when the
filter is in the process, or Filter Out when the filter is out of the
process.
NOTE: The Filter button is also available in the Filter block for each
filter on the Master Control Panel.
A graphical description of the Slot filter and its controls follows in Figure 4-32. Note that
the slot width is defined at its -6 dB points.
Figure 4-32 Slot Filter Graphical Description
4.4.12 Multiple Slot Filter
Application:
The Multiple Slot filter is used to isolate, or "slot", up to 16 single-frequency signals,
such as tones or whistles, from the input audio, eliminating all other audio. This is the
exact opposite of the Multiple Notch filter function, and is accomplished using a
frequency-sampling-synthesized 1024-tap FIR filter which is calculated in the PC by
the MCAP Master Control program.
Page 71
To properly utilize the Multiple Slot filter, you will first need to identify the frequencies
of all signals to be isolated; this is best done using the Spectrum Analyzer window.
See Section 4.7 for complete instructions on operating the Spectrum Analyzer
window.
Once the frequencies of the signals have been identified, set the Slot Freq(uency) of
each slot to be used to the desired signal frequency.
Usually, the signal frequencies will not remain constant but will vary slightly due to
modulation, wow and flutter, and acoustic "beating". Therefore, you may need to
increase the Slot Width of each slot from its minimum setting to avoid having the
signal move in and out of the slot.
Once all the Slot Freqs and Slot Widths have been entered, you will need to build the
actual filter using the Build command. Like the Multiple Notch Filter, this filter is also
constructed in the computer. A brief delay occurs after Build before it takes effect.
Figure 4-33. Multiple Slot Filter Control Window
Description of controls is as follows:
Slot Freq (1-16):
Specifies frequency in Hertz which is to be isolated from the input
audio by each of the 16 slots. Minimum Slot Freq is 1 Hz, while
maximum Slot Freq depends upon the System Bandwidth setting. Set
Slot Freq to Out (scroll box in full left position) if the slot is not desired.
Slot Freq is adjustable in 1 Hz steps.
Slot Width (1-16):
Specifies width in Hertz for each of the 16 slots. Minimum and
maximum Slot Widths and adjustment resolution depend upon the
System Bandwidth setting.
Page 72
Build Button:
Causes the FIR filter coefficients for the Multiple Slot filter to be
calculated and downloaded to the MCAP external processor for
implementation. While this is occurring, an "hourglass" mouse cursor
will appear.
NOTE: You must click the Build button after any Slot Freq or Slot
Width is changed in order for the change to take effect. You must
also click the Build button after any change in System Bandwidth,
Configuration, or Number DSP Stages in order to rebuild the filter.
Destroy Button:
Clears all Slot Freq and Slot Width settings for all 16 notches and
restores the Multiple Slot filter coefficients to an allpass filter (no slots).
Control Button:
The Multiple Slot control window is only capable of displaying the
settings for eight slots at a time; Slots 1-8 or Slots 9-16 may be
displayed. Click on the Control button to toggle between Control 1-8
(Slots 1-8 displayed) and Control 9-16 (Slots 9-16 displayed).
Filter Button:
Used to switch the Multiple Slot filter in and out of the process without
affecting the other filters in the process. Button indicates Filter In
when the filter is in the process, or Filter Out when the filter is out of
the process.
NOTE: The Filter button is also available in the Filter block for each
filter on the Master Control Panel.
A graphical description of the Multiple Slot filter and its controls follows in Figure 4-34.
Figure 4-34 Multiple Slot Filter Graphical Description
Page 73
4.4.13 Spectral Inverse Filter
Application:
The Spectral Inverse Filter (SIF) is an equalization filter which automatically readjusts
the signal spectrum to reduce noise and muffling effects. It is especially useful
where the voice has been exposed to reverberations and bandlimited noises.
SIF measures the signal’s spectrum and uses this information to implement a highresolution digital filter for correcting spectral irregularities and reduce added noises.
Figure 4-35 illustrates the process. The original audio spectrum (top trace) is
inverted (middle trace). A digital filter is implemented which has the shape of this
middle trace. When the original spectrum (top trace) is modified by this filter, low
energy frequencies are boosted and high energy frequencies are attenuated. The
resulting “filtered” audio has a flat, or white, spectrum of the bottom trace
This mode of operation is Equalized Voice. Available controls permit the operator
to reshape the output audio to white (shown), pink, or voice-like spectrum. The
operator also specifies the spectral range to be equalized using upper and lower
frequency limits; audio outside these limits is attenuated. The amount of spectral
correction (range) can also be controlled.
Page 74
Figure 4-35 Basic Process of Spectral Inverse Filter
The equalization effect of SIF is very beneficial with reverberant audio and recordings
exposed to substantial recorder wow and flutter. The noise sources must remain
stationary for SIF to be effective. SIF cannot readjust itself to changing noises, such
as music. In such cases, the 1CH adaptive filter is recommended.
A second SIF equalization mode is Attack Noise. This mode is especially useful in
reducing band limited noises such as horns and mechnically induced noises. The
operator isolates the spectral region where the noise is present with limit cursors and
the noise is precisely flattened. Audio outside these limits is unaffected.
Page 75
Figure 4-36 SIF Control Window When Equalize Voice Selected
Description of controls/indicators is as follows:
Filter
Display:
Used to display the original audio spectrum (Yellow Trace = Filter
Input) and the spectral inverse filter curve (Blue Trace = Filter Shape).
For each trace, 460 spectral lines and 70dB of dynamic range are
displayed. A green grid is superimposed to aid the user in
determining frequency and amplitude.
Analyzer
Block:
Used to control the spectrum analyzer which measures the original
audio power spectrum; this spectrum is displayed and continuously
updated in the Filter Display area as a yellow trace. Analyzer controls
include:
•
Clear button which is used to zero the averager memory and cause
the averaged spectrum to be recalculated anew.
•
Run/Freeze button which allows the user to start (Run indication) or
stop (Freeze indication) update of the averaged spectrum.
•
Num Averages setting which allows the user to specify the degree of
smoothing of the original audio power spectrum. For minimum
Page 76
smoothing, set to 1; for maximum smoothing, set to 128. A long-term
power spectrum (64 to 128 averages) is best for setting up the filter.
•
Filter
Operation
Block:
Gain control which allows the user to apply a digital gain of up to
40dB to the analyzer input, allowing low-level spectrum components to
be revealed; however, if excessive gain is applied, the analyzer input
will overload, causing the Gain label to change to OVL (analyzer
overload) and the captions at the bottom of the Filter Display area to
change color to red.
Specifies whether SIF is to be used to Equalize Voice or Attack
Noise. When Equalize Voice is selected, the SIF control window
appears as shown in Figure 4-36. When Attack Noise is selected,
the SIF Control Window appears as shown in Figure 4-37.
Equalize Voice operation is used to reshape the original input voice
audio to a more natural-sounding spectral shape over a specified
frequency range. All audio outside this frequency range is attenuated
by 40dB.
Attack Noise operation is used to attack large-magnitude narrowband noises (such as motor noises) over a specified frequency range.
Audio outside this frequency range remains unaffected (0dB
attenuation).
Range/
Gain Block:
For Equalize Voice operation, specifies EQ Range and Gain. For
Attack Noise operation, specifies Attack Range and Gain.
EQ or Attack Range specifies the maximum amount of volume
reduction that can be applied by the inverse filter within the specified
frequency limits; this may be set to the approximate difference in
amplitude between the largest and smallest input spectral components
within the frequency limits. Maximum Range is 50dB.
NOTE: Maximum Range should only be used when necessary; it may
excessively elevate background noises.
For Equalize Voice operation, the inverse filter response rolls off to 40dB outside the frequency limits. For Attack Noise operation, the
inverse filter response rolls up to 0dB (no attenuation) outside the
frequency limits.
EQ or Attack Gain specifies the digital boost to be applied to the
entire spectral inverse filter curve. Normally, Gain is applied in the
Page 77
Equalize Voice mode; the gain is usually 0 dB in the Attack Noise
mode. This boost is necessary to make up for the volume reduction
performed by the inverse filter. Gain should be initially set to
approximately 50 percent of the Range setting. If filter output is
distorted, reduce Gain setting and re-Build the filter; if filter output
level is too low, try increasing the Gain setting.
Figure 4-37 SIF Control Window When Attack Noise Selected
Lower and
Upper
Frequency
Limits:
For EQ Voice operation, specifies Lower Voice Limit and Upper
Voice Limit. These are the lower and upper frequency limits over
which the input voice audio is equalized. Audio outside these limits
is rolled off and ultimately attenuated by 40dB. A Lower Limit above
300 Hz and an Upper Limit below 3000 Hz is not recommended, as
voice intelligibility may suffer.
For Attack Noise operation, specifies Lower Attack Limit and Upper
Attack Limit. These are the lower and upper frequency limits over
which noise in the input audio is attacked. These values should be
set to "bracket" any noise spikes in the original audio power spectrum.
Page 78
To set the upper and lower frequency limits, use the horizontal scroll
bars to position the two red markers on the Filter Display to the
desired frequency positions.
NOTE: You must use the scroll bars; you cannot click the mouse at
the desired points in the Filter Display area.
Output ShapeSpecifies the final reshaping curve to be applied to the entire SIF
Block:
filter. For Attack Noise only Flat should be used. For Equalize
Voice three curves are available and include Flat (no reshaping),
Voice (6dB/octave rolloff above and below 500 Hz), and Pink
(3dB/octave rolloff above 100 Hz). The Voice and Pink curves are
provided to reshape the resultant audio power spectrum to that of a
typical voice spectrum; the Voice curve provides "hard" reshaping,
while the Pink curve provides softer reshaping of the spectrum.
Build Button:
Builds the spectral inverse filter based on the original input audio
spectrum and the SIF control settings. When clicked, the mouse
cursor will change to an "hourglass" shape, indicating that the PC is
busy calculating the spectral inverse filter coefficients and sending
them to the external processor. When the filter build is complete, the
mouse cursor will return to normal and the calculated spectral inverse
filter curve will be displayed as a blue trace in the Filter Display area.
Hint: Before clicking the Build button, it is recommended that the
spectrum analyzer be set to Freeze to allow experimentation with the
control settings for the same input spectrum.
Filter Button:
Used to switch the Spectral Inverse filter in and out of the process
without affecting the other filters in the process. Button indicates
Filter In when the filter is in the process, or Filter Out when the filter is
out of the process. Whenever the Build button is clicked, this button
will always be set to Filter In.
NOTE: The Filter button is also available in the Filter block for each
filter on the Master Control Panel.
Store Button:
This button allows the user to store a calculated spectral inverse filter
curve to any of 60 disk memories (10 for each of the six System
Bandwidth settings) which will not be lost when the computer is
turned off. Clicking this button brings up the window shown in Figure
4-38:
Page 79
Figure 4-38 Spectral Inverse Filter Store Window
Clicking one of the 10 "jukebox-style" buttons will cause the current
filter curve to be stored in that disk memory for the current System
Bandwidth.
Figure 4-39 Spectral Inverse Filter Recall Window
Recall Button:
This button allows the user to recall a previously stored spectral
inverse filter curve from one of 11 disk memories for the currently
selected System Bandwidth. Clicking this button brings up the
window in Figure 4-39.
Clicking one of the 10 "jukebox-style" buttons will cause the filter curve
to be configured as previously stored. Clicking the eleventh button,
labelled Previous, will cause the curve to be restored to the shape it
Page 80
had prior to the last memory recall at the current System Bandwidth
setting. Successive clicks of Recall, then Previous, perform A/B
comparison of two filter curves.
Examples of Spectral Inverse Filters:
In the examples below, SIF will equalize a voice spectrum using various EQ Ranges and
Output Shapes. When the Range is small, only the peaks in the spectrum are flattened.
As the Range is increased, lower energy segments are equalized. The top trace in each of
the figures below gives the filter curve and the bottom trace gives the original input
spectrum.
In Figure 4-40, Figure 4-41, and Figure 4-42 the EQ Range is increased. Each increase
in Range is accompanied by an increase in compensating Gain. Compare the filter curve
(top) to the original input spectrum (bottom). As the EQ Range is increased, more peaks
are attenuated. Figure 4-42 completely compensates all peaks and valleys. Note also the
40 dB attenuation outside the two Limits.
Figure 4-40 EQ Voice operation, EQ Range set to 10db, Output Shape set to Flat
Page 81
Figure 4-41 SIF with EQ Range set to 20dB
The Output spectral Shape may be selected as Flat, as illustrated Figure 4-40, Figure
4-41, and Figure 4-42, above. It may also be set to Voice or Pink.
The Attack Noise mode does not attenuate Out-of-Limits signal, but equalizes and
attenuates in-Limits signal frequencies. Figure 4-43 illustrates.
Applications Suggestions
The following suggestions may be beneficial in setting up and operating the Spectral
Inverse filter.
Analyzer: The FFT spectrum analyzer automatically produces the power spectrum of the
signal entering the SIF. For SIF to be effective, a smoothed spectrum is necessary; SIF
adjusts for long-term stable noises including resonances and steady noises. Short-term
effects of voice and non-stationary noises will decrease the filter's effectiveness; therefore,
the Num Averages should be set large. At least 32 averages are recommended, but more
will give a smoother spectrum from which to build a filter.
The Analyzer Gain should be increased to display weaker energy components. Do not
overload (OVL) the analyzer, as the spectral information would become corrupted.
Page 82
Figure 4-42 SIF with EQ Range set to 50dB
Try to capture a representative spectrum using the Freeze/Run button. Once a stable,
representative spectrum is obtained on the display, Freeze the analyzer. This same
spectrum may be used for several different variations of the filter (changing Limits or
Range, as an example).
NOTE: Immediately following Freeze, the screen will continue to update briefly, as the PC
is receiving the final frozen spectral data from the external unit.
Limits: In Equalize Voice operation, the Upper and Lower Voice Limits should bracket the
voice signal. Outside these limits, the audio is bandpass-filtered. Setting the Lower Limit
above 300 Hz and the Upper Limit below 3000 Hz may adversely affect intelligibility. Try
several sets of Limits; build the SIFs; Store the filters, and Recall and compare in an A/B
fashion.
In the Attack Noise Operation, bracket the noise band surgically with these Limits. If there
are several disjoint noise bands, series additional SIFs. (The MCAP will series up to four).
The audio outside those limits is unfiltered.
Range and Gain: SIF is a spectral attenuator. The spectral peaks are pressed down
toward the spectral valleys. The amount of reduction is limited by the Range scroll bar. If,
however, all peaks are reduced to the lowest valley, no more reduction takes place.
Page 83
Figure 4-43 Attack Noise operation, Attack Range set to 30dB
For example, if the distance from the highest peak to the lowest valley between the Upper
and Lower Limits is 30dB, the maximum range actually used will be 30dB, even if the scroll
bar is set to a larger Range. Normally a Range of 10-20dB is adequate, as attacking the
stronger spectral peaks will provide the necessary enhancement. Go gently at first and
compare several SIFs with different Ranges. The Store and Recall memories are useful in
saving candidate filter solutions.
Since the SIF is an attenuator, the audio level should be restored with the Gain scroll bar.
Normally, setting this to one-half the Range is adequate. If output distortion occurs, reduce
the Gain. The Gain may be increased to make up for losses in signal level due to previous
Filter stages. Note that the Gain is usually 0 dB in the Attack Noise mode.
Output Shape: Three output spectral shapes are selectable by the user. The Flat shape
requires the SIF to produce a uniform (to the degree possible) long-term output spectrum.
This can be subsequently reshaped by the Hi-Res Graphic Filter or Output Equalizer to a
more natural-sounding spectrum. Alternately, the Voice or Pink shapes may be selected
which have built-in output shaping. The Pink shape is often the most pleasing.
Experiment: Select a section of audio and display its spectrum. Freeze the analyzer and
vary different control settings, storing built filters. Compare the results and determine the
best solution. Always compare these different filter solutions using the same input audio.
Page 84
4.4.14 Hi-Res Graphic Filter
Application:
In some applications, it may be necessary to precisely reshape the spectrum of input
audio prior to passing it through successive DSP filter stages. For example, if the
audio is from a microphone which has an unusual frequency response curve (for
example, a microphone acoustically modified as a result of concealment), a
compensation filter that reshapes the audio to a normal spectral shape might be
desirable.
The Hi-Res Graphic Filter is essentially a 460-band graphic equalizer; however,
instead of having 460 separate slider controls, it allows the user to precisely draw the
desired filter shape on the computer screen, using the mouse, with as much or as
little detail as desired. Once the filter shape has been drawn, a linear-phase digital
filter is constructed in the PC and transferred to the external MCAP unit.
The Edit feature allows the user to make readjustments to the filter shape, while the
Normalize button allows the user to shift the entire filter curve up until the highest
point is at 0dB.
A Store and Recall capability is also provided to allow the user to store commonlyused filter shapes to disk memories so that they can be recalled later.
Figure 4-44 Hi-Res Graphic Filter Window
Description of controls/indicators is as follows:
Filter Display:
Graphically displays the current shape of the filter. Also used in
conjunction with the mouse to draw a new filter shape or to edit an
existing one (see New, Edit, and Normalize button descriptions). A
Page 85
grid is provided to assist the user in visually judging frequency and
attenuation at any point in the display.
Freq and Atten
Readouts:
Used to precisely readout the frequency in Hertz and attenuation in
dB at any point along filter curve. Hold the left Mouse button down
while editing the curve or drawing a new curve. These readouts
below the grid indicate precise frequencies and attenuations.
Releasing the button draws the segment.
Store Button:
This button allows the user to store a filter curve to any of 60 disk
memories (10 for each of the six System Bandwidth settings) which
will not be lost when the computer is turned off. Clicking this button
brings up the following window (Figure 4-45):
Figure 4-45 Hi-Res Filter Store Window
Clicking one of the 10 "jukebox-style" buttons will cause the current
filter curve to be stored in that disk memory for the current System
Bandwidth. Clicking the Cancel button exits the Store window
without storing the filter curve in any of the memories.
Recall Button:
This button allows the user to recall a previously stored filter curve
from one of 11 disk memories for the currently selected System
Bandwidth. Clicking this button brings up the window shown in
Figure 4-46.
Page 86
Figure 4-46 Hi-Res Graphic Filter Recall Window
Clicking one of the 10 "jukebox-style" buttons will cause the filter curve to be
configured as previously stored. Clicking the eleventh button, labelled
Previous, will cause the curve to be restored to the shape it had prior to the
last memory recall at the current System Bandwidth setting. Successive
clicks of Recall, then Previous, perform A/B comparison of two filter curves.
The New, Edit, and Normalize buttons are used to graphically manipulate the shape of the
filter curve. Their functions are complex, and thus are best illustrated in the following minitutorial:
1.
From the MCAP Master Control Panel, set System Bandwidth to 5.4 kHz,
Configuration to Mono, and Number DSP Stages to 2. Click on the Select button
in the Filter 1 block, then select Hi-Res Graphic from the selection window.
2.
Click on the Control button in the Filter 1 block to bring up the Hi-Res Graphic Filter
control window. When used for the first time, the control window will be the that of
the previous Figure 4-44.
3.
Click on the New button to draw a new filter. The screen will now appear as shown
in figure Figure 4-47:
Figure 4-47 New Hi-Res Graphic Filter Display
Had you accidentally clicked the New button, you could click on Abort to restore the
previous filter.
Page 87
4.
You should now notice that all the buttons on the control window have been
replaced by a simple Abort botton. Clicking on Abort at any time prior to
completing the curve draw restores the previous filter..
To draw the new filter curve, you will need to carefully click the mouse cursor on
points within the filter display area which correspond to the desired attenuations at
the desired frequencies.
While the mouse pointer is moved across the graph, the Freq and Atten readouts
will be updated as the mouse is moved; you can use this feature to place points in
the filter curve at exact frequencies and attenuations. A line segment will be drawn
wherever the mouse pointer is moved in the graph.
For this example, placing points at precise frequencies and attenuations is not
required; draw the curve approximately as shown in Figure 4-48 using mouse clicks.
Note that the very first click always sets the 0 Hz attenuation starting point.
Hint: To advance the frequency a single step move the cursor to the left of the last
frequency position and click the mouse. The curve will, advance one frequency step
at the specified attenuation.
Page 88
Figure 4-48 Hi-Res Graphic Draw in Progress
5.
Complete drawing the filter curve as shown below (Figure 4-49) by drawing points
all the way to the right edge of the filter display area.
Figure 4-49 Completed Hi-Res Graphic Draw
When you have drawn the last point (must be at or beyond the right edge of the filter
display area), the mouse cursor will change to an "hourglass" shape for a few
seconds while the filter is being calculated. When the calculations are complete, the
mouse cursor and the buttons in the Hi-Res Graphic control window will return to
normal appearance.
6.
Suppose you decide that you would like to make a change in a segment of the filter
curve . Click on Edit to bring up the following display:
Page 89
Figure 4-50 Hi-Res Graphic Edit Window
In this window, you can make the entire filter curve drop by a specified amount prior
to editing the curve. This can be used to create headroom which can be used to
increase the gain (decrease the attenuation) in one portion of the curve relative to
the rest of the curve. For now, select a drop of 0dB (No Drop) and click on
Proceed.
7.
You should now notice that all the buttons on the control window have been
replaced with a single Abort button, which permits returning to the pre-Edit filter.
To edit the curve, you will first need to define the edit region by carefully specifying
the left and right edges of the portion of the filter curve that you wish to modify. Click
your mouse to the left and to the right of the desired region to produce the following
display (Figure 4-51):
Figure 4-51 Hi-Res Graphic Define Edit Region
8.
Now, draw in the new portion of the filter curve using mouse clicks as in Step 4,
above, roughly as shown below (Figure 4-52).
Page 90
Figure 4-52 Hi-Res Edit In Progress
9.
Complete drawing the new portion of the filter curve as shown below (Figure 4-53)
by drawing points all the way to the right edge of the edit region:
Figure 4-53 Completed Hi-Res Graphic Edit
When you have drawn the last point (must be at or beyond the right edge of the edit
region), the mouse cursor will change to an "hourglass" shape for a few seconds
while the filter is being recalculated. When the calculations are complete, the
mouse cursor and the buttons in the Hi-Res Graphic control window will return to
normal appearance.
10.
Normalizing the filter places the highest point on the filter curve at 0 dB. Doing so
minimizes loss in the filter and preserves system dynamic range. Now normalize the
filter curve to 0dB by clicking the Normalize button. You should see the mouse
cursor change to the "hourglass" shape for a few seconds; when the normalization
calculations are complete, the filter shape should appear as follows (Figure 4-54):
Page 91
Figure 4-54 Normalized Hi-Res Graphic Filter
This completes the Hi-Res Graphic Filter mini-tutorial.
4.4.15 20-Band Graphic Filter
Application:
The 20-band Graphic Filter is an easy-to-use linear-phase FIR digital filter that is
used to reshape the spectrum of the signal. Reshaping is accomplished with twenty
vertical scroll bars (also called "slider" controls) which adjust the attenuation of each
frequency band. These controls are very similar to the slider controls of analog
graphic equalizers found on many consumer stereo systems, and thus should be
very familiar to even the novice user.
However, unlike analog graphic equalizers, this digital equalizer has some very
powerful additional capabilities. For example, the Normalize button allows the user
to instantly move all slider controls up until the top slider is at 0dB. The Make All
0dB button instantly sets all the sliders to 0dB. The All Down 1dB button instantly
moves all sliders Down 1dB. None of these functions is available in an analog
graphic equalizer! Notice also that the 20 sliders are spread across the selected
Bandwidth and that the frequency spacing is optimized for voice processing.
Additionally, since a computer with a disk drive operates the equalizer, a Store and
Recall capability is available. This allows the user to store commonly-used slider
configurations in disk memories so that they can be instantly recalled later whenever
they are needed, without having to manually adjust the slider controls.
Description of operation:
Page 92
The 20-Band Graphic Filter operation is identical to the 20-Band Graphic Equalizer of
Section 4.4.14. Please refer to this section for operating instructions and illustrations.
4.4.16 Tri Parametric Filter
Application:
The Tri Parametric Filter is a three-substage adjustable IIR filter which can be used
for both peaking and nulling portions of the input signal’s frequency spectrum.
Controllable parameters for each seriesed substage include Center Frequency,
Width, and Boost/Cut.
Typically, parametric equalizers are used as notch filters, which perform nulling of
the input signal at a specified Center Frequency over a specified width. The
Boost/Cut parameter can be set to a negative value (-1dB to –60dB) for this type of
operation. However, the parametric filter is also capable of peaking, which allows a
positive gain (Boost/Cut of 1dB to +16dB) to be placed at the Center Frequency over
the specified Width Each filter provides three peaking or nulling stages that can be
configured independently.
Each substage can be independently bypassed using the Substage In/Out buttons
in order to allow the user to more quickly and easily adjust each stage for optimum
results. Simply click in the substage that is to be adjusted while the other stages are
clicked out; repeat this process for each substage that is used. Also, an input Input
Atten control allows the user to quickly reduce the overall gain of the entire
parametric filter without altering the overall shaping function.
An bargraph Output Level indicator, as well as an independent Internal Overload
indicator, assists the user in avoiding output distortion by preventing the dynamic
range limits of the filter substages from being exceeded.
Page 93
Figure 4-55 Tri Parametric Filter
Description of operation:
The Center Freq text box / slider controls allow the user to either type in the
desired Center Frequency of each stage directly, or to make manual
adjustments. Click on the left/right arrow button at either end of the slider to
make fine adjustments to center frequency, or drag the scroll box to make coarse
adjustments. Center Frequency can be specified in 1 Hz steps.
The Width text box / slider controls work similarly to the Center Freq controls.
The displayed Width, however, is proportional to the Center Frequency, and will
thus be automatically changed whenever the Center Freq controls are adjusted.
The Boost/Cut controls work similarly to the Center Freq and Width controls, as
the Boost/Cut can be typed directly or selected with the slider control. The
Boost/Cut adjustment ranges from -60dB to +16dB in 1dB increments.
Warning: Pay particular attention to the Output Level and Stage Overload
indicators when positive Boost/Cut values are used, as the maximum
digital signal range of the MCAP can easily be exceeded.
The Substage In/Out buttons allow the user to quickly bypass (Substage Out)
any stage.
The Input Atten slider control is normally set to 0dB, but can be used to insert
an attenuation of as much as 60dB in 1dB increments. This is a useful method
for quickly reducing the overall gain of the four combined parametric stages
Page 94
without having to manually adjust all four Boost/Cut controls (for example, when
a Stage Overload occurs), allowing the overall shaping characteristics of the
parametric filter to be retained. Use the 0 button to quickly restore the input
attenuation to 0dB.
The Output Level bargraph, which indicates the actual parametric filter output
signal level, is provided for convenience. It functions identically to the signal
bargraphs on the MCAP Master Control Panel.
The Master In/Out button allows the entire parametric filter to be clicked In or
Out of the process at any time. A graphical description of a parametric filter and
its controls follows in Figure 4-56.
Figure 4-56 Graphical Representation of a Parametric Filter
4.4.17 Limiter/Compressor/Expander
Application:
The LCE (Limiter/Compressor/Expander) is a three section dynamic signal level
processor, recommended for advanced users only. Dynamic signal level processing
enables the user to manipulate the overall dynamic range of a signal, generally to
correct for near-party/far-party and/or “quiet talker” scenarios.
Page 95
The three types of level processing available (three sections) in the MCAP are
limiting, compression, and expansion. Unlike an analog implementation of this
process, the MCAP digital implementation is substantially easier to set up and
operate and is far more accurate. All matching of amplifier gains is carried out
automatically by the MCAP’s microprocessor. Logarithmic level conversions are
carried out precisely in real time.
These dynamic processes modify the amplitude of the signal using a variable-gain
digital amplifier. The amplitude is a rectified and smoothed version of the signal
wave form, as measured by a real-time digital envelope detector.
The envelope detector is controlled by its Attack Time and Release Time, which
are adjustable. Normally a fast attack time and slow release time are used with
speech.
Setting a fast attack time (less than 10 milliseconds) causes the processor to rapidly
respond to sharp sounds. The level detector will be more peak sensitive to fast
attack time and more average-value sensitive to longer attack times. An Attack
Time of 2-5 milliseconds is recommended for Speech applications.
Short release times, less than 100 milliseconds, may make the level detector too
responsive to intra-syllabic pause creating an annoying “pumping” artifact.
Conversely, long release times, greater than 500 milliseconds for example, may fail
to respond to breath group pauses and exchanges between speakers. Therefore a
Release Time of 200-400 milliseconds is generally recommended for speech
applications.
The gain algorithm dynamically adjusts the signal amplification based on input signal
level and its Gain Region (limiting, compression, or expansion). If the input signal
level exceeds the Limit Threshold, it is in the Limit region. If the input signal level
exceeds the Compression Threshold, but not the Limit Threshold, it is in the
Compression region. And, lastly, if the input signal level is below the Compression
Threshold, it is in the Expansion region. The three Gain Regions are described
below:
Limit Region: In the limit region the output signal level is “damped” or kept
from exceeding the specified Limit Threshold by applying attenuation.
Compression Region: In this region the output signal level changes at a
fraction of the rate of the increase of the input signal level. The dynamic
range of the output signal is reduced with respect to the input signal. As an
example, a 2:1 compressor would produce an output level increase of 10 dB
when the input signal decreases 20 dB. Compression allows signals of wide
dynamic ranges to be squeezed into more limited dynamic ranges of
Page 96
recording media and transmission channels. Compression also eases
listening, especially for noisy audio. Compressors are generally preferred
over AGC’s since input signal level differences are more modestly preserved.
Expansion Region: In the expansion region the output signal has a wider
dynamic range than the input signal. Expansion is the opposite of
compression. As an example, with an expansion ratio of 1:3, the output
signal will increase 30 dB when the input signal decreases only 10 dB.
Expansion may be used to restore a signal’s dynamic range following
compression; for example, if a 2:1 compression has taken place, a 1:2
expansion would restore the signal to its original dynamic range. Expansion
is also used to attenuate objectionable low-level background sounds that are
below voices.
Figure 4-57 Limiter/Compressor/Expander Control Window
Description of operation:
Six different parameters are adjustable on the LCE Control Window:
•
The Expansion Ratio can be adjusted through a range of 1:1 to 1:100 by
using the scroll buttons beside its text entry box, by entering the value in
its text entry box, or by clicking on the Expansion Ratio Curve using the
Page 97
mouse pointer and adjusting it to the desired value. NOTE: Only the
portion of the ratio to the right of the colon is specified.
•
The Compression Threshold can be adjusted through a range of
–90dB to 0dB by using the scroll buttons beside its text entry box, by
entering the value in its text entry box, or by clicking on the Compression
Threshold line using the mouse pointer and adjusting it to the desired
value.
•
The Compression Ratio can be adjusted through a range of 1:1 to 100:1
by using the scroll buttons beside its text entry box, by entering the value
in its text entry box, or by clicking on the Compression Ratio Curve
using the mouse pointer and adjusting it to the desired value. NOTE:
Only the portion of the ratio to the left of the colon is specified.
•
The Limit Threshold can be adjusted through a range of –90dB to 0dB
by using the scroll buttons beside its text entry box, by entering the value
in its text entry box, or by clicking on the Limit Threshold line using the
mouse pointer and adjusting it to the desired value.
•
The Attack Time can be adjusted through a range of 1 to 250
milliseconds by using the scroll buttons beside its text entry box or by
entering the value in its text entry box.
•
The Release Time can be adjusted through a range of 50 to 2000
milliseconds by using the scroll buttons beside its text entry box or by
entering the value in its text entry box.
Other indicators are the Input and Output Level Displays. The Input Level Display
shows the current envelope level for the stage. The Output Level Display shows the
output level of the stage calculated by multiplying the input envelope by the gain.
The current position on the LCE graph is shown via a “dancing” orange dot. The
Current Gain display shows the current instantaneous gain value of between –90dB
and 90dB, as calculated by the MCAP.
Page 98
4.5
DSP Equalizer Control Windows
This section provides detailed description of the control window for each equalizer type.
For any digital Equalizer block, the control window for the selected equalizer is accessed by
clicking on the Control button.
The output equalizer is used to make final adjustments to the noise-reduced digitally filtered
signal. In the process of enhancement, high frequencies might be boosted, and signal level
can be reduced. (This is common in 1CH adaptive filters.) The output equalizer enables
the operator to restore naturalness to the speech and de-emphasize residual highfrequency hiss. Alternatively, a Limiter/Compressor/Expander can be used to achieve a
good output signal level.
4.5.1 20-Band Graphic Equalizer
Application:
The 20-band Graphic Equalizer is an easy-to-use linear-phase FIR digital filter that is
used to reshape the spectrum of the final output signal. Reshaping is accomplished
with twenty vertical scroll bars (also called "slider" controls) which adjust the
attenuation of each frequency band. These controls are very similar to the slider
controls found on analog graphic equalizers common to many consumer stereo
systems, and thus should be very familiar to even the novice user.
However, unlike analog graphic equalizers, this digital equalizer has some very
powerful additional capabilities. For example, the Normalize button allows the user
to instantly move all slider controls up until the top slider is at 0dB. The Make All
0dB button instantly sets all the sliders to 0dB. The All Down 1dB button instantly
moves all sliders Down 1dB. None of these functions is available in an analog
graphic equalizer! Notice also that the 20 sliders are spread across the selected
Bandwidth and that the frequency spacing is optimized for voice processing.
Additionally, since a computer with a disk drive operates the equalizer, a Store and
Recall capability is available. This allows the user to store commonly-used slider
configurations in disk memories so that they can be instantly recalled later whenever
they are needed, without having to manually adjust the slider controls.
Page 99
Figure 4-58 20-Band Graphic Equalizer Control Window
Description of controls/indicators is as follows:
Slider controls:
The twenty vertical scroll bar "slider" controls are used to set the
frequency response of the equalizer. Each slider can set the gain of
its frequency band to any value between 0dB and -40 dB in 1dB
steps.
Center Frequency: Note that the Center Frequency of each band is labelled underneath
each slider, and that bands are more closely spaced at low
frequencies.
Gain Indication:
Above each slider control, the gain for that frequency band is given.
The gain can also be visualized graphically by the position of the
slider control.
Normalize Button:
This button instantly shifts all slider controls up together until the top
slider is at 0dB. After normalization, the relative positioning of the
sliders remains the same. This allows the digital equalizer to
implement the desired equalization curve with minimum signal loss.
Make All 0dB This button instantly moves the slider controls for all bands to 0dB,
Button:
defeating the entire equalizer. This is a useful feature when it is
desired to reset all sliders from scratch.
All Down 1dB
Button:
This button shifts all sliders down by 1dB from their current position;
no slider, however, will be allowed to go below -40dB. This button
allows the user to shift the entire equalizer curve down so that there
will be room to move one or more sliders up relative to the others.
Store Button:
This button allows the user to store a slider configuration to any of 60
disk memories (10 for each of the 6 System Bandwidth settings)
Page 100
which will not be lost when the computer is turned off. Clicking this
button brings up the window shown in Figure 3-12 of Chapter 3. .0.
Clicking one of the 10 "jukebox-style" buttons will cause the current
slider configuration to be stored in that disk memory for the current
System Bandwidth. Clicking the Cancel button exits the Store
window without storing the slider configuration in any of the memories.
Recall Button:
This button allows the user to recall a previously stored slider
configuration from one of 11 disk memories for the currently selected
System Bandwidth. Clicking this button brings up the window given
in Figure 3-13 of Chapter 3. .0.
Clicking one of the 10 "jukebox-style" buttons will cause the sliders to
be configured to the previously stored settings for that memory.
Clicking the eleventh button, labelled Previous, will cause the sliders
to be restored to the settings they had prior to the last memory recall
at the current System Bandwidth setting. Successive clicks of
Recall, then Previous, perform A/B comparison of two equalizer
configurations.
4.5.2
Spectral Graphic Equalizer
Application:
For many output equalization requirements, the 20-Band Graphic Equalizer
described in Section 4.5.1 should be adequate. Its resolution is limited, having only
20 coarsely-spaced slider controls; some applications require finer control of the
output spectrum shape. For this reason, the 115-band Spectral Graphic Equalizer is
provided (a 460-band version is also available as the Hi-Res Graphic Filter described
in Section 4.4.14).
The Spectral Graphic Equalizer is essentially a 115-band graphic equalizer, but does
not have 115 separate slider controls. Rather, it allows the user to precisely draw
the desired equalizer shape on the computer screen, using the mouse, with as much
or as little detail as desired. Once the equalizer shape has been drawn, a linearphase digital filter is created and loaded into the digital equalizer stage of the MCAP
for implementation.
The Edit feature allows the user to make adjustments to the equalizer shape, while
the Normalize button allows the user to shift the entire equalizer curve up until the
highest point is at 0dB.
Page 101
A Store and Recall capability is also provided to allow the user to store commonlyused equalizer shapes to disk memories so that they can be recalled later.
Description of operation:
The Spectral Graphic Equalizer operation is identical to the Hi-Res Graphic Filter of
Section 4.4.14, with the singular exception that its resolution is one-fourth as great. Please
refer to this section for operating instructions and illustrations.
4.5.3 Dual Parametric Equalizer
The Dual Parametric Equalizer is identical to the Tri-Parametric Filter described in Section
4.4.16, except that only two substages are available instead of three. Please refer to that
section for operating instructions.
Figure 4-59 Dual Parametric Filter
4.5.4 Limiter/Compressor/Expander
This Equalizer is the same a s the Limiter/Compressor/Expander described in
Section 4.4.17. See that section for full details.
Page 102
4.6
DSP Display Selection
4.6.1 Spectrum Analyzer and Coefficient Display Buttons
Figure 4-60 Spectrum Analyzer and Coefficient Display Buttons
Pressing the Spectrum Analyzer button at any time brings up the Spectrum Analyzer
window. For fast access to the Spectrum Analyzer window, press <Alt-S> on the keyboard.
See Section 4.7 for complete instructions on operating the controls in the Spectrum
Analyzer window. Pressing the Coefficient Display button at any time brings up the
Coefficient Display window. For Fast access to the Coefficient Display, press <Alt-E> on
the keyboard. See Section 4.8 for complete instruction on operating the controls in the
Coefficient Display window.
4.6.2 Display Select Window
Clicking on View in the menu bar causes the following menu (Figure 4-61) to appear:
Figure 4-61 Display Select Window
Click the mouse on the desired type of display. Only one display will operate at a time.
The display currently active is checked in the View menu. Currently, the only supported
displays are the Spectrum Analyzer and the filter Coefficient Display. Select No Display to
turn off any display currently operating.
For fast access to the Display Select window, press <Alt-V> on the keyboard.
Page 103
See Section 4.7 for complete instructions on operating the controls in the Spectrum
Analyzer window. For complete instructions on operating the Coefficient Display window,
see Section 4.8.
4.7
Spectrum Analyzer Window
Application:
To properly utilize the DSP Filter and Equalizer stages, it is often necessary to
measure the frequency characteristics of the input signal. This assists in determining
the type of filtering needed. Also, after processing the signal, it may be desirable to
compare the frequency characteristics of each digital filter output to those of the input
signal, thus determining the effectiveness of each digital filter. A dual-channel FFT
spectrum analyzer with selectable inputs is ideal for accomplishing these tasks.
The dual-channel FFT spectrum analyzer is used to view the frequency spectrum of
the signal at any stage of the enhancement process. Two traces, a Yellow Trace
and a Blue Trace, can be displayed either simultaneously or separately. Either
trace can be configured to display any signal. The Averager is used to average
successive spectra to achieve a slower, smoother display. Each trace consists of
920 spectral lines with a useable dynamic range of 70dB. Adjustable Gain controls
allow up to 40dB of digital gain to be applied to each trace to boost low level signals
to better fit within this dynamic range. An overall dynamic range of 110 dB is thus
available.
A moveable Marker allows frequency and magnitude readout at any point in the two
spectra. The Find Peak feature allows the marker to be moved instantly to the
largest magnitude displayed.
Page 104
Figure 4-62 Spectrum Analyzer Window
Description of controls/indicators is as follows:
Averager Section:
Controls averaging of successive FFT spectral traces.
Mode selects the type of averager update to be used. The available
choices are Exponential, Peak Hold, and No Average.
Exponential averaging is normally used, since it provides the
smoothest display. In this Mode, the Num Averages scroll bar is
displayed. This bar selects the number of averages to be applied to
spectral traces. The more averages applied, the smoother the
displayed spectrum waveforms will be; however, the waveforms will
also update more slowly as Num Averages is increased. For voice
filtering applications 8 to 32 averages are recommended (the
maximum Num Averages is 32768).
Peak Hold averaging is useful when trying to detect momentary
“spikes” in the frequency spectrum. In this Mode, the largest detected
magnitude in each of the 920 frequency points is retained. Since the
spectrum does not automatically “leak down” with the signal, it will be
Page 105
necessary to periodically click on the Clear button when using this
averager Mode.
No Average bypasses all averaging, allowing the raw, unaveraged
FFT spectrum to be displayed.
The user can freeze an averaged trace by clicking the Run/Freeze
button between Run and Freeze. The user may clear the averaged
trace(s) and restart the average at any time by clicking on the Clear
button.
Display Section:
Allows the user to display the Yellow and Blue spectral traces
simultaneously or separately.
Selecting Yellow displays the Yellow Trace only, selecting Blue
displays the Blue Trace only, and selecting Both displays both the
Yellow Trace and the Blue Trace. Trace update rate will be slightly
faster when Yellow or Blue is selected.
Yellow Signal
Defines what is displayed by the yellow-colored spectrum trace. The
Select:
Yellow Signal Select box highlights the currently selected signal and allows
the user to scroll through the available signals and select a different
one with a mouse click.
The Gain scroll bar allows the user to apply digital gain to the Yellow
Trace input signal prior to FFT analysis, allowing signals which fall
below the 70dB dynamic range of the analyzer to be viewed. Gain
may be adjusted from 0dB (no gain) to 40dB. This Gain setting does
not affect the audio, only the Spectrum display.
If the Gain setting is too large, the Yellow Trace input may be
overloaded, causing a distorted spectrum display. When an overload
does occur, the Gain label will change to OVL and the yellow
magnitude readout at the bottom of the display will change from yellow
to red. Overloads affect only the display and have no effect on the
processed signal.
Blue Signal Select: Defines what is displayed by the blue-colored spectrum trace.
The Blue Signal Select box highlights the currently selected signal
and allows the user to scroll through the available signals and select a
different one with a mouse click.
Page 106
The Gain scroll bar allows the user to apply digital gain to the Blue
Trace input signal prior to FFT analysis, allowing signals which fall
below the 70dB dynamic range of the analyzer to be viewed. Gain
may be adjusted from 0dB (no gain) to 40dB. This Gain setting does
not affect the audio, only the Spectrum display.
If the Gain setting is too large, the Blue Trace input may be
overloaded, causing a distorted spectrum display. When an overload
does occur, the Gain label will change to OVL and the blue magnitude
readout at the bottom of the display will change from blue to red.
Marker Section:
Used to move the vertical red marker in the Spectrum Display area
(described below), allowing frequency (Freq) and magnitude (Mag)
readout of any point in the spectra.
The horizontal scroll bar is used to precisely place the marker at the
desired point in the spectra. Make coarse adjustments to marker
position by dragging the scroll box ("slider") with the mouse. Click on
the scroll bar or scroll arrows at either end of the scroll bar to make
fine adjustments.
Clicking the Find Peak button instantly moves the marker to the
largest magnitude in the Spectrum Display.
For faster placement of the marker, click the mouse cursor on the
desired point in the Spectrum Display area.
Spectrum Display:
Spectra are displayed in Cartesian (X,Y) format, with the Y axis
representing magnitude in dB and the X axis representing frequency
in Hertz. A green grid is superimposed on the black background to
assist the user in visually judging frequency and magnitude of spectral
components.
A vertical red marker is used to read out the exact magnitude(s) (Mag)
of any frequency (Freq) in the spectrum display. To move the marker,
simply click the mouse cursor on the desired point in the Spectrum
Display area, or utilize the controls in the Marker Block, described
above.
Note: The Spectrum Analyzer window is sizeable, and can be
expanded to full-screen resolution by clicking on the Maximize button
in the upper right-hand corner of the display.
Hide Controls:
Selecting the Hide Controls option makes all screen controls in-
Page 107
visible, allowing more screen area to be used for the Spectrum
Display. To reaccess the controls, simply click on Hide Controls again
to deselect the Hide Controls option.
Close Button:
4.8
Clicking on this button turns off the Spectrum Analyzer display.
Coefficient Display Window
Application:
In setting up a Ref Canceller filter it is sometimes useful to display the impulse
response (filter coefficients) of the filter. Additionally, it is sometimes desirable to
know the precise time-domain response (ie, to determine delay) of any of the digital
Filter stages. For these reasons, the Coefficient Display window has been provided.
The Filter stage to be displayed is specified in the Filter Select block by clicking on
the desired Filter.
The number of coefficients in the Filter to be displayed is specified in the
Coefficients to Display block by clicking on the desired number; this causes the
specified number of coefficients to be horizontally scaled to fit within the display area.
Regardless of the length of the Filter, clicking on All causes all coefficients in that
Filter to be displayed.
Vertical scaling of the Filter's coefficients for display is accomplished by clicking on
the desired Scale factor. Supported Scale factors range from 1X to 200X.
A moveable Marker allows Time and Value readout at any point in the Coefficient
Display.
Page 108
Figure 4-63 Coefficient Display Window
Description of controls is as follows:
Filter Select Block:
Used to select the DSP Filter stage whose coefficients are to be
displayed. Available options depend upon the System Bandwidth,
Configuration, and Number DSP Stages settings.
Coefficients to
Display Block:
Used to select how many coefficients in the selected Filter are to be
horizontally scaled to fit the display area. The minimum number of
coefficients that can be displayed is 32, while the maximum number of
coefficients varies according to the actual size of the Filter. To display
all the coefficients in a Filter stage, click on All.
Scale Block:
Used to specify the vertical scale factor to be used when displaying
coefficients. Coefficients may be scaled from 1X (no scaling) to a
maximum of 200X. If the scaled coefficient exceeds the maximum
vertical display limits, it will be clipped prior to display. This clipping
does not affect signal processing.
Marker Block: Used to move the vertical red marker in the Coefficient Display area, allowing
Time and Value readout of any coefficient that is displayed.
Page 109
The horizontal scroll bar is used to precisely place the marker at the
desired filter coefficient. Make coarse adjustments to marker position
by dragging the scroll box ("slider") with the mouse. Click on the scroll
bar or scroll arrows at either end of the scroll bar to make fine
adjustments.
The Coefficient Display area will "pan", or shift, left or right whenever
the marker selects a coefficient that is outside the displayed area.
Clicking the Find Peak button instantly moves the marker to the
largest coefficient in the filter, panning the display if necessary.
For faster placement of the marker, click the mouse cursor on the
desired point in the Coefficient Display area. Click on the left or the
right side of the Coefficient Display grid to pan left or right.
Coefficient Display: Coefficients are displayed in Cartesian (X,Y) format, with the Y axis
representing Value in a range from -1.0 to +1.0. The X axis
represents Time in seconds. A yellow grid is superimposed on the
black background to assist the user in visually judging Time and
Value of Filter coefficients.
A vertical red marker is used to read out the exact Value and Time of
any Filter coefficient. To move the marker, simply click the mouse
cursor on the desired point in the Coefficient Display area, or utilize
the controls in the Marker Block, described above.
Hide Controls:
Selecting the Hide Controls option makes all screen controls invisible, allowing more screen area to be used for the Coefficient
Display. To reaccess the controls, simply click on Hide Controls again
to deselect the Hide Controls option.
Close Button:
Clicking on this button turns off the Coefficient Display.
Page 110
4.9
Master Control Pulldown Menus
4.9.1 Storing Setups to Disk Files
Application:
To save time configuring MCAP control settings, complete setups may easily be
stored to disk setup files for future recall. These files are particularly handy when
making presentations which require multiple setups, or when it is desired to precisely
duplicate the enhancement procedure at some point in the future. Also, this feature
allows easy transfer of enhancement setups between MCAP systems using floppy
disks.
Note: Any setup files previously stored by the Digital Audio Company PCAP software
can be loaded by the MCAP software. The PCAP II software is also capable of
operating the MCAP unit.
Store a setup to a disk file as follows:
1.
Click on File on the Master Control menu bar. When the pulldown menu
appears, click on Save Setup File. This will cause the window in Figure
4-64 to appear:
2.
Normally, it will not be necessary to change the Drive or the Directories
settings; if, however, you desire to place the setup file into a different drive
(such as a floppy drive) or directory, scroll through the lists of available drives
and directories and select the desired drive or directory by double-clicking it.
If you select a drive that is not ready, an error message will be generated.
3.
Each stored setup will have a time stamp and a user-entered text
Description to uniquely identify it. The time stamp will be set automatically
when the file is stored, but you must enter the Description text before storing
the file. To enter or edit the Description text, click on the Description text
box and type in any text desired. It is recommended that the text be
descriptive of the setup's application.
Page 111
Figure 4-64 Store Setup File Window
4.
You will need to specify a filename for the setup. Click on the Store in File
Name text box, then type the desired filename (up to 256 characters). All
setup filenames must have the .DAC extension; thus, the .DAC extension is
automatically included in the text box. If you delete the .DAC extension, an
error message will be generated.
5.
If you wish to protect your setup file from being accidentally overwritten in the
future by the Save Setup File window, click the Protect from Future
Overwrite box. This does not prevent deletion or overwrite by the Windows
Explorer or by MS-DOS.
6.
Click on OK to save the setup file with the selected filename to the specified
drive and directory.
4.9.2 Recalling Setups from Disk Files
Application:
To save time configuring control settings in the MCAP Master Control program,
complete setups previously stored may be recalled from disk files with a few simple
mouse clicks. This is particularly handy when making presentations which require
multiple setups, or when it is desired to precisely duplicate a previous enhancement
procedure. Also, this feature allows easy transfer of enhancement setups between
MCAP systems using floppy disks.
Page 112
Note: Any setup files previously stored by the Digital Audio Company PCAP software
can be loaded by the MCAP software. The PCAP II software is also capable of
operating the MCAP unit.
Recall a setup from a disk file as follows:
1.
Click on File on the Master Control menu bar. When the pulldown menu
appears, click on Open Setup File. This will cause the following window
(Figure 4-65) to appear:
Figure 4-65 Recall Setup File Window
2.
Normally, it will not be necessary to change the Drive or the Directories
settings; if however, you need to recall a setup file from a different drive (such
as a floppy drive) or directory, scroll through the lists of available drives and
directories and select the desired drive or directory by double-clicking it. If
you select a drive that is not ready or a directory which has no setup files in it,
an error message will be generated.
3.
Each stored setup has a time stamp and a user-entered text Description to
uniquely identify it. These are easily browsed prior to recalling a setup, thus
preventing time from being wasted if the wrong setup file is selected. To
browse a setup time stamp and Description, scroll to and click on the
desired file listed in the Setup Files list box.
Page 113
4.
Once the desired setup file name has been found, either double-click it or
click on OK to recall it. A message will alert the user that 60 seconds may be
required to completely recall the setup.
An "hourglass" mouse cursor will now appear, indicating that the MCAP is busy configuring
itself with the recalled settings from disk.
4.9.3 Viewing DSP Displays
Click on View to access the Display Select window shown in Figure 4-61 on page 103.
See Section 4.6.2 for further details.
4.9.4 Storing Setups to External Processor Stand-Alone Memories
Application:
The MCAP external processor has the capability to store up to four enhancement
setups internally in nonvolatile Stand-Alone memories, allowing the external
processor to be operated in those setups without needing to be connected to a PC.
This makes it possible to store sophisticated enhancement setups in one or more
external processors in the laboratory, then use them as portable field processors
which have simple controls that can be operated by anyone. Thus, with this feature,
the complete capabilities of the enhancement laboratory and the expertise of the
laboratory personnel can be extended to field operations.
For all memories, the function of the AUX switch on the external processor front
panel can be specified.
Store a setup in a nonvolatile memory as follows:
1.
Adjust all Master Control, Filter, and Equalizer settings as desired to achieve
the desired enhancement setup. This may also be accomplished using the
Open Setup File feature described in Section 4.9.2.
It is strongly suggested that you store this enhancement setup to disk using
the Save Setup File feature described in Section 4.9.1. NOTE: There is no
way for the Master Control program to retrieve from the MCAP and interpret
the settings and coefficients stored in the Stand-Alone memories.
2.
Click on Stand-Alone on the Master Control Panel menu bar to access the
following pulldown menu (Figure 4-66):
Page 114
Figure 4-66 Stand-Alone Pulldown Menu
3.
Click on the selected memory. The following window (Figure 4-67) will now
appear:
Figure 4-67 Auxiliary Switch Function Window
This window allows the function of the AUX switch on the MCAP external
processor front panel to be programmed. Click on the program option
desired, then click on OK.
4.
A message window will now appear to alert you that the previous contents of
the selected memory will be lost, and that 30 seconds could be required to
transfer all settings to the memory. Additionally, the window will suggest that
you also store your setup in a disk file. Click on Yes if you wish to proceed,
or click on No to cancel without affecting the current memory contents.
An "hourglass" cursor will now appear, indicating that the MCAP is busy storing the
setup in the selected Stand-Alone memory. For complete instructions on operating
the MCAP external processor from the Stand-Alone memories, please consult
Section 5. .0.
Page 115
4.9.5 Generating Setup Reports
The MCAP Master Control program has a ReportGenerator feature which allows hardcopy
printouts of MCAP control settings to be generated. This is useful when the enhancement
procedure needs to be documented. To access this feature, click on ReportGenerator in
the Master Control menu bar. The following pulldown menu (Figure 4-68) will be
displayed:
Figure 4-68 ReportGenerator Pulldown Menu
Clicking the Print Report to File option prints the control settings to a user-specified ASCII
text file, which could later be imported to a word processor editing. All previous contents of
the specified file will be overwritten. However, this option is limited, since no graphics can
be stored in a text file. If you wish to transfer graphical information to a word processor,
click on How to Print Screens for instructions.
Clicking the Append Print Report to File option causes the printed control settings to be
tacked on to the end of any existing text file, without overwriting the previous contents. As
with the Print Report to File option, no graphics can be stored.
Clicking the Print Report to Printer option sends all control settings, including graphs for
certain Filter and Equalizer modes, to the Windows Print Manager for printing. For this
feature to work properly, a printer (with paper) needs to be connected to your computer.
4.9.6 Getting Online Help
Context-sensitive online help is available to the MCAP Master Control program at any time
by pressing the <F1> key. This is a standard feature of Microsoft Windows programs, and
is the recommended method for accessing help.
The term "context-sensitive" means that the help text that is displayed depends upon the
window from which you are currently operating. For example, if you are operating the
Spectrum Analyzer controls and you press the <F1> button, help text for the Spectrum
Analyzer will be displayed.
An alternative method for accessing help is to click on Help in the Master Control menu
bar. The following pulldown menu (Figure 4-69) will be displayed:
Page 116
Figure 4-69 Help Pulldown Menu
Click on Contents to access the WinHelp utility Contents window. The Contents window
will display all the subjects for which help is available for the MCAP Master Control
program. You may browse through the displayed subjects and select help for a particular
subject by double-clicking the desired subject.
The WinHelp utility is a separate Windows program. Once it has displayed the help text, it
will remain on the screen as a separate window until it is closed by the user.
For further information on the WinHelp utility, please consult your Microsoft Windows
User's Guide.
Page 117
5. OPERATING MCAP STAND-ALONE
Before the MCAP external processor can be operated Stand-Alone, at least one of the
Stand-Alone setup memories must be programmed using the procedure in Section 4.9.3.
Operate the MCAP external processor as a Stand-Alone audio processor as follows:
1.
Switch the front panel OPERATION switch to the STAND-ALONE position.
Connect 12VDC or 120/240VAC power, and switch the POWER switch ON.
2.
Connect the signals to be processed to the rear panel ANALOG MAIN
INPUTS BNCs for most filtering applications. For an AES/EBU digital source,
connect the stereo digital signal to the DIGITAL MAIN INPUTS jack and set
the MAIN INPUTS slide switch to DIGITAL. If extra references are to be
used, connect them to the analog REF INPUTS.
3.
Adjust the front panel input LEVEL controls for all ANALOG signal inputs
such that the tricolor LEDs indicate GREEN most of the time, with occasional
YELLOW peaks. Note: The LEVEL controls do have effect on DIGITAL
signal inputs, so the must always be adjusted.
4.
Connect a tape recorder to the rear panel LEFT and RIGHT ANALOG MAIN
OUTPUTS BNCs if recording the processed audio is desired. If using a
DAT, the AES/EBU DIGITAL MAIN OUTPUTS may also be used (both the
ANALOG and DIGITAL MAIN OUTPUTS jacks are “hot” at all times).
5.
Plug stereo headphones into the front panel PHONES jack.
VOLUME control to a comfortable listening level.
6.
Select the desired Stand-Alone memory by switching the MODE switch to 1,
2, 3, or 4.
7.
Initially, set the front panel ADAPT/FREEZE, PROCESS/BYPASS, and
AUX/OFF switches to ADAPT, PROCESS, and AUX (all switches up).
Adjust the
While listening with the stereo headphones, switch the MONITOR switch between MAIN
INPUTS and OUTPUTS to hear the difference between the original and processed audio,
respectively. To monitor the extra REFERENCE signals, switch the MONITOR switch to
REF INPUTS. You may make the following adjustments to the processor at any time:
1.
To freeze all adaptive filters in the process, switch the ADAPT/FREEZE
switch to FREEZE. To allow the adaptive filters to adapt to changing signals,
switch to ADAPT.
Page 118
2.
To bypass all digital filters, allowing the original unfiltered audio to pass
through to the LEFT and RIGHT ANALOG MAIN OUTPUTS BNCs and the
DIGITAL MAIN OUTPUTS XLR, switch the PROCESS/BYPASS switch to
BYPASS. To filter the audio, switch to PROCESS.
3.
The AUX switch is programmed to have one of the following functions when
switched to AUX:
a.
No effect at all (default)
b.
Input Limiter IN
c.
Input HPF IN
d.
Output AGC IN
e.
Output HPF IN
f.
Right channel Adapt/Freeze (ADAPT/FREEZE switch used for
Left channel only)
g.
Filter 2-8 Adapt/Freeze (ADAPT/FREEZE switch used for
Filter1 only)
When switched to OFF, the AUX switch always has no effect on the signal.
4.
To clear all filters, press the CLEAR button. This will cause all adaptive filter
coefficients to be reset to zero, allowing them to reconverge anew (assuming
the ADAPT/FREEZE switch is in ADAPT).
Page 119
6. MCAP CUSTOMIZATION OPTIONS
6.1
Configuring MCAP for Different COM Ports
The MCAP Master Control software is factory-configured to communicate with the external
processor over RS232 communications port #2 (COM2). This is likely to work for most
systems. However, in some cases where a serial mouse is connected to COM2 instead of
COM1, or in general when the available COM port is not COM2, it may be necessary to
reconfigure the software to operate on a different COM port as follows:
1.
On the MCAP Master Control menu bar, click on the "Settings" menu bar
option.
2.
When the pulldown menu appears, click on "Local Connect Settings", then
“ComPort”. The display will now appear as follows (Figure 6-1).
Figure 6-1 ComPort Selection Menu
3.
Now click on the desired COM port. To attempt connection through this port,
make sure the “Use Local MCAP” menu option within the “Settings” menu is
checked and click on “Connect to MCAP”. If any error messages appear,
then you have misidentified the COM port. Repeat steps through 3 until the
Status Icon shows an animated pictures of a data port with an arrow moving
through it. When it does, wait a few moments for the program to reset the
external processor. If the Input Level bargraphs eventually respond to the
input signal, then proper communication has been achieved.
Page 120
4.
6.2
Click on "File", then "Exit" to exit the MCAP Master Control program. This will
save the new COM port setting.
Configuring MCAP for Different Baud Rates
This section is intended for advanced users, only.
The MCAP system is capable of operating at RS232 symbol rates of 9600, 14400, 19200,
and 38400 baud. Each MCAP is factory-configured to operate at 38400 baud, which works
well for most PCs. However, some applications (such as modem or network links) may
require the use of a different baud rate.
Change the MCAP baud rate as follows:
1.
First, reset the internal DIP switches of the external processor for the new
baud rate as follows:
a.
Power off the MCAP external processor and disconnect all
cables, especially the EXTERNAL POWER and RS232 cables.
b.
Carefully remove the external processor top cover by first
removing the screws located behind the front panel rack-mount
ears with a phillips screwdriver, then sliding off the top cover
toward the rear of the unit.
c.
Locate the orange 5-position DIP switch near the front of the
internal printed-circuit board. Set DIP switch positions 1-3 to
desired baud rate as follows:
d.
Replace top cover and reconnect all cables.
Baud Rate
DIP1
DIP2
DIP3
9600
OFF
OFF
ON
14400
ON
ON
OFF
19200
OFF
ON
OFF
38400
ON
OFF
OFF
38400 (default)
OFF
OFF
OFF
Table 6.1 Baud Rate DIP Switch Settings
Page 121
2.
Next, configure the MCAP Master Control program for the new baud rate as
follows:
a.
Make sure that the MCAP external processor is powered OFF
initially.
b.
Power ON the computer (not the external processor) and load
Windows.. Run the MCAP Master Control program by doubleclicking the icon. Click OK if any error messages occur.
c.
Power ON the MCAP external processor.
d.
On the MCAP Master Control menu bar, click on the "Settings"
menu bar option.
e.
When the pulldown menu appears, click on "Local Connect
Settings", then "Baud Rate". The display will now appear as
follows (Figure 6-2):
f.
Click on the baud rate setting which corresponds to the MCAP
external processor DIP switch settings. To attempt connection
through this port, click on “Settings”, then “Connect to Local
MCAP”. If any error messages appear, recheck COM port
setting, Baud Rate setting, connections, and DIP switch
settings.
g.
Click on "File", then "Exit" to exit the MCAP Master Control
program and save the new baud rate setting.
Figure 6-2 BaudRate Selection Menu
Page 122
After storing the new baud rate by exiting the MCAP Master Control program, test the new
baud rate as follows:
a.
Switch on the MCAP external processor. Make sure that the OPERATION
switch on the external processor is set to REMOTE, and that the RS232
cable is properly connected between the external processor and the PC.
b.
Double-click on the MCAP Master Control icon to run the program.
c.
Allow several seconds for the program to load and to initialize the external
processor. The Status Icon should display the connected image.
d.
Connect a line-level audio signal to either the LEFT or the RIGHT ANALOG
MAIN INPUTS BNC jack and adjust the input level so that the tricolor level
LEDs indicate GREEN.
If the Input Level bargraphs on the MCAP Master Control screen properly respond to the
input signal, then the hardware and software are correctly configured for the new baud rate.
6.3
Customizing Screen Colors
Many of the MCAP Master Control program screen colors are set by the Windows
environment. To change these colors, first open the Control Panel by clicking on the Start
button on the Taskbar then clicking on the Settings menu option. There you will see the
Control Panel icon. Double click on the Display icon and select the Appearance tab. In
this window, you can select a Scheme from the list box and view the appearance of each,
or you can set colors manually by selecting the item in the window example. If you do set
colors manually, make sure that you click the Save As button to save your custom color
scheme to a disk file. Finally, when you have all colors set the way that you like, click on
OK to reset the Windows environment colors to these values.
For complete details on using the Control Panel, please refer to the Microsoft Windows
User's Guide.
6.4
Operating a Remote MCAP via Modem
The MCAP Master Control software is factory-configured to communicate directly with the
“locally connected” external processor over RS232 communications port #2 (COM2).
However, the PASSTHRU.EXE program, when properly configured at a remote location,
will allow the MCAP Master Control software to dial up and connect to an MCAP running at
a remote location. To utilize this feature, follow this procedure:
Page 123
1.
On the MCAP Master Control menu bar, click on the "Settings" menu bar
option.
2.
When the pulldown menu appears, click on "Remote Connect Settings", then
“Com Port”. The display will now appear as in Figure 6-3.
Figure 6-3 Remote Connect ComPort Selection Menu
3.
Now click on the COM port which is connected to your modem (internal or
external). Next, click on “Remote Connect Settings”, then “Baud Rate”.
Select the baud rate at which your modem communicates with your PC (this
is not the same rate at which telephone communication of data occurs).
4.
Click on “Remote Connect Settings”, then “Phone Number/Password” to
bring up the following window:
Figure 6-4 Modem Phone Number / Password Window
Page 124
Type in the telephone number of the remote site’s modem, as well as the
password that the PASSTHRU.EXE program expects. When you are
satisfied that these are typed correctly, click on OK.
5.
To attempt remote connection through this port, first make sure that the
PASSTHRU.EXE program is operating on the remote site’s computer (which
must be connected to both a modem and the MCAP). Then, click on
“Settings”, then “Connect to Remote MCAP”. If any error messages appear,
there are many potential causes (PASSTHRU not running and/or not properly
configured at remote site, local modem not properly connected, bad
password, wrong phone number, etc). Recheck all connections and settings,
then repeat steps 1 through 5 until Status Icon shows the connection is
working. When it does, wait a few moments for the program to reset the
remote external processor. If the Input Level bargraphs eventually respond
to the input signal, then proper communication has been established.
6.
When you are ready to disconnect from the remote MCAP, Click on "File",
then "Exit" to exit the MCAP Master Control program. This will cause your
modem to hang up the telephone and break the connection.
Page 125
7. DEDICATED 920-LINE SPECTRUM ANALYZER OPERATION
The SPECDISP.EXE program provides a dedicated 920-line spectrum analyzer display
using the ANALYZER PC RS232 jack on the rear panel of the MCAP. The screen controls
are the same as for the 920-line spectrum analyzer included with the MCAP Master Control
software (see Section 4.7), except that signal selection and averager controls are disabled.
Essentially, this special utility program is slaved to the MCAP Master Control software; it
can only display the spectra as they are configured by the Master Control software.
To run the Dedicated Spectrum Analyzer, first connect any available COM port on the
computer that will run SPECDISP to the ANALYZER PC jack on the MCAP rear panel.
Then, click on the “Dedicated Spectrum Analyzer” icon in the MCAP Software program
group.
The program should automatically locate the MCAP ANALYZER PC port and begin
displaying spectra.
Page 126
8. PASSTHRU REMOTE MCAP OPERATION
PASSTHRU is a Windows program that runs at a Remote Location and allows an
operator at a Base Location to dial into the Remote Location and digitally link up to the
distant MCAP. Once the two locations are linked, the Base Location has full control of
the MCAP.
8.1
General System Configuration And Operation
Figure 8-1illustrates the connection between the various components of the remote
controlled MCAP system. At the Remote Location, the PC is running the PASSTHRU
program. This PC is connected to both the MCAP and the MODEM via two separate
serial communication ports. Since this PC will also be connected to a mouse, a total of
three serial ports is necessary. The MODEM is also connected to the local telephone
company line.
At the Base Location, the PC is running the normal MCAP Master Control Software.
This PC is connected to the MODEM via serial port. As above, since this PC will
require a mouse, a total of two serial ports may be necessary, unless a PS/2 mouse is
used. The MODEM is also connected to the local telephone company line.
Figure 8-1 System Configuration
When the Base Location operator starts the MCAP control program, the base PC dials
the Remote Location. The remote MODEM detects the ringing phone (the remote
operator must already have started the PASSTHRU program), answers it and tries to
establish a digital link with the caller. PASSTHRU performs caller authentication by
Page 127
transferring handshaking codes to the caller and requesting a maximum 25 character
user entered password. Once the caller is authenticated, the remote PC becomes a
digital gateway between the base PC and remote MCAP, transferring information in
both directions between the two devices.
After the Base Location operator is finished, the operator exits the MCAP Master
Control Software. This will cause the base MODEM to hang up and break the link.
Once PASSTHRU at the Remote Location determines that no activity is occurring on
the link, it will reset itself for the next caller.
The PASSTHRU program is designed to operate automatically. The program handles
all the overhead of maintaining the link on the Remote Location side of the system.
The operator is not needed during normal operation—only if a major error is detected.
An example of a major error would be if no MCAP were connected to the PC. Once the
program is operating, it constantly monitors the remote phone line and valid users to
dial in and link to the remote MCAP. Any break in the link will force the program to
hang up the phone and prepare for another caller.
8.2
Program Features and Options
This section illustrates the various options that are available in the PASSTHRU
program. After a one time initialization of the remote PC, two mouse clicks are all that
are required to start the program from Windows and allow the Base Location to access
the remote MCAP.
NOTE: It is strongly recommended that a “shortcut” be made to the PASSTHRU
program in the Start Menu, so that in the event of a power failure it can be quickly relaunched.
8.2.1 PASSTHRU Program Icon
Figure 8-2 shows the icon for the PASSTHRU program. This icon resides in the same
folder as the MCAP Control Program. Double click on this icon to start the PASSTHRU
program. Note that PASSTHRU cannot run at the same time as the MCAP Control
Program on the remote PC. Each program needs exclusive access to the MCAP and
cannot share this device at the same time.
Figure 8-2 PASSTHRU Program Icon
Page 128
8.3
PASSTHRU Program Main Screen
Figure 8-3 shows an example main control screen for the program. The MCAP
Connection box displays the current serial communication port (Com Port) and baud
rate for the MCAP connection. Similarly, the MODEM Connection box displays
information about the MODEM connection. This information may be different for each
remote PC since different serial ports and baud rates can be used.
The Status Icon always displays information about what the program is doing or what
the program expects the remote user to do. As shown in Figure 8-3, the program is
waiting for the user to click on the Auto Answer button before it allows the Base
Location to have access to the remote MCAP.
The program menu bar has two commands: Configure and Exit. Selecting Configure
allows the user to customize the Com Port and baud rate for each connection.
Configure also allows other customizations as described in the next section. Select
Exit to close the program.
Figure 8-3 PASSTHRU Program Main Screen
The action button at the bottom of the Main Screen has different functions at different
times and reflects what the program will do when the remote user clicks it. As shown in
the above figure, the present label is Auto Answer. The Current Status box always
gives an explaination of the action button. This button cycles through the the following
labels:
Page 129
Wait -- PASSTHRU is busy. Wait until a different label appears.
Auto Answer -- Click on this action button to instruct the program to perform the
steps necessary to automatically answer the phone.
Figure 8-4 Configure Drop-Down Menu
Abort -- PASSTHRU is testing the remote MODEM and MCAP. By clicking
Abort, the program will stop and wait for the remote user to select Auto
Answer again. After the devices are tested, the program will begin
monitoring the MODEM for ringing and automatically answer the phone.
Hang Up -- PASSTHRU has established a link to the Base Location. Click to
force the program to break the link by hanging up on the Base Location.
The program will wait for the remote user to select Auto Answer again.
8.3.1 PASSTHRU Configure Drop-Down Menu
Figure 8-4 shows the changes to the Main Screen when Configure is selected. This
new menu allows the remote user to customize the program. The remote user can
select the correct settings for the MCAP and MODEM serial communication
connections: Com Port Com1 through Com4 and baud rate 1200 through 38400.
Clicking on Advanced Session Setup will pop up the screen in Figure 8-5. This screen
should not need to be modified if the remote MODEM is compatible with the Hayes AT
Command Set. It is provided to allow any additional commands to be sent to the
MODEM. If the MODEM does not appear to be functioning properly, click on this menu
option to bring up the screen. Click on Default to set the screen to the factory defaults,
then click on OK to exit and use the new settings.
Clicking on Set Entry Password in the Configure Drop-Down Menu will pop up the
screen in Figure 8-6. This screen allows the remote operator set the password that is
Page 130
used to authenticate the Base Location when it attempts to link up to the remote MCAP.
The password is any collection of from 6 to 25 characters. The program automatically
converts lower case letters to upper case.
Figure 8-5 Advanced Session Setup Screen
Remember that both the base PC and remote PC have to agree on the same sequence
of characters. If the password box contains two words separated by a space (such as
"HELLO THERE"), the password at the Base Location must have the same sequence of
characters. If the base uses two spaces between the words ("HELLO THERE"), the
passwords will not match even though they look very similar to the eye.
Figure 8-6 Set Entry Password Screen
Clicking on About in the Configure Drop-Down Menu will pop up a screen displaying
the version number and copyright information for the PASSTHRU program.
8.4
Program Operation
This section describes the steps necessary to connect the Base Location PC to the
Remote MCAP.
Page 131
8.4.1 Base Location - One Time Initialization Only
1. Turn off power to the base PC and MODEM.
2. Connect the MODEM to the base PC with a serial cable.
3. Connect the MODEM to the phone line.
4. Turn on power to the PC and MODEM.
5. Double click the MCAP Master Control icon to start the MCAP Master Control
program.
6. From the pull-down menu, click on “Settings”, then “RemoteConnectSettings”.
Verify the com port and baud rate for the MODEM (change if necessary).
7. Click on “Settings”, then “RemoteConnectSettings”, then “Phone Number /
Password.”. Verify that the telephone number and password of the remote
location are set properly.
8. Click on “File”, then “Exit” to store these settings in a disk file and exit the
program.
8.4.2 Remote Location - One Time Initialization Only
1. Turn off power to the remote PC, MCAP and MODEM.
2. Connect the MCAP to the remote PC with a serial cable.
3. Connect the MODEM to the remote PC with a serial cable.
4. Connect the MODEM to the phone line.
5. Turn on power to the PC, MCAP and MODEM.
6. After Windows is running, double click the PASSTHRU icon to start the
PASSTHRU program.
7. Verify the com port and baud rate for the MCAP (change if necessary).
8. Verify the com port and baud rate for the MODEM (change if necessary).
Page 132
9. Click on Configure then Set Entry Password and enter a password. After
entering the password, click on OK to exit this screen.
10. Click Exit on the menu bar to exit PASSTHRU and store the newly entered
information.
8.4.3 Remote Location - Normal Operation Each Session
Start Program...
1. Verify the MCAP and MODEM are connected to the remote PC.
2. Verify the MODEM is connected to the phone line.
3. Turn on power to the PC, MCAP and MODEM.
4. Start Windows and verify the MCAP Master Control program is not running
on the remote PC.
5. Double click on the PASSTHRU icon to start the program.
6. Click on the Auto Answer button on the PASSTHRU Main Screen.
7. After PASSTHRU tests the MCAP and MODEM, the Current Status box
states that the program is waiting for the base user to call. If any other
message is displayed, correct the problem and then return to step 4 above.
PASSTHRU now monitors the phone line for ringing. The
program will answer and automatically connect any authorized
base location to the remote MCAP.
Exit Program...
1. After the Base Location has hung up and broken the link, wait for PASSTHRU
to detect the disconnection and change the action button label on the Main
Screen to Abort.
2. Click on the Abort button.
3. Wait for PASSTHRU to change the action button label on the Main Screen to
Auto Answer.
4. Click on Exit on the menu bar to exit the program.
Page 133
8.4.4 Base Location - Normal Operation Each Session
Start Program...
1. Verify the MODEM is connected to the base PC.
2. Verify the MODEM is connected to the phone line.
3. Turn on power to the PC and MODEM.
4. Start Windows and double click on the MCAP Master Control icon to start the
program.
5. Click on “Settings”, then “Connect to Remote MCAP” to dial up the remote
location and establish connection.
The MCAP Master Control program is now connected to the
remote MCAP. The base operator may operate the MCAP as
desired.
Exit Program...
1. Click on File, then Exit on the menu bar to exit the program.
8.4.5 In Case Of Trouble
Problem:
After I click on the Auto Answer button, PASSTHRU never displays the message
"Waiting for remote user to call."
Suggestion:
PASSTHRU CANNOT RUN AT THE SAME TIME AS THE MCAP CONTROL
PROGRAM. EXIT THE MCAP CONTROL PROGRAM. The MODEM must be
compatible with the Hayes AT Command Set. Read the text in the Current
Status box. This information is designed to help the remote operator correct any
problems.
Problem:
PASSTHRU is waiting for the remote user to call, but the MODEM never seems
to detect a ringing phone.
Suggestion:
Page 134
Make sure the phone line is plugged into the correct jack on the MODEM. Make
sure the phone line is active by plugging a regular phone into the phone line and
verifying the presence of a dial tone. Make sure the settings in the Advanced
Session Setup are correct.
Page 135
9. MCAP SPECIFICATIONS
Analog Input/Output
•
Four rear-panel BNCs. Balanced differential input
•
Zin = 25kΩ, level adjustable -8 to 15 dBm
•
Two rear-panel BNCs.
•
Zout = 100Ω, Level = +8 dBm.
•
Dual front panel stereo jacks with volume control
•
Source switches for monitoring MCAP’s Main inputs,
Reference inputs, or Outputs; Left/Stereo/Right selection
Input Level Indicators
•
Four tricolor LEDs. Red (-6 dB), orange (-12 dB), green
(-18 dB).
Bandwidth
•
3.2, 5.4, 6.5, 8.0, 11.0, and 16.0 kHz selectable
•
35 Hz AC input coupling
•
Two 24-bit sigma-delta stereo A/D converters on analog
inputs.
•
24-bit delta-sigma stereo D/A converter for line outputs
•
24-bit delta-sigma stereo D/A converter for headphone
monitoring
Signal Processing
•
7.2, 12, 14.4, 18, 24, and 36 kHz
Dynamic Range
•
>90 dB.
Line Inputs (4)
Line Outputs (2)
Headphone Outputs
Analog Conversion
Digital Input and Output
Interface
•
AES/EBU professional format transmitter and receiver with
XLR connectors
•
Simultaneous analog and digital outputs
Page 136
•
32, 44.1 and 48 kHz data rates
•
8192 tap dynamically configurable adaptive/fixed digital
filter array.
•
Two dedicated 256-tap FIR equalizers
•
Four input and two output 255th-order linear-phase digital
highpass rumble filters
Digital Processing
Digital Filters
Limiter
•· Microprocessor controlled
•
Adjustable release time and threshold
Microprocessor
•
Four TMS320C50 20 MHz, allocated to control
analog/digital conversion, real-time signal processing, filter
synthesis and control, and real-time FFT spectral analysis
Digital Filter
Processors
•
Forty-three DSP56200 FIR filter microprocessors
Memory
•
Two 64k x 8 boot EPROMs, four 32k x 16 program RAMs,
32k x 16 signal processing delay RAM, 32k x 16 FFT RAM,
512k x 8 flash memory for program and coefficient storage,
4 megabyte DRAM for input signal delays, six 1024 x 8
FIFO communications buffers
Computer Interface
•
Dual RS232 serial interfaces for system control and
dedicated spectrum analyzer display. 9600 to 38,400
selectable baud transfer rate
•
1.75" H x 19.0" W x 15" D, 10 lbs.
•
Rugged aluminum enclosure
•
Optional rack-mount kit available
Construction
Packaging
Power
•· 85 VAC to 264 VAC, 47 to 440 Hz auto-switching power
supply, built-in
Page 137
Host Computer
•
Optional 12 VDC power supply available
•
Requires Windows™ 95/98/NT desktop or laptop system
with CD-ROM minimum 800 x 600 screen resolution, and at
least 50 MB free hard disk space. At least on free RS232
(COM) port required for connection to MCAP, USB adapter
available.
Signal Processing Functions
•
Mono: 1CH, 2CH, 3CH, 4CH
•
Stereo: 1CH, 2CH
Adjustable Filters
•
Lowpass, Highpass, Bandpass, Bandstop, Notch, Slot,
Comb, and Inverse Comb
Special Filters
•
Hi-res graphic filter
•
Stereo spectral inverse filters (SIF)
Equalizers/Misc.
•
20-band graphic, spectral graphic, and parametric.
Compressor/Expander also available in all positions
Other Processing
•
Microprocessor-controlled stereo limiter on analog inputs
•
Output digital automatic gain control
•
Adjustable four-channel macro delay for gross signal delay
line compensation
•
Adjustable in one sample steps to 512k samples (43
seconds, max at 5.4kHz BW)
•
Dual-channel, 70dB dynamic range display
•
920 line resolution both on Master Control display and
dedicated PC display via separate RS232 port
Adaptive Filters
Path Delay
Spectral Analysis
Specifications subject to change without notice.
Page 138