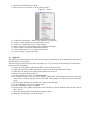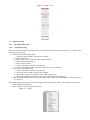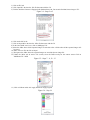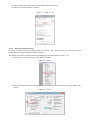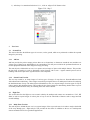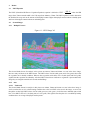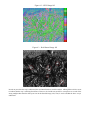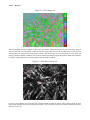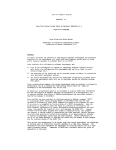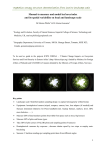
1
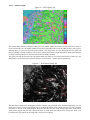
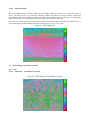
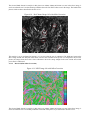
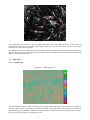
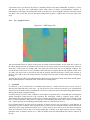
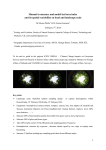
This is the author’s version of a work that was submitted/accepted for publication in the following source: Yeow, Daryl Teik & Etse, Victor Kwesi (2014) Evaluation of a Multispectral Camera on a UAV for Agricultural Applications. ARCAA Remote Sensing Techical Reports. Queensland University of Technology, Brisbane, Qld. This file was downloaded from: http://eprints.qut.edu.au/90130/ c Copyright 2014 Queensland University of Technology Notice: Changes introduced as a result of publishing processes such as copy-editing and formatting may not be reflected in this document. For a definitive version of this work, please refer to the published source: Evaluation of a Multispectral Camera on a UAV for Agricultural Applications Technical Report Daryl Teik Yeow, Victor Kwesi Etse Queensland University of Technology (QUT) Brisbane, QLD, Australia Abstract Australian farmers have used precision agriculture technology for many years with the use of ground – based and satellite systems. However, these systems require the use of vehicles in order to analyse a wide area which can be time consuming and cost ineffective. Also, satellite imagery may not be accurate for analysis. Low cost of Unmanned Aerial Vehicles (UAV) present an effective method of analysing large plots of agricultural fields. As the UAV can travel over long distances and fly over multiple plots, it allows for more data to be captured by a sampling device such as a multispectral camera and analysed thereafter. This would allow farmers to analyse the health of their crops and thus focus their efforts on certain areas which may need attention. This project evaluates a multispectral camera for use on a UAV for agricultural applications. 1 Introduction Remote sensing for agricultural applications has existed since the 1950s where scientists used aerial photography to assess the health of crops. Up until recent times, these images were not an effective way of assessing the health of crops in an area. With the emergence of Unmanned Aerial Vehicles (UAVs) and various technologies such spectral cameras and sensors, remote sensing for agricultural applications is becoming increasingly popular due to its effectiveness and ease of use. UAS design, path planning and UAVs for agriculture is an active field of research [116]. The use of multispectral cameras, mounted on a UAV, provides valuable data that cannot be captured with the use of standard photography. A multispectral camera captures the amplitude of each wave at specific frequencies on the electromagnetic spectrum, in particular the Visible (VIS) and Near Infrared (NIR) ranges. These captured images can be used for post – flight analysis on the computer software, Tetracam PixelWrench2 which calculates the vegetation indices, in order to assess the health of crops and etc. In this report, the procedures for the various types of test cases and the results from the post – flight analysis are covered. These aspects will lead to the feasibility of utilising a multispectral camera on-board a UAV for agricultural applications. The main objective of this project is to evaluate the usage of a multispectral camera on a UAV for agricultural applications. The aim is to utilise the Tetracam Mini – MCA6 multispectral camera and mount it onboard the DJI S800 UAV in order to capture images of an agricultural area for post – flight analysis. 2 2.1 Procedures Ground Test The ground test procedures described here shows the steps taken to obtain ground images on the multispectral camera for analysis. The following steps describe the steps taken to perform a ground test without a computer: 1.) 2.) 3.) 4.) 5.) Connect a voltage regulator to the Tetracam Mini – MCA6 [17,18] Connect a 4 cell LiPo battery to the voltage regulator Steps 1 and 2 can be replaced by using the supplied power adapter Trigger the camera by pressing the red button in the back panel The following steps are optional and depends on whether the user wants to use a controller box to capture images instead of using the red trigger button: i. Connect the controller box to the Tetracam Mini – MCA6 ii. Trigger the camera by pressing the ‘Take Pic’ button The following steps describe the steps taken to perform a ground test with a computer: 1.) Open Tetracam PixelWrench2 software 2.) Move cursor to 'View' & click on ‘Show Camera Toolbar’ Figure 2.1 – Step 2 3.) 4.) 5.) 6.) 7.) 8.) 9.) 2.2 Connect the Tetracam Mini – MCA6 to the computer via a USB Cable Connect a voltage regulator to the Tetracam Mini – MCA6 Connect a 4 cell LiPo battery to the voltage regulator Steps 4 and 5 can be replaced when using the supplied power adapter Click on ‘Status’ in the camera toolbar and select MCA Click on ‘Open Camera’ to view imagery of the camera Click on ‘Trigger’ to capture the image Flight Test The flight test procedures described here shows the steps taken to obtain images on the multispectral camera that is mounted on the UAV for analysis. The following steps describe the steps taken for setting up on a TV (television) and mounting the Tetracam Mini – MCA6 on a UAV for flight test: 1.) Connect the power adapter to the Tetracam Mini – MCA6 and a power socket 2.) Connect the controller box and Tetracam Mini – MCA6 to the MCA controller multi I/O cable 3.) Connect the AV (Audio Video) cable from the controller box to the TV 4.) Switch on the power adapter and the TV 5.) Use the controller box to select ‘CAPTURE METHOD’ 6.) Set the desired settings such as the ‘SAVE MODE’, ‘FIXED EXP’ which changes the amount of time each image will be exposed to light and ‘CONT CAPTURE’ which changes the capturing method to continuous mode 7.) Press the ‘Menu’ button on the controller box to return to the main menu 8.) Use the controller box to select the ‘SETUP’ menu 9.) Set the ‘USB MODE’ setting to ‘CAMERA’ 10.) Switch off the power adapter and disconnect the controller box and the attached cable from the Tetracam Mini – MCA6 11.) Screw the mounting bracket with the Tetracam Mini – MCA6 12.) Mount the Tetracam Mini – MCA6 on the UAV Figure 2.2 – Steps 7 to 9 2.3 Image Processing 2.3.1 2.3.1.1 Tetracam PixelWrench2 Normal Processing Before processing the images, the images have to be transferred from the multispectral camera to a computer. The following steps were taken 1.) If user connects with Camera mode: i. Connect the Tetracam Mini - MCA6 to the computer ii. Open PixelWrench iii. Move cursor to 'View' & click on 'Show Camera Toolbar' iv. Click on status & select 'MCA' v. Click on 'Open Camera' vi. Create a new folder to store the raw image files vii. Click on 'Xfr Images' & select the newly created folder to store the images 2.) If user connects with USB mode i. Create a new folder to store the raw image files ii. Connect the Tetracam Mini - MCA6 to the computer iii. Open windows explorer & select one of the 6 USB storage devices iv. Transfer the images from each folder to the newly created folder store the images 3.) Note: all transferred images must be stored in a single folder to allow for PixelWrench2 to combine the images as 1 image file The following steps were taken to process each image captured on the Tetracam Mini – MCA6 multispectral camera: 1.) Open PixelWrench2 software 2.) Move cursor to 'View' & click on 'Index Tools' Figure 2.3 – Step 2 3.) Click on 'ILS' tab 4.) Click 'Open ISC' & select the .ISC file that came with the CD 5.) Tick the checkbox 'Camera is Equipped with Incident Sensor' & ‘Do not write Incident Sensor image to Tif’ Figure 2.4 – Steps 2 to 5 6.) Click on the 'MCA' tab 7.) Click on 'Open MCA' & select the .MCA file that came with the CD 8.) In the 'Save RAW sets as' row, click on 'Multipage Tifs' 9.) Select the folder where all the imported images are stored & select a folder where all the exported images will be stored 10.) Move cursor to 'File' & click on 'Open' 11.) Navigate to the folder where the exported images are stored & select an image file 12.) Under the 'MCA' tab & 'Active File' section, select the RGB overlay for the camera sensor Click on 'Multiframe Tif > RGB' Figure 2.5 – Steps 7 – 8, 12 – 13 13.) Click on 'Pallette' tab & tick 'Apply Pallette' & 'Apply Legend' Figure 2.6 – Step 14 14.) Click on 'Index' & select the type of index method in the dropdown box 15.) Click on 'Calibrate' followed by 'Execute' Figure 2.7 – Steps 15 – 16 2.3.1.2 Offset Correction Processing In order to correctly process some images which were taken at a close distance to the crop of interest, an offset correction has to be applied when processing such images. The following steps have to be taken before the undertaking the steps mentioned in Section 3.1.1.1: 1.) Move cursor to ‘View’ and click on ‘FOV Optical Calculator Figure 2.8 – Step 1 2.) Input the distance between the multispectral camera and the object of interest under the ‘Object Distance (m)’ text box Figure 2.9 – Step 2 3.) After Step 13 as mentioned in Section 3.3.1.1, click on ‘Align to FOV distance value’ Figure 2.10 – Step 3 3 Test Cases 3.1 Ground Test This section describes the different types of test cases, on the ground, which were performed to obtain the captured images for processing. 3.1.1 ARCAA ARCAA provides the perfect vantage point as there are no obstructions or whatsoever around the area and there are various types of plants, trees and buildings in its surroundings. This will prove useful for the performed bench tests to test the equipment and obtain some images for image processing. The main objective behind this test case is to capture various images of places with multiple features. This provides the best form of analysis in order to distinguish various features such as non – organic material present such as buildings and vehicles apart from vegetation such as trees and plants. 3.1.2 Gatton Farm Test Site The next step would be to obtain images of various types of images of crops that are diseased/undiseased and with/without nutrient deficiency. These images areuseful in proving that the use of multispectral cameras for analysing the health and status of crops. The main objective behind this test case is to capture images of various types of crops in order to analyse their health and status. This provides the best form of analysis in determining whether these crops are in a healthy condition and/or if they are suffering from some form of disease 3.2 Flight Test This section describes the flight test case scenario whereby the multispectral camera was mounted on a UAV, DJI S800, in order to capture images of various plots of crop as well as other kinds of features such as empty land and erected buildings. 3.2.1 Dalby Farm Test Site The main objective behind this test case is to capture images of the crops at the test site in order to analyse the health of the crops through post – flight analysis. This provides the best form of validation to the use of a multispectral camera mounted on UAVs for agricultural applications. 4 Results 4.1 NDVI Equation The NDVI (Normalized Difference Vegetation Equation) equation is defined as NDVI NIR R , where the NIR NIR R ranges from 750nm onwards and R is the VIS range from 400nm to 750nm. The NDVI equation is used to determine the health of the crops such as the amount of chlorophyll content. Higher chlorophyll content indicates a healthy plant and lower chlorophyll content indicates an unhealthy plant. 4.2 Ground Images 4.2.1 Multiple Features Figure 4.1 – NDVI Image 362 The selected bands chosen for analysis in this picture are 660nm, 720nm and 810nm. As seen in the above image, there are many variations of the NDVI shown. The NDVI values of 0.588 (dark green) and 0.706 (green) shows that the vegetation are in healthy condition. Whereas other vegetation with values of 0.118 (dark pink) and 0.235 (pink) signifies that the vegetation are unhealthy. All other NDVI values below 0 indicate no vegetation is present and in this image they are inorganic material such as roads and buildings. 4.2.2 4.2.2.1 Oats Undiseased The selected bands chosen for analysis in this picture are 660nm, 720nm and 810nm. As seen in the above image, it can be seen that the oat is in a deteriorating condition due to the low NDVI values seen in the image. As seen even though the oat has high NDVI values of 0.706 (dark green) to 0.941 (green), it also has more unhealthy parts which have a low NDVI value of 0.118 (dark pink) to 0.235 (pink). This signifies that the plant is in a moderately healthy condition due to its average chlorophyll content present. Figure 4.2 – NDVI Image 182 Figure 4.3 – Red Channel Image 182 In order to prove that the crop is undiseased, the red channel band was used for analysis. Although the red circles seem to indicate that the crop is suffering from disease. However, the circled areas are due to overexposure as a result of the strong sunlight rather than the white spots seen in the diseased image (168). Thus, it can be said that the above crop is undiseased. 4.2.2.2 Diseased Figure 4.4 – NDVI Image 168 The selected bands chosen for analysis in this picture are 660nm, 720nm and 810nm. As seen in the above image, it can be seen that the oat is in healthy condition as they have high NDVI values of 0.706 (dark green) to 0.941 (green). Although there are some portions of the pixels indicate a low NDVI value of 0.118 (dark pink) to 0.235 (pink), the plant is generally in healthy condition. Thus it can be said that the plant has a high chlorophyll content which indicates its ability to photosynthesise for nutrients and maintain its healthy condition. Figure 4.5 – Red Channel Image 168 In order to prove that the crop is diseased, the red channel band was used for analysis. The red circles show the areas which show indication of the crop suffering from disease. The circled white spots in the picture indicate the presence of disease in the crop. 4.2.2.3 Simulated Flight Figure 4.6 – NDVI Image 210 The selected bands chosen for analysis in this picture are 660nm, 720nm and 810nm. As seen in the above image, it can be seen that the oat is in healthy condition as they have high NDVI values of 0.706 (dark green) to 0.941 (green). Although there are some portions of the pixels indicate a low NDVI value of 0.118 (dark pink) to 0.235 (pink), the plant is generally in healthy condition. Thus it can be said that the plant has a high chlorophyll content which indicates its ability to photosynthesise for nutrients and maintain its healthy condition. The picture towards the left shows the soil and the human foot which is seen to have NDVI values of below 0, 0.118 (dark pink) to -0.706 (dark purple) which is indicative of soil and non – organic material respectively. Figure 4.7 – Red Channel Image 210 The same form of analysis for checking the presence of disease was performed on the simulated flight image. As seen in the above image, it can be seen that the crop is not diseased and that circled white spot areas are due to a higher reflectance as a result of the strong sunlight. However, there are two areas in the bottom right corner of the picture which seem to suggest that this crop is diseased as there are some white spots which can be clearly seen. Thus, it can be said that the crop captured in this image has a low presence of disease. 4.2.2.4 Nutrient Deficient The selected bands chosen for analysis in this picture are 660nm, 720nm and 810nm. As seen in the above image, it can be seen that the oats are in extremely unhealthy condition and lack the necessary nutrients required for photosynthesis. This can be evidently seen since most of the oats have NDVI values of 0 (orange) to 0.118 (dark pink). The low NDVI value is a strong indication of the unhealthy status of the crops in the area. Also other non – organic materials are shown to have NDVI values below 0 such as the road having a NDVI value of 0.235 (greenish blue) and the building with NDVI values between -0.118 to -0.353 (cyan). Figure 4.8 – NDVI Image 109 4.3 Ground Images with Offset Correction 4.3.1 4.3.1.1 Oats Undiseased (0.5m Offset Correction) Figure 4.9– NDVI Image 182 with Offset Correction The selected bands chosen for analysis in this picture are 660nm, 690nm and 810nm. As seen in the above image, it can be seen that the oat is in a deteriorating condition due to the low NDVI values seen in the image. The health of the plant is similar to that as described in Section 4.2.2.1. Figure 4.10 – Red Channel Image 182 with Offset Correction This analysis is as per performed in Section 5.2.2.1 to prove that the crop is undiseased. The difference between the above image and the one analysed in the earlier section is the resolution of the picture. As compared to the previous picture, the image shown above has a lower reflectance due to the strong sunlight in the same circled areas which prove that it is undiseased. 4.3.1.2 Diseased (0.5m Offset Correction) Figure 4.11– NDVI Image 168 with Offset Correction The selected bands chosen for analysis in this picture are 660nm, 690nm and 810nm. As seen in the above image, it can be seen that the oat is in a healthy condition. The health of the plant is as per described in Section 4.2.2.2. Figure 4.12 – Red Channel Image 168 with Offset Correction As per described in Section 4.2.2.2, the crop shown here is diseased and can be seen in the above image where the diseased spots are, characterised by the white spots. As seen in the offset corrected images, these images have some parts of the pictures cropped as compared to the images in Section 4.2.2.2. However, the main difference is that the resolution, in the images with offset correction, has clearly defined diseased spots as shown in the red channel analysis in Figure 4.12. 4.3.1.3 Simulated Flight (0.8m Offset Correction) Figure 4.13 – NDVI Image 210 with Offset Correction The selected bands chosen for analysis in this picture are 660nm, 690nm and 810nm. The health of the plant is as per described in Section 4.2.2.3. Figure 4.14 – Red Channel Image 210 with Offset Correction As per described in Section 4.2.2.3, the crop shown here suffers from some disease as there is some presence of diseased spots which can be seen in the bottom right of the picture. The other white spots seen are due to higher reflectance as a result of strong sunlight. As mentioned in the earlier sections, the purpose of offset correction is to improve the resolution of where the diseased spots are. However, this is not the seen for the case of this image as the locations of the white spots are similar to the analysis performed in Section 4.2.2.3. 4.4 4.4.1 Flight Image Example Crop Figure 4.15 – NDVI Image 476 The selected bands chosen for analysis in this picture are 660nm, 720nm and 810nm. As seen in the above image, the crops have NDVI values of 0 (orange), 0.118 (dark pink) and 0.235 (pink colour) which means that vegetation is present and they are in unhealthy condition. Soil is shown to have a NDVI value of -0.235 (greenish blue). All other NDVI values below 0 indicate no vegetation is present. As mentioned, the crops shown in the picture are unhealthy. Based on the chosen bandwidths for analysis, it can be said that the crops have lower chlorophyll content which affects its ability to photosynthesise. Inability to photosynthesise will hamper the health/growth of the crops. However, due to the higher altitude in which this picture was taken, it can be seen there are some inaccurate readings whereby there is a NDVI value of 0 in some parts of the crops. 4.4.2 Non – Organic Features Figure 4.16 – NDVI Image 506 The selected bands chosen for analysis in this picture are 550nm, 690nm and 810nm. As seen in the above image, all the colours indicate towards no vegetation present in the area. It can be seen there are some plants present in the area which have a NDVI value of 0 (orange) and 0.118 (dark pink) which means they are in unhealthy condition. The erected tent has a NDVI value of -0.471 (dark blue) which indicates an inorganic material. The shed has a NDVI value of 0 and 0.118 which is not in line with the fact that an inorganic material should have a NDVI value of below 0. However, this could be due to the strong reflection of sunlight which may affect the filter bands chosen for analysing the image. As mentioned, the low NDVI value indicates that the plants have low chlorophyll content which means that the plant’s ability to photosynthesise is hampered which in turn affects its health/growth. 5 Conclusion In conclusion, it can be said that the use of multispectral cameras is a feasible idea and can be used as a form of analysing the health and status of the crops. As seen in Section 4, the results prove that the use of a multispectral camera provide invaluable amount of information over an area of vegetation such as the health through NDVI analysis and the status through red channel analysis. For NDVI analysis, the NDVI value is indicative of the health of vegetation and is a useful indicator in knowing the amount chlorophyll content present in the vegetation. The chlorophyll content is indicative plant’s ability to photosynthesis the required nutrients in order to grow. A healthy plant will have a high NDVI value of at least 0.5 and above. A NDVI value that is lower than 0.5 is indicative of an unhealthy plant and a value of below 0 is indicated of non – organic materials such as buildings and manmade objects as explained in Section 4.2.1. For red channel analysis, the white spots are indicative of disease present in the crops and are a useful indicator in knowing the presence of diseases in the vegetation. However, there are some exceptions whereby diseases that are not present such as the image explained in Section 4.2.2.1. For the image in this section, it can be seen there are bands of white areas and these areas are due to the strong sunlight that is shining on the plant and thus will have a higher reflectance value. As shown in Section 4.3.1.2, there are distinct white spots which indicate the presence of disease in the crop. References 1. Lee, D.-S., Periaux, J., Gonzalez, L.F. UAS mission path planning system (MPPS) using hybrid-game coupled to multi-objective optimiser. J. Dyn. Syst. Meas. Control 2009, 132, 1–1 2. J.Pèriaux,D.S.Lee, L.F.Gonzalez, K.Srinivas,Fastreconstructionofaerody-amic shapes using evolutionary algorithms and virtual Nash strategies in a CFD design environment. J.Comput.Appl.Math. 232(2009) 61–71. 3. Gonzalez, L. F., Lee, D.-S., Walker, R. A., and Periaux, J. (2009). Optimal mission path planning (mpp) for an air sampling unmanned aerial system. In Scheding, S., editor, 2009 Australasian Conference on Robotics&Automation, pages 1–9, Sydney. Australian Robotics & Automation Association." 4. Lee D, Gonzalez L, Srinivas K, Auld D, Periaux J (2007) Multiobjective/multidisciplinary design optimisation of blended wing body UAV via advanced evolutionary algorithms. In: Collection of technical papers, 45th AIAA Aerospace Sciences Meeting, vol 1.pp 296-316 5. Lee, DS, Gonzalez, L.F., Whitney E.J. Multidisciplinary Multi-fidelity Design tool: HAPMOEA-User Guide, 2007 6. Gonzalez, L.F., Whitney, E.J., Periaux, J., Sefrioui, M., and Srinivas, K. (2004). A robust evolutionary technique for inverse aerodynamic design. Design and Control of Aerospace Systems Using Tools from Nature. In Proceedings of the 4th European Congress on Computational Methods in Applied Sciences andE ngineering. Vol. 2, pp 24-28 7. Gonzalez, L.F., Whitney, E.J., Srinivas, K., and Periaux, J. “Optimum Multidisciplinary and Multi-Objective Wing Design in CFD Using Evolutionary Techniques”, Proceedings of International Conference on Computational Fluid Dynamics 3, Toronto, Canada, July 12-14, 2004 8. D. S. Lee, L. F. Gonzalez, J. Periaux, and K. Srinivas, Evolutionary Optimization Methods with Uncertainty for Modern Multidisciplinary Design in Aerospace Engineering (100 Volumes of ‘Notes on Numerical Fluid Mechanics’). Heidelberg, Germany: Springer, 2009, ch. 3, pp. 271–284. 9. Periaux, J. Gonzalez, L.F, Whitney,J.W., Srinivas, K. MOO methods for multidisciplinary design using parallel evolutionary algorithms, game theory and hierarchical topology: Practical application to the design and optimisation of UAV systems (Part 1). Von Karman Institute (VKI) Lecture Series, Introduction to Multidisciplinary to Optimisation and Multidisciplinary Design: Applications to Aeronautics and Turbomachinery, March 6–10, 2006.Tetracam Inc. (2014). 10. Antic, B., Culibrk, D., Crnojevic, V. & Minic, V. (2009): “An Efficient UAV Based Remote Sensing Solution for Precision Farming”. In: BioSense09 - The First International Workshop on ICT and Sensing Technologies in Agriculture, Forestry and Environment, Novi Sad, Serbia, October. 11. Saari, Heikki, Ismo Pellikka, Liisa Pesonen, Sakari Tuominen, Jan Heikkilä, Christer Holmlund, Jussi Mäkynen, Kai Ojala, and Tapani Antila (2011). "Unmanned Aerial Vehicle (UAV) operated spectral camera system for forest and agriculture applications." In SPIE Remote Sensing, pp. 81740H-81740H. International Society for Optics and Photonics. 12. Arnold, T., De Biasio, M., Fritz, A., Frank, A., & Leitner, R. (2012). UAV-based multi-spectral environmental monitoring. In SPIE Defense, Security, and Sensing (pp. 836005-836005). International Society for Optics and Photonics. 13. Turner, D., Lucieer, A., & Watson, C. (2011, April). Development of an Unmanned Aerial Vehicle (UAV) for hyper resolution vineyard mapping based on visible, multispectral, and thermal imagery. In Proceedings of 34th International symposium on remote sensing of environment (p. 4). 14. Berni, J. A. J., Zarco-Tejada, P. J., Suárez, L., González-Dugo, V., & Fereres, E. (2009). Remote sensing of vegetation from UAV platforms using lightweight multispectral and thermal imaging sensors. Int. Arch. Photogramm. Remote Sens. Spatial Inform. Sci, 38, 6. 15. Zarco-Tejada, P. J., Berni, J. A., Suárez, L., Sepulcre-Cantó, G., Morales, F., & Miller, J. R. (2009). Imaging chlorophyll fluorescence with an airborne narrow-band multispectral camera for vegetation stress detection. Remote Sensing of Environment, 113(6), 1262-1275. 16. De Biasio, M., Arnold, T., Leitner, R., McGunnigle, G., & Meester, R. (2010, April). UAV-based environmental monitoring using multi-spectral imaging. In SPIE Defense, Security, and Sensing (pp. 766811-766811). International Society for Optics and Photonics. 17. Tetracam Inc. (2014). Recommendations For Band Pass Filter Selections. http://www.tetracam.com/Tetracam%20%20Recommendations%20for%20Band%20Pass%20Filter%20Selection.htm 18. Tetracam Inc. (2014). MCA User Manual. Retrieved from http://www.tetracam.com/PDFs/MCA_User_Manual.pdf Retrieved from