1
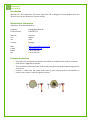
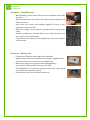
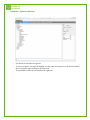
ArborSonic 3D
User’s Manual
ArborSonic 3D
User’s Manual
Introduction
3
Manufacturer information
3
Principle of operation
3
Hardware – System parts
4
Hardware – Handling the Piezo Sensors
5
Hardware – Amplifier boxes
6
Hardware – Battery box
6
Hardware – Bluetooth connection
7
Software – Basics
8
Software – Species selection
9
Software – Sensor Geometry – Basics
10
Software – Sensor Geometry – Circular, Elliptical and Irregular
11
Software – Time Data
12
Software – Tomograms – Single-layer mode
13
Software – Tomograms – Multi-layer mode
14
Software – Static Analysis
15
Software – Generating reports
16
ArborSonic 3D
User’s Manual
Introduction
Welcome as a new ArborSonic 3D owner. ArborSonic 3D is designed to detect hidden holes and
decay in trees by non-destructive acoustic testing.
Manufacturer information
ArborSonic 3D is manufactured by:
Company:
EU tax number:
Fakopp Enterprise Bt.
HU22207573
Address:
City:
ZIP:
Country:
Fenyo 26.
Agfalva
9423
Hungary
Web:
E-mail:
Phone:
Fax:
http://www.arborsonic3d.com
[email protected]
+36 99 510 996
+36 99 330 099
Principle of operation
•
•
•
•
Several Sensors are placed around the trunk, which are coupled to the wood by steel nails.
Each Sensor is tapped by a hammer.
The unit measures the travel-time of the sound wave generated by the hammer tap between
each sensor.
If there is a hole, then the sound waves have to pass around the hole and therefore it
requires more time to reach the opposite sensors.
ArborSonic 3D
User’s Manual
Hardware – System parts
Piezo Sensors
Amplifier Boxes (black)
Battery Box (grey) containing the Bluetooth transmitter
Cables
Caliper
Sensor Remover
Tape measure
Steel and rubber hammer
Case
Building up
Drive the Sensors into the trunk, connect them to the Amplifier boxes
and connect the Amplifiers and the Battery Box with the cables.
ArborSonic 3D
User’s Manual
Hardware – Handling the Piezo Sensors
Maintenance
•
•
Always keep the nails and the head clean because dirt influences the coupling.
The numbers on the sensors are just decoration, you can change them freely (however the
numbers on the amplifier boxes are important).
Fixing
•
•
•
•
•
•
•
Use the rubber hammer to fix the sensors
The sensors need to penetrate the bark
Good coupling between the nail and the wood is essential. The coupling is good if the sensor
head can’t be rotated with 3 stretched fingers.
The sensors need to be in intact wood material, not in decay.
The software requires the penetration depth (PD parameter on the Spatial Data tab) of the
sensors. This parameter is only important in case of small diameter trees and the value is
not critical in case of large trees.
The sensor nails need to pint in the center of the trunk, however this is also not very critical.
The sensors need to be placed in the same plane. However this plane doesn’t necessarily
have to be horizontal.
Measurement
•
•
•
•
•
Use the steel hammer for generating the readouts by tapping on the sensor heads.
Remove the tape measure while tapping because it may act as an acoustic short-circuit.
Always tap on the center of the sensor head in the nail direction. If you accidentally tapped
the side of the sensor, remove the data and tap again.
Tap with uniform strength. Apply more power for large trees. Tapping power is not very
critical.
Never tap on the cable connection part of the sensor.
Removal
•
•
•
•
Use the sensor remover if possible.
When removing by hand, first rotate the sensors and then pull. Always pull in nail direction.
Never pull the cable
Never use any support to remove the sensors because it may break or bend the nails.
ArborSonic 3D
User’s Manual
Hardware – Amplifier boxes
•
•
•
•
•
•
When building up, first fix the sensors, then the amplifiers and finally
the cables
When breaking down, first remove the cables, then the amplifiers and
finally the sensors
Never move the sensors with attached amplifiers because it may
damage the cable connectors.
Make sure to apply correct connector orientation when connecting the
cables.
Amplifier numbering is essential. Don’t cross a cable because it will
mess up the whole measurement.
Connect the bottom connector of an amplifier box to the side connector
of the next box.
Hardware – Battery box
•
•
•
•
•
•
•
Contains the 9V battery and the Bluetooth transmitter.
Keep the Battery Box turned off while connecting the Amplifier Boxes.
The battery box can be connected to any amplifier box.
Make sure to apply correct polarity when changing battery.
Any regular or rechargeable 9V battery can be used.
The LED blinks for 5 seconds after turning on. This is the time required
for the Bluetooth module to warm up.
If the battery is low, the LED blinks continuously.
ArborSonic 3D
User’s Manual
Hardware – Bluetooth connection
Establishing Bluetooth connection to the Battery Box
•
•
•
•
If you are using an external USB Bluetooth dongle, always put it in the same USB place on
the computer.
Turn on the Battery Box, start adding a New Bluetooth device in the Control Panel. The
device name is ArborSonic 3D.
The PIN code of the device is 1234.
Remember the number of the installed COM port.
Start the software.
•
Go to the options
•
Change the
•
Go to
•
Select the COM port number and set the
•
Turn on the Battery Box, wait 5 seconds until the LED stops blinking and click
build up the connection.
•
The
message should appear, if the connection can be established.
Otherwise an error message appears.
If the connection can be established, you can start tapping on the sensors. Each tap should
result in a new time row and a ding sound.
•
•
•
•
•
.
to
and click the
and click
.
button on this tab.
to 20 and click
.
to
When you are ready with tapping,
the connection first and then turn off the Battery
Box to save battery.
Maximum Bluetooth range is 20 feet.
If you need to extend the range, longer cable cam be used on the amplifier box.
If you can’t establish Bluetooth connection
1. Turn off the Battery Box, turn it on again and try reconnecting to it.
2. The COM port number may be wrong. Try to find out the correct number.
3. Remove the Bluetooth Device in the Control Panel and install it again. Set the newly
installed COM port number in the software.
4. Call us for support.
ArborSonic 3D
User’s Manual
Software – Basics
•
•
•
The latest version of the software can be downloaded at http://www.arborsonic3d.com.
The software can be installed to any PC with Windows XP or higher.
The software is responsible for:
o Selecting parameters of the tree (species, ...)
o Registering the geometry of the sensors
o Collecting the time data from ArborSonic 3D over Bluetooth
o Computing the internal cross-sectional tomogram
o Performing stability calculations of the whole tree
o Generating a report file for customers
o Saving and opening previous projects
•
The steps of a measurement are:
1. Choosing the measurement Layer on the trunk.
2. Placing the sensors and registering the sensor geometry
3. Collecting time data by tapping
4. If measurements at several layers are required, choose the next layer and go to 2.
5. Evaluating the cross-sectional maps
6. Performing stability computations
7. Saving the data and exporting to the printable report
ArborSonic 3D
User’s Manual
Software – Species selection
•
•
•
Use the list to select the tree species.
To search a species, just type the English or Latin name of the species in the edit box below
the list and press enter to jump to the next result.
The parameters of the tree are listed on the right side.
ArborSonic 3D
User’s Manual
Software – Sensor Geometry – Basics
•
•
•
•
•
•
•
•
•
•
•
•
The software can handle measurements at several different heights. These are the so-called
Layers. The sensors can be placed at one Layer at a time and need to be moved between the
Layers after collecting the Time Data. Please disconnect the cables when moving between
Layers, otherwise the connectors may be damaged.
Use the
button to add a new layer and user the
button to remove one.
The name of each layer can be changed in the Layer Name field.
The height of a layer from the ground can be defined in the Height field.
The length units (cm or inch) can be changed in the Measure in: cm/inch field.
The number of sensors used for the measurement can be set in the Sensor count field.
Usually it will be the same number for each layer, but it is possible to use more or less
sensors for a layer.
There are three geometry schemes: Circular, Ellipse and Irregular. These can be selected in
the Scheme field.
PD is a parameter required for all three schemes. It is the penetration depth of the nail tip
from the bark surface. It is not a very critical parameter, especially in case of large trees.
In Circular and Ellipse the software tells you where to put the sensors.
In Irregular first you place the sensors and then you tell the software where they are.
Different layers can have different schemes.
Sensors need to be placed in a counter-clockwise order when seen from above. Therefore
previous sensors need to be on the left side while next sensors on the right side.
ArborSonic 3D
User’s Manual
Software – Sensor Geometry – Circular, Elliptical and Irregular
Circular
•
•
•
•
Use this scheme if the trunk is circular.
Place sensor no. 1 anywhere and use it as a support to hold the
tape around the trunk.
Measure the circumference with the tape and type it in C.
Place the other sensors around the trunk at positions displayed:
•
Type the penetration depth of the sensor nail tip from the bark surface in the PD parameter.
Elliptical
•
•
•
Use this scheme if the trunk is elliptical.
Place sensor no. 1 at the end of the larger diameter and use it as a support to hold the tape
around the trunk.
Measure the circumference with the tape and type it in parameter C.
Measure the larger diameter with a caliper and type it in D1. Measure the smaller diameter
and type it in D2.
Place
the
other
sensors
around
the
trunk
at
positions
displayed:
•
Type the penetration depth of the sensor nail tip from the bark surface in the PD parameter.
•
•
Irregular
•
•
•
•
•
•
Use this scheme if the trunk shape is irregular.
Place the sensors around the trunk in counter-clockwise order.
Make sure that the sensors are in one plane. The tape measure can be used for this.
After placing the sensors use the caliper to measure distances between sensor pairs. For
example distance between sensor no. 1 and no. 2 needs to be entered in the field
.
The Bluetooth caliper can be used to transmit the data automatically. Just start the caliper
and measure the appropriate distances.
Type the penetration depth of the sensor nail tip from the bark surface in the PD parameter.
ArborSonic 3D
User’s Manual
Software – Time Data
•
•
•
•
•
•
•
Time data are the shock-wave traveltimes measured by ArborSonic 3D
between the sensors.
After placing the sensors and
registering the geometry, go to the
tab and buid up the
Bluetooth connection.
Make sure to select the correct Layer
on the left side, i.e. where the sensors
are actually placed. Change this
selection when sensors are moved to
the next Layer.
Tap each sensor at least 3 times.
The measured time data appear in the
table.
One line of this table contains the measured travel-times from the tapped sensor to all the
other sensors. Therefore the value belonging to the tapped sensor is always 0.
The numbers near the column labels show the number of correct taps from each sensor. If
the number if below 3, the color is red
•
•
•
•
•
which means, that additional taps are required
from that sensor. Otherwise the number is green
.
The small dots in the columns show the correctness of the time row. If the row is correct, a
green dot is shown. It is not a problem is not every row is correct, because the software
uses the correct rows only.
Please make sure to tap always on the center of the sensor head with approximately
uniform strength. If the side of the sensor is tapped or the strength is too low, the measured
time data row is incorrect. The software has a built-in filter for these data, however it is
better to remove them manually by the
button.
If there is enough time data from every sensor, the
section contains the
averaged times between the sensor pairs. Most of this data is just for monitoring.
The standard deviation of the average of the times measured between each sensor pair is
shown after the signs. The standard deviations can be displayed in microseconds or in
relative values. If the relative standard deviation between any two sensors are above 5%,
then it is advised to check the
table, go back to tapping and collect some more time
data from those two sensors.
When tapping on each sensor, the time between each sensor pair is measured in two
different ways: when one of the sensors is tapped and the other is the receiver and in the
reverse direction. The
table contains the average differences between the times
measured in both directions for all sensors. This table is a handy tool for finding bad
sensors: if the value for one sensor is unusually high, then the sensor may be broke.
ArborSonic 3D
User’s Manual
Software – Tomograms – Single-layer mode
•
•
After registering the geometry and collecting enough time data, the
are visible.
A color scheme can be selected for visualization, the recommended scheme is
. The legend and the meaning of colors are on the left side of the figure.
•
•
•
Use the
icon on the top right corner to save a view to an external JPG file.
Selecting only one Layer on from the Layer list shows the tomogram for that specific Layer
only.
By checking the
checkbox, the velocity limits which set the colors are
calculated automatically and this is the recommended setting. However, by un-checking this
checkbox allows for manual modification of the velocity limits.
•
In
mode the velocity matrix can be seen which contains the measured average
velocities between the sensors.
•
In
figure.
•
In
mode the tomogram can be seen. Moving the mouse over the area shows the
velocity below he cursor point.
•
In
mode the measured average velocities are represented as colored lines on the
mode the tomogram is represented as a 3-dimensional surface.
ArborSonic 3D
User’s Manual
Software – Tomograms – Multi-layer mode
•
•
The 3-dimensional representation of all the tomograms measured at all the layers can be seen
by selecting
on the left side.
Use the left mouse button to rotate the figure.
•
•
•
Click the
button to show the vertical interpolation plane between the layers.
By checking
the plane will always face you.
Otherwise the plane can be rotated and moved by the rotation and offset controls.
ArborSonic 3D
User’s Manual
Software – Static Analysis
•
•
•
•
•
•
•
•
•
•
•
•
The
page allows you to
evaluate the Safety Factor of the tree
using the obtained cross-sectional
tomograms and other parameters like
wind speed.
It gives an estimate for the tree safety.
Please note that only the tomograms
at the measurement Layers are used
and the software is not aware of the
parts of trunk where there is no measurement Layer.
Use the Update button after changing the parameter values in order they take effect.
During the calculations the
acting on the crown is computed based on the given
(33 m/s corresponds to 85 mph),
(which is the cross-sectional area of
2
the crown in the wind direction in m ) and based on the species dependent
.
Using the
and the
, the bending moment is calculated for every
possible wind direction at each Layer.
The obtained tomograms contain the shape and size of the hollow. With this information the
stress distribution in each Layer can be computed for every possible wind direction.
There is a weakest point of the trunk cross-section, is where the stress is maximal.
The weakest direction is the wind direction where the stress at the weakest point is
maximal.
The
of a Layer is the ratio of the stress at the weakest point in the weakest
direction and the wood
of the species. If the wood is stronger than the maximal
stress, then the Safety Factor is above 100%. A layer can be considered as safe if the Safety
Factor is above 150%.
The Overall Safety Factor of the tree is the minimum of the Safety Factors of the Layers.
The figure shows the solid parts of the trunk cross-section in blue. This is obtained from
thresholding the tomograms. Changing the
value changes the threshold and
thereby the size of hollow. Therefore it can be used for manual correction.
The red shape shows the maximal stress values. Wherever it is far from the center, the
stress is high and therefore the trunk is relatively week in that direction. The thin red radius
shows the weakest direction of the trunk.
ArborSonic 3D
User’s Manual
Software – Generating reports
•
The built-in report generator makes creating reports
for customers quick and easy.
•
After the measurement use the
button to
generate a report.
The generated report will be an external .rtf file
which contains the data of the measurement and
which can be opened with a text editor for further
editing. The format of the generated file is RTF.
Use the checkbox tree on the left side to select the
data which should be included in the report.
Header contains the title of the document and the time of creation.
Species Selection contains the selected species.
Sensor Geometry contains the parameters of the geometry. Individual layers can be selected
or de-selected.
Time data contains the measured time data.
External images can be included in the Tomograms section. To include an image, first go to
•
•
•
•
•
•
•
the Tomograms page and save the view to an external JPG file using the
right corner. After saving the file, use the
the generated document.
•
If everything is fine, click the
icon in the top
button to load and include it in
button to save the report to an external document.