1
MetaFluor Analyst™
User’s Guide
For Use with
MetaFluor®
Version 7.0 for
®
Microsoft Windows XP
1030 2203-02
Copyrights, Notices, and Trademarks
© 2004 – 2006 Molecular Devices Corporation. All rights reserved. Printed in the
U.S.A.
Information in this document is subject to change without notice and does not
represent a commitment on the part of Molecular Devices Corporation. The
software described in this document, including information contained in any
databases, is furnished under a license agreement and may be used or copied
only in accordance with the terms of the agreement. It is illegal to copy the
software, except as specifically allowed in the license agreement. No part of this
manual may be reproduced or transmitted in any form or by any means,
electronic or mechanical, including photocopying and recording, for any purpose,
without the express written permission of Molecular Devices Corporation.
MetaMorph and ImageXpress are registered trademarks and Discovery-1,
MetaXpress, MDCStore and ImageXpress Micro are trademarks of Molecular
Devices Corporation.
All other trademarks are the property of their respective owners.
Disclaimer
Molecular Devices Corporation reserves the right to change its products and
services at any time to incorporate technological developments. This user guide
is subject to change without notice.
Although this user guide has been prepared with every precaution to ensure
accuracy, Molecular Devices Corporation assumes no liability for any errors or
omissions, nor for any damages resulting from the application or use of this
information.
Table of Contents
MetaFluor Analyst Overview......................................................................................................... 1-1
Using this Guide ....................................................................................................................... 1-1
Hardware Requirements .......................................................................................................... 1-1
Image Window .............................................................................................................................. 2-1
Image Window Features .......................................................................................................... 2-1
Intensity Scalebar ................................................................................................................ 2-1
Play/Pause Button ............................................................................................................... 2-1
Trackbar ............................................................................................................................... 2-2
Image ................................................................................................................................... 2-2
Working with the Image Window.............................................................................................. 2-2
Opening an Image ............................................................................................................... 2-2
Visualization......................................................................................................................... 2-3
Image processing................................................................................................................. 2-4
ROI drawing ......................................................................................................................... 2-4
Data Evaluation.................................................................................................................... 2-4
Setting the linkage of Image Windows................................................................................. 2-4
Menu Commands and Toolbar ..................................................................................................... 3-1
Menu Commands ..................................................................................................................... 3-1
File menu ............................................................................................................................. 3-1
Open experiment ................................................................................................................. 3-1
Save ..................................................................................................................................... 3-1
Close current image window................................................................................................ 3-1
Close all ............................................................................................................................... 3-1
Export current image (series) .............................................................................................. 3-1
Load ROIs............................................................................................................................ 3-1
Save ROIs............................................................................................................................ 3-1
Save Plot Data ..................................................................................................................... 3-1
Exit ....................................................................................................................................... 3-2
Edit Menu ................................................................................................................................. 3-2
Copy image.......................................................................................................................... 3-2
Set linkage ........................................................................................................................... 3-2
Truncate frames................................................................................................................... 3-2
Merge image series ............................................................................................................. 3-2
Set Image Scaling................................................................................................................ 3-2
Calculate Menu ........................................................................................................................ 3-2
DF/F ..................................................................................................................................... 3-2
Ratio..................................................................................................................................... 3-3
Calibrate............................................................................................................................... 3-3
Convert to ............................................................................................................................ 3-3
Linescan............................................................................................................................... 3-3
Plot ....................................................................................................................................... 3-3
Advanced Plot...................................................................................................................... 3-3
Correlation ........................................................................................................................... 3-3
Filter Menu ............................................................................................................................... 3-3
Running median................................................................................................................... 3-3
Running average.................................................................................................................. 3-3
Bleach correction ................................................................................................................. 3-3
Temporal derivation ............................................................................................................. 3-3
Subtract background............................................................................................................ 3-4
Absolute value ..................................................................................................................... 3-4
Custom Affin Transformation ............................................................................................... 3-4
Manual UnMove................................................................................................................... 3-4
2D Fourier ............................................................................................................................ 3-4
MetaFluor Analyst
v
Version 1.0.93
Table of Contents
2D Median............................................................................................................................ 3-4
2D Fixed Kernel Convolution ............................................................................................... 3-4
2D Custom Kernel Convolution ........................................................................................... 3-4
Visualize Menu ......................................................................................................................... 3-4
Attach IMD Intensity............................................................................................................. 3-4
Attach overlay image ........................................................................................................... 3-4
Overlay Text......................................................................................................................... 3-4
Options Menu....................................................................................................................... 3-4
Colors................................................................................................................................... 3-4
Preferences.......................................................................................................................... 3-5
Window Menu........................................................................................................................... 3-5
Cascade ............................................................................................................................... 3-5
Tile ....................................................................................................................................... 3-5
Minimize All .......................................................................................................................... 3-5
Restore All ........................................................................................................................... 3-5
Show Image Info .................................................................................................................. 3-5
Show ROI Info...................................................................................................................... 3-5
Help Menu............................................................................................................................ 3-5
About.................................................................................................................................... 3-5
Toolbar ..................................................................................................................................... 3-5
Graph Window .............................................................................................................................. 4-1
Correlation Graph..................................................................................................................... 4-2
Linescan Window ..................................................................................................................... 4-3
Preferences dialog box................................................................................................................. 5-1
Visualization Tab ...................................................................................................................... 5-1
Real image data fixedpoint factor ........................................................................................ 5-1
Default Scaling..................................................................................................................... 5-1
Data Saving Tab....................................................................................................................... 5-2
Resample ............................................................................................................................. 5-2
ROI calculation..................................................................................................................... 5-2
Use mask ............................................................................................................................. 5-2
Convolution kernel Tab ............................................................................................................ 5-3
Select kernel ........................................................................................................................ 5-3
Size, Dimensions ................................................................................................................. 5-3
Normalize ............................................................................................................................. 5-3
Misc Tab................................................................................................................................... 5-4
Manual Unmove................................................................................................................... 5-4
Playback............................................................................................................................... 5-4
Advanced Image Processing........................................................................................................ 6-1
Background Subtraction........................................................................................................... 6-1
Subtract background at........................................................................................................ 6-1
Background Image............................................................................................................... 6-1
Bleach Correction..................................................................................................................... 6-2
Make regression between.................................................................................................... 6-2
Independent variable ........................................................................................................... 6-2
Dependent variable.............................................................................................................. 6-2
Regression type ................................................................................................................... 6-2
Regression method, number of iterations, precision ........................................................... 6-3
Action ................................................................................................................................... 6-3
Show Fit ............................................................................................................................... 6-3
OK ........................................................................................................................................ 6-3
Calibration ................................................................................................................................ 6-3
Manual Unmove ....................................................................................................................... 6-4
Filtering in Time........................................................................................................................ 6-5
Filtering in Image Plane ........................................................................................................... 6-6
Filtering in Fourier domain ....................................................................................................... 6-6
MetaFluor Analyst
vi
Version 1.0.93
Table of Contents
Filter Function Design .............................................................................................................. 6-7
DFT Preferences.................................................................................................................. 6-8
Preserve Edges ................................................................................................................... 6-8
Real DFT output................................................................................................................... 6-8
Enlarge image paper to 2^... using mirrored tiling ............................................................... 6-8
Calculate absolute value after DFT ..................................................................................... 6-8
Leave only phase................................................................................................................. 6-8
Run....................................................................................................................................... 6-8
Optimization of Filter Function for Image Detail Extraction...................................................... 6-9
Signal/Background ROI ..................................................................................................... 6-10
Optimize ............................................................................................................................. 6-10
Compute............................................................................................................................. 6-10
Method (Frequency scan) .................................................................................................. 6-10
Result ................................................................................................................................. 6-10
Optimize ............................................................................................................................. 6-11
MetaFluor Analyst
vii
Version 1.0.93
Chapter 1
MetaFluor Analyst Overview
MetaFluor Analyst was designed for high throughput, routine work with ratiometric and non-ratiometric
fluorescent dyes. It enables fast loading of image sequences, convenient region of interest (ROI)
drawing, and fast plot extraction. Other features of MetaFluor Analyst include:
•
Background subtraction
•
Ratio and DF/F calculation with calibration
•
Bleach correction
•
Temporal smoothing
•
Image plane filters including Fourier domain filtering, which enables selective measurement of
mitochondrial derived fluorescence.
The main window of MetaFluor Analyst contains the workplace, the menu, and the toolbar. On the
workplace unlimited number of Image Windows and graphs can be present simultaneously. The software
is controlled by the user through the menu system: using the main menu and toolbar of the main window,
while certain functions can be accessed by right-clicking active windows.
Experiments, or image sequences, created in MetaFluor are opened in image windows. Image windows
contain each frame of an image sequence in sequential order. Each Image Window displays one
wavelength of a measurement. If an experiment file (*.inf) contains more than one wavelength, each
wavelink sequence is opened in a separate image window. These image windows are automatically
linked together — linked image windows share ROIs and can be processed together (for example —
parallel filtering, truncating, ratio calculation, overlaying, IMD coloring).
Using this Guide
The following sections provide information and instructions on using MetaFluor Analyst:
Section 1
Introduction provides an overview of the functionality of MetaFluor
Analyst, as well as hardware requirements.
Section 2
Image Window provides an overview of Image Window features.
Section 3
Menu Commands and Toolbar contains descriptions of the Menu and
toolbar commands available in MetaFluor Analyst.
Section 4
Graph Window explains how to use the graphing and charting features of
MetaFluor Analyst.
Section 5
Preferences explains how to use set default preferences to use in
MetaFluor Analyst.
Section 6
Advanced Image Processing details advanced filtering and processing
techniques available in MetaFluor Analyst.
Hardware Requirements
Operation
system
Microsoft Windows 9X, NT, 2000 (NT or 2000 recommended)
Hardware
•
Hard drive space 10 MB (for executable with all dlls)
•
CPU Pentium class
•
Memory—256MB recommended
True color (24 or 32 bit; high resolution recommended)
Video
MetaFluor Analyst
1-1
Version 1.0.93
Chapter 2
Image Window
Experiments, or image sequences, created in MetaFluor are opened in image windows. Image windows
contain each frame of an image sequence in sequential order. Each Image Window displays one
wavelength of a measurement. If an experiment file (*.inf) contains more than one wavelength, each
wavelink sequence is opened in a separate image window. These image windows are automatically
linked together — linked image windows share ROIs and can be processed together (for example —
parallel filtering, truncating, ratio calculation, overlaying, IMD coloring).
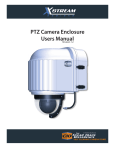
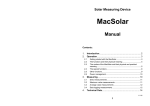
A sample Image Window is shown below:
Image Window Features
Intensity Scalebar
Displays the intensity levels of the selected frame. Right-click within the Intensity Scalebar to choose
from the following options:
•Copy ScaleBar to Clipboard – copies a bitmap of the Intensity Scalebar to the clipboard.
•Grayscale – displays the image in grayscale.
•Pseudocolor – displays the image with an arbitrarily assigned color display.
•IMD color – displays the image in Intensity Modulated Display (IMD) mode. IMD color is only
available with IMD images.
Play/Pause Button
Press to start playback of image sequence. Press again to pause. Playback is looped back at the end.
MetaFluor Analyst
2-1
Version 1.0.93
Image Window
Set the playback frame rate in the Misc tab of the Preferences dialog box .
Trackbar
To move between frames, drag the slider on the trackbar, use the scroll button on your mouse, or press
the arrows keys on your keyboard.
Image
Right-click within an image to choose from the following options:
•Zoom – Select from the following magnification levels: 1x, 2x, 3x, or 4x
•Gradient – Select from the following image colors: grayscale, red, blue, green, or IMD coloring.
IMD color is only available with IMD images.
•Set Scaling – Opens Set Scale dialog box.
•Attach IMD Intensity – Opens the Attach IMD Intensity dialog box.
•Attach overlay image – Opens the Attach overlay image dialog box.
•Overlay Text – Opens the Overlay Text dialog box.
•Copy image – Copies bitmap of image to the clipboard.
•Copy image with all ROIs – Copies bitmap of image to the clipboard with ROIs included.
•Show image info – Shows image information of the active image. The image information can be
edited, copied, and pasted into *.ia files.
•Erase ROI – Deletes active ROIs.
•Erase all ROIs – Deletes all ROIs.
Working with the Image Window
Opening an Image
Image windows contain each frame of an image sequence in seqencial order. Each Image Window
displays one wavelength of a measurement. If an experiment file (*.inf) contains more than one
wavelength, each wavelink sequence is opened in a seperate image window. These image windows are
automatically linked together — linked image windows share ROIs and can be processed together (for
example —parallel filtering, truncating, ratio calculation, overlaying, IMD coloring). There can be multiple
sets of linked Image Windows in the workplace.
The timing of the measurement is loaded from the *.inf file. If this file contains zero clock, then only the
images after the last zero clock are loaded. If only one wavelength is loaded, the recording time saved in
the image is taken as the timing of the measurement, with the first frame as t=0s. A timing of 1 frame per
second is assumed during bitmap import.
New Image Windows can be created by duplicating an active one using the Duplicate Image Window
command in the Edit menu. If the duplicate is linked to the original, it will inherit any existing ROIs. This
command is useful to create a backup of an experiment before doing any image processing.
The contents of an Image Window (with ROIs and image information) can be saved into and loaded from
the MetaFluor Analyst format (*.ia). This format does not support multiple wavelength — each
wavelength must be saved separately.
The pixel values of an image sequence are stored as 16-bit signed integer values (range: -32768 –
32767). Image Windows can be switched into fixed point real mode using the Convert to command in the
Calculate menu. This command stores images as 16 bit signed integer values, but they display as real
values in a range of –32768/factor – 32767/factor, with 1/factor precision. The image is automatically
switched to real mode during certain calculations, like DF/F, ratio. For best results, the factor of fixed
point real image storage has to be optimally set in the Preferences dialog box according to the dynamic
range of calculations. All functions work on both integer and real values.
MetaFluor Analyst
2-2
Version 1.0.93
Image Window
Visualization
The Image Window shows the first frame of the image sequence by default. The intensity of the image is
shown by the intensity scalebar at the left side of the image. The pixel intensities between a minimum
and maximum value are translated to the colors of the scalebar linearly if the image is displayed in color.
These values are indicated above and below the scalebar, and can be changed using the Set Scaling
command in the edit menu.
Set Scaling Command
Automatic scale at percentile: calculates the minimum and maximum values of intensity scalebar from
the histogram of image series taking intensities at the given percentiles.
Scale each frame independently: the histogram and percentiles are calculated for each frame, instead
of the whole image series.
Fixed value: Scales intensity between the entered minimum and maximum values.
Intensity scaling and coloring also have default values for the following conditions: loaded image (normal
image), ratio, and DF/F image. These default values can be set in the Preferences dialog box. For
example, setting the default intensity scaling and coloring of radiometric Image Windows to certain fixed
values can assure that different image sequences will appear in comparable coloring in routine work.
The content of a linked Image Window can be overlaid onto the active window one using the Attach
Overlay Image command in the Visualize menu. The overlay frame from the linked image is always the
same corresponding frame as the active window.
During overlaying, the image shows its original gradient and intensity values, so it does not affect stored
pixel values or ROI averages.
The Intensity Modified Display (IMD) technique helps discrimination of objects in the image after ratio or
DF/F calculation. If IMD coloring is enabled, the hue of the pixel is determined from the scaled pixel
intensity value of the given Image Window and the brightness is determined by the attached IMD
intensity image. The result of a ratio calculation automatically appears IMD colored, with the intensity
(brightness) values derived from the average of the numerator and the denominator. IMD coloring can
also be set up by manually attaching an IMD intensity image using the Attach IMD Intensity command in
the Visualize menu. Use the following steps to produce an IMD colored DF/F image:
1Duplicate an image using the Duplicate command in the Edit menu.
2Use the DF/F command in the Calculate menu on the duplicated image.
3Attach the original image as an IMD intensity using the Attach IMD Intensity command in the
Visualize menu.
IMD coloring can be switched off by setting the Gradient in the popup menu of the Image Window to any
other value. IMD coloring does not affect stored pixel values or ROI averages.
MetaFluor Analyst
2-3
Version 1.0.93
Image Window
Overlay Text Command
Use the Overlay Text command in the Visualize menu to print the frame number and frame time on the
image. The numbers are formatted using the Type and Justification combo boxes and the Font button.
The position of the numbers can be set in X (%) and Y (%) fields. If the Image Window is resized, then
the absolute positions of the overlaid text do not change.
Image processing
Image processing functions are accessed through menu commands and the Toolbar. If an image
processing command involves more than one wavelength of an experiment (i.e. Multiple Image
Windows), then the Image Window to process can be chosen from the list of Image Windows linked to
the active window. The results of the command will overwrite the original image sequences, except for
ratio calculation, where the result appears in a new window. If the original image is needed later, then
duplicate it before processing using the Duplicate command in the Edit menu.
ROI drawing
Use the ROI Region of Interest toolbar commands to edit regions of interest on the active image. Select
linear or area ROI editing from the toolbar then click and drag on the image to create a ROI. Double-click
to set the ROI. The ROIs are visible and can be edited in any linked Image Windows. To move a ROI,
select the ROI arrow button on the toolbar, then click and drag the ROI. You can also use the ROI tools
to copy, paste, or delete the active ROI. Selecting or deleting a ROI also selects or deletes the
corresponding plot if a Graph Window is present; deleting the plot deletes also the corresponding ROI.
Data Evaluation
Use the Plot command in the Calculate menu to calculate a graph from the average of ROIs on a
selected image. Other data evaluation commands included Correlation plot, Advanced plot/ pixelwise
deviation, and Linescan Window. These commands are performed on the active ROI and running any of
these commands will automatically refreshed any Image Window content including ROI settings. The
color of each ROI is represented by the same color on a graph.
Setting the linkage of Image Windows
Opening a multi-wavelength MetaFluor experiment in MetaFluor Analyst opens a set of linked Image
Windows that are processed simultaneously. You can also manually link Image Windows to enable
them to be processed simultaneously using the Set Linkage command in the Edit menu. You can link
separately loaded or imported Image Windows, if they have the same size and numbers of frames.
Image Windows can be duplicated with or without their links using the Duplicate command in the Edit
menu. There can be multiple sets of linked Image Windows on the Workplace.
MetaFluor Analyst
2-4
Version 1.0.93
Image Window
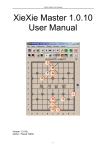
Set image window linkage Dialog Box
The linkage of an Image Window can be changed using the Set Linkage command in the Edit menu. The
Set Image Windows linkage dialog box shows all the Image Windows already linked (selected) or
matching the size criteria to be linked (unselected). Other sets of linked Image Windows that can also be
linked together are listed in one row.
MetaFluor Analyst
2-5
Version 1.0.93
Chapter 3
Menu Commands and Toolbar
Use the MetaFluor Analyst menu commands and toolbar to open, manipulate, and analysis experiment
files created in MetaFluor.
Menu Commands
The following menu commands are used available in MetaFluor Analyst:
File menu
Open experiment
Opens a previously saved Experiment file (.inf) into an image window on the desktop for viewing,
processing, or analysis.
If the image sequence descriptor (.inf) file contains zero clock, then only the images after the last zero
clock are loaded. (The timing of the measurement has to be continously incrementing, without zeroing.)
The images in an image sequence must have the same format (size and depth).
Save
Saves a modified .inf file to the .ia Image Analyst format.
Close current image window
Closes the selected window. Dependent windows such as graphs are also closed with this command.
Close all
Closes all open windows.
Export current image (series)
Choose to exports pixel values of the current selected frame or whole image series to the follwing
formats:
.TXT file of current frame (1D array)
.TXT file of current Region of Interest (ROI) (1D array)
Movie (series of *001.bmp files for each frame)
Movie (series of *001.bmp files for each frame)
Load ROIs
Opens the Load ROIs dialog box. Use to load previously saved Regions of Interest from disk. The *.roi
binary format contains corner coordinates of all ROI polygons.
Save ROIs
Opens the Save ROIs dialog box. Use to save Regions of Interest to disk. The *.roi binary format
contains corner coordinates of all ROI polygons.
Save Plot Data
Runs the Plot command and saves the plots from the resulting Graph window to ASCII file in tab
deliminted format chart. The first column contains the timing in seconds.
MetaFluor Analyst
3-1
Version 1.0.93
Menu Commands and Toolbar
Exit
Closes all open images on the desktop and quits MetaFluor Analyst.
Edit Menu
Copy image
Copies current frame of active Image Window to clipboard in the following formats:
As image
As image with active ROIs
As image with all ROIs
As 3D graph — ASCII, tab delimited
Copy plot data
Copies plots from the active Graph Window to the clipboard in ASCII, tab delimited format.
Copy all ROIs
Copies ROI polygons to clipboard in the *.roi binary format. The following choices are available:
4Copy active ROI
5Copy all ROIs
Paste ROIs
Pastes ROIs from the clipboard to the active Image Window and all linked windows, if applicable.
Delete ROIs
Deletes active ROIs.
Set linkage
Opens the Set Image Windows linkage dialog box. Shows linked Image Widows and enables you to
manually link Image Windows so they can be to be processed simultaneously.
Duplicate image windows
Duplicates Image Window. The new Image Window can be linked or unlinked to the original.
Truncate frames
Opens the Truncate Frames dialog box for cutting or truncating frames.
Merge image series
N/A
Set Image Scaling
The intensity of the image is shown by the intensity scalebar at the left side of the image. The pixel
intensities between a minimum and maximum value are translated to the colors of the scalebar linearly if
the image is displayed in color. These values are indicated above and below the scalebar, and can be
changed using the Set Scaling command.
Calculate Menu
DF/F
Calculates DF/F normalization for each pixel (normalized to the change from the first frame). The result
is stored as real values. The Image Window intensity scaling and coloring changes to the DF/F preset
MetaFluor Analyst
3-2
Version 1.0.93
Menu Commands and Toolbar
(see Properties dialog box).
Ratio
Runs dialog box for entering numerator and denominator for ratio calculation from the linked Image
Windows to the active one. The result is stored as real values.
Calibrate
Enables you to run calibration equations on selected ROIs.
Convert to
Sets the pixel format:
•Integer (default): signed, 16 bit (-32768 - 32767)
•fixed point real, 16 bit, the place of the decimal is determined by a factor given in the
Preferences dialog box.
Linescan
Linescan Windows contains a time-space (or linescan) diagram. This diagram consists of pixel values
along a linear ROI projected onto the y-axis in every time point (x-axis).
Linescan Window can be created from an Image Window, which contains an image sequence and
defined ROI(s), by using the Linescan command in the calculate menu. The X-axis of the diagram is the
timing of the measurement in seconds; the Y-axis is the projected pixel intensities along the actual linear
ROI.
Plot
Graphs can be created from Image Windows that have defined ROIs using the Plot command in the
Calculate menu. The X-axis of the graph represents the timing of the measurement in seconds; the
Y-axis represents the average values of pixel intensities covered by the ROI.
Advanced Plot
Pixelwise deviation : Similar to Plot, but plots not the average of pixel intensities over a ROI, but the
standard deviation of pixel intesities. Can be used for determination of punctuate pattern versus smooth
(however working with highpass Fourier filters gives usually better results).
Correlation
The correlation window compares the pixel values of the two wavelength channels by assigning a point
in the graph at the intensity value B and intensity value A coordinate for each pixel of a given ROI.
Filter Menu
Note: See Section 6, Advanced Image Processing, for more information about the Filter menu
commands.
Running median
Filters the image sequence by running a median filter in time over each pixel sequence.
Running average
Filters the image sequence by running a average filter in time over each pixel sequence. Places the
average in the middle of the given window. Deletes window/2 frames from the beginning and end.
Bleach correction
Fixes photobleaching or leakage of fluorescent dye. It does this by manipulating the data by the
extrapolation of a fitted exponential function on a part (baseline) of the trace.
Temporal derivation
Calculates temporal derivative by convolution of image in time with the given column vector kernel. Can
MetaFluor Analyst
3-3
Version 1.0.93
Menu Commands and Toolbar
be used for any kind of convolution process in time (temporal filtering). The result is multiplied by the
given time factor.
Subtract background
Removes image backgroud data based on a number of variables.
Absolute value
Takes the absolute value of pixels.
Custom Affin Transformation
Manual UnMove
Manually correct image movements that occured during measurements.
2D Fourier
Configure a filter that acts as a user defined optical transfer function
•
Setup DFT filter: See DFT filter designing in chapter
•
Run DFT filter: Runs the previously configured DFT filter on the active Image Window
2D Median
Used for noise reductionand extracting or suppressing certain image details.
2D Fixed Kernel Convolution
Makes kernel convolution filtering in image plane, frame by frame with some predefined low- and highpass filter kernels.
2D Custom Kernel Convolution
Makes kernel convolution filtering in image plane, frame by frame with user-defined kernel.
Visualize Menu
Attach IMD Intensity
Sets the color-coding of actual Image Window to intensity modulated pseudocolor coding (IMD) by
asking for a linked Image Window for intensity values. The pseudocoloring (hue) shows the pixels values
of the active image; the brightness shows the pixel values of attached image. IMD coloring can be
switched off by setting the gradient in the popup menu of the Image Window to any other value. Does
not affect stored pixel values or ROI averages.
Attach overlay image
Overlays the actual Image Window content with a chosen, linked Image Window content (always frameby-frame). The overlaid image shows in its original gradient and intensity values. Change the original
image settings to affect overlaid image. Does not affect stored pixel values or ROI averages.
Overlay Text
Enables you to print the frame number and frame time on the image. The numbers are formatted using
the Type and Justification combo boxes and the Font button. The position of the numbers can be set in
X (%) and Y (%) fields. If the Image Window is resized, then the absolute positions of the overlaid text do
not change.
Options Menu
Colors
Stores the ROI coloring. 16 colors are cycled during ROI drawing, set the custom colors to modify ROI
coloring. The color of an existing ROI cannot be changed, only the newly created ones are affected.
MetaFluor Analyst
3-4
Version 1.0.93
Menu Commands and Toolbar
Preferences
Opens the Preferences dialog box.
Window Menu
Cascade
Displays image windows stacked and cascading from the top left to the bottom right of the screen.
Tile
Displays image windows edge to edge.
Minimize All
Minimizes all open image windows to the bottom of the workspace.
Restore All
Restores all minimized images.
Show Image Info
Shows image information of the active image. The image information can be edited, copied, and pasted
into *.ia files.
Show ROI Info
Shows the parameters of the active ROI.
Help Menu
About
Opens splash screen with version and copyright information about MetaFluor Analyst.
Toolbar
Tools available on the MetaFluor Analyst toolbar represent the most commonly used menu commands.
See the menu command description for more information about a specific tool. The following tools are
available:
Tool
Menu
Command
File
Open Experiment
Edit
Set linkage
Edit
Duplicate image window
Edit
Truncate frames
N/A
ROI selection and movement
N/A
Drawing of linear ROI
N/A
Drawing of area ROI
MetaFluor Analyst
3-5
Version 1.0.93
Menu Commands and Toolbar
Tool
Menu
Command
Edit
Copy active ROI
Edit
Paste ROI
Edit
Delete active ROI
Calculate
Plot
Calculate
Correlate
Calculate
Linescan
Filter
Subtract background
NA
Subtract background with the active ROI set for subtraction frameby-frame
File
Save plot data
Edit
Copy plot data
MetaFluor Analyst
3-6
Version 1.0.93
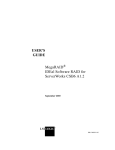
Chapter 4
Graph Window
Graphs can be created from Image Windows that have defined ROIs using the Plot command in the
Calculate menu. The X-axis of the graph represents the timing of the measurement in seconds; the
Y-axis represents the average values of pixel intensities covered by the ROI. An (F) sign at the end of
y-axis indicates that if the plot was created from a normal intensity-type (non radiometric) Image
Window. A (R) sign indicates it was created from a radiometric Image Window. A sample Graph Window
with created from a normal intensity-type (non radiometric) Image Window is shown below:
Right-click within Graph Window to choose from the following options:
•
Show as DF/F of intensity view – calculates DF/F normalization trace-by trace. If the signal-tonoise ratio of the image sequence is poor, DF/F normalization of plots rather than pixels is
favourable. This is an in plot calculation and does not affect image data. A (DF/F) sign at the
end of the y-axis indicates that this mode is active.
•
Resample when saving or copying data – resamples the data along the x-axis during clipboard
or file output.
•
Plot Cross Section – Creates a new Graph Window with ROIs (by their numbering) on the Xaxis, and plot values in the current pointer position on the original plot corresponding to each
ROI.
•
Copy Plot Data – Copies plot data to clipboard in tab delimited, ASCII format for use in
spreadsheet editors.
•
Save Plot Data – Saves plot data to clipboard in tab delimited, ASCII format for use in
spreadsheet editors.
•
Erase Active Plot And ROI – Deletes plot below the pointer and deletes the corresponding ROI.
Plots are identically colored with the corresponding ROIs. Deletion of a ROI deletes the corresponding
plot, and deletion of a plot deletes the corresponding ROI. A Graph Window remains linked with the
Image Window used to create it, so any change of ROIs or pixel values refreshes the plot. If the plot
does not refresh after an image processing command, click the ROI with the ROI arrow. To force a
refresh. If this does not work, close the graph and create a new one.
MetaFluor Analyst
4-1
Version 1.0.93
Graph Window
The axes of the graph are scaled automatically between the extremities of the plot data. The appearance
of the graph cannot be changed, except for sizing the Graph Window.
The Graph Window was designed only for a short look at the data, and helping in the selection of correct
ROIs (e.g.: manual selection for healthy cells). The plots has to copied into a spreadsheet program or
plotting software for further processing. This is done by right-clicking a graph and selecting Copy plot
data, then pasting into a spreadsheet program. Saving into ASCII files is also supported Right-click/Save
plot data). The output format is tab delimited ASCII, the first column contains the time values in seconds,
and the remaining columns are the plot y-values in the order of ROI numbering. There is no header row.
Plots also can be copied as bitmaps.
The timing of a measurement is often affected by the limited speed of camera or data storage system, so
however the exact time of the exposition is recorded, the interval between image acquisition can change.
This makes it difficult to average multiple measurements in a spreadsheet editor in a row-by-row base.
For this reason, data resampling was implemented in the Image Analyst. This can be enabled by rightclicking the graph and selecting Resample when Saving or Copying. If enabled, the plotted data is
resampled in time, using linear interpolation between the recorded points, yielding time points divisible
by the given value in seconds at Preferences dialog box / Data Saving / Resample / X Data resaple
interval. In the Preferences dialog box the default value of the Resample When Saving or Copying Data Popup menu point can be also set. This option affects only the copied or saved data, not the one
appearing in the plots, nor the image data.
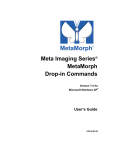
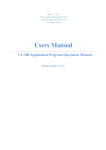
Correlation Graph
The correlation window compares the pixel values of the two wavelength channels by assigning a point
in the graph at the intensity value B and intensity value A coordinate for each pixel of a given ROI. A
sample correlation window is shown below:
Correlation Graphs can be created (using the Correlate command in the Calculate menu) from a set of
linked Image Windows, where ROIs are present. The Correlation Graph is a kind of Graph Window, so
its usage and popup menu system is similar. For statistical analysis the data has to be copied into the
appropriate statistical software.
Note: Correlation Graphs are useful for the investigation of colocalization of two different
fluorescent dyes in the same subcellular structures. If the two dyes are colocalizing, then the
same pixels are bright for both dyes. Conversely, the same pixels are dark for each dye. This
means there is some correlation between the pixel intensity values, which appear in the graph as
a line originating from the origin. If there is no correlation the points are scattered in the graph.
MetaFluor Analyst
4-2
Version 1.0.93
Graph Window
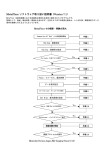
Linescan Window
Linescan Windows contains a time-space (or linescan) diagram. This diagram consists of pixel values
along a linear ROI projected onto the y-axis in every time point (x-axis).
Linescan Windows can be created from an Image Window, which contains an image sequence and
defined ROI(s), by using the Linescan command in the calculate menu. The X-axis of the diagram is the
timing of the measurement in seconds; the Y-axis is the projected pixel intensities along the actual linear
ROI. A sample Linesscan window is shown below:
The content of a Linescan Window can be resampled by right-clicking in a Linescan window and
selecting Resample, however in this case the appearing diagram is affected by the resampling. Rightclick in a Linescan window to view additional options.
Note: The Linescan command is useful for visualization of wave-like propagation of signals
(together with temporal derivation). On time-space diagrams, the stabile structures are drawn
straight, while the dislocating are drawn curved or sloped paths. The characteristics or speed of
movement can be determined in this way. However, further work or other software is needed to
determine slopes. The Edit / Copy Image / as 3D graph – menu command can be used for
exporting data through the clipboard to other software.
MetaFluor Analyst
4-3
Version 1.0.93
Chapter 5
Preferences dialog box
This section contains information about the Prefences dialog box. To open the Prefences dialog box,
Select Prefences from the Options menu.
Visualization Tab
Real image data fixedpoint factor
Factor for determination of the place of the decimal at fixed point real storage on 16-bits.
Default Scaling
Set the default values of Image Window intensity scaling in some common conditions: Normal image,
Ratio image, DF/F image, and Concentration. Use the following procedure to set default scaling:
1
Select the type of Image Window by left clicking on the list on the left.
2
Set scaling properties.
3
Set the coloring for the selected Image Window type.
MetaFluor Analyst
5-1
Version 1.0.93
Preferences Dialog Box
Data Saving Tab
Resample
•
Save / Copy plot data resampled: Select for resampleing plot data by default during saving or
copying to clipboard. (See in details at Graph Windows section.)
•
X Data resample interval (sec): Gives the base of resampling — each new data point will be
in a time point divisible with this value.
ROI calculation
Treat zeros as mask: If selected than the software neglects (assumes masked) pixels with zero value
during ROI average calculation. Use for calibrated images(to exclude out of calibration pixels).
Use mask
If selected, the pixels with the given value are masked at visualization, appearing in black. (Use with
pseudocoloring).
MetaFluor Analyst
5-2
Version 1.0.93
Preferences Dialog Box
Convolution kernel Tab
Select kernel
Kernels are stored based on their names. To browse kernels use the Select kernel field. The selected
kernel appears in the edit region of the dialog box. Kernels are stored in a binary file (*.ckr) listed in the
Kernel file field. The changes are automatically written in the kernel file upon clicking OK button. To open
another kernel file, or save in a new name, use the icons below the Kernel file field.
Kernel icons below the Select kernel field:
•
New kernel: First enter a new name into the Select kernel field, then click New Kernel button. A
new 3x3 nullmatrix kernel is created.
•
Copy kernel: First enter a new name into the Select kernel field, then click Copy Kernel button.
The active kernel is copied, and appearing in the new name in the list.
•
Delete kernel: Click Delete Kernel button to delete selected kernel.
Size, Dimensions
MetaFluor Analyst uses quadrate (XY), column (Y), and row (X) matrices as kernels with the size given
at the Size field.
Normalize
Divides the values of the kernel with the sum of absolute values in the kernel.
MetaFluor Analyst
5-3
Version 1.0.93
Preferences Dialog Box
Misc Tab
Manual Unmove
For setting the step sizes during manual unmovement:
•
Move step: X and Y direction step size in pixels, for fine movements it has to be smaller than 1.
•
Rotate step: Rotation step size in degrees, should be smaller than 1 for fine movements.
Playback
Set the playback rate of frames in the Image Window (in frames per second).
MetaFluor Analyst
5-4
Version 1.0.93
Chapter 6
Advanced Image Processing
This section contains advanced image processing tecniques available in MetaFluor Analyst.
Background Subtraction
Select Subtarct Background from the Filter menu to open the Background Subtraction dialog box, as
shown below:
Subtract background at
Options for type of background to subtract:
•
percentile – the background is calculated for each frame, from the histogram of the frame: the
intensity at the given percentile. (For subtract percentile calculated from the histogram of the
whole image sequence, set a minimum value at Scale Intensity dialog box of Image Window,
and subtract the value appearing below the scalebar as value.)
•
value – user defined value to subtract. Use negative number here to add background.
•
ROI average by frames – Subtracts the average of pixel intensities covered by the given ROI,
calculated frame-by-frame.
•
ROI average by measurement - Subtracts the average of pixel intensities covered by the given
ROI, calculated for the whole image sequence.
•
Image – Subtracts the image(s) entered in the Background Image field.
Background Image
Active if the Image option is set in the Subtract Background at field. Enter the background file name
here, or click the browse button to locate the file. Only images with same size can be subtracted. If a
MetaFluor measurement (*d.inf) file is given (with more than one channels), then images with the
matching wavelength will be subtracted. If individual image or image series is entered, then it will be
subtracted from any selected Image Window. Since background measurements can contain image
sequences, the number of frame to subtract can be specified (in th frame filed), or all loaded frames can
be averaged for subtraction (Average all frames). In all other aspects, loading of measurements applies
for background loading. When using MetaFluor measurements for background subtraction, all other
Image Windows for background subtraction has to be selected in the list at the bottom of the dialog box.
MetaFluor Analyst
6-1
Version 1.0.93
Advanced Image Processing
Note: For elimination of uneven background illumination and CCD cold/hot spots, it is ideal to
record and subtract a background image of a cell-free area. If there is temporal irregularity in
background intensities, like external scattered light entering the microscope, or photobleching of
background dye fluorescence, subtraction of ROI average calculated frame-by-frame can correct
for these potential artifacts. If the image contains a relatively large amount of background (cell
free areas), then subtraction at given percentile can be also used as background subtraction
Bleach Correction
The Bleach Correction command fixes photobleaching or leakage of fluorescent dye. It does this by
manipulating the data by the extrapolation of a fitted exponential function on a part (baseline) of the
trace. Manipulation means that the first frame remains unchanged, and in the following frames: either the
fitted function is subtracted, or the frames are factorized by the relative change from the first fitted value.
In this way the drop in the trace due to photobleaching can be eliminated.
Select Bleach Correction from the Filter menu to open the Bleach Correction dialog box, as shown
below:
Make regression between
The range of the frames--where to fit the exponential.
Independent variable
The independent variable can be the time or frame number. If the timing is irregular, then frame number
based bleach correction is suggested, while if the decrease of fluorescence is due to dye leakage, the
time based bleach correction is favorable.
Dependent variable
The exponential function is fitted onto the values of the dependent variable; this can be the average
intensity of the whole frame, or the average of a given ROI.
Regression type
The two parameter exponential (y=a*e^(-b*x)) decays to the zero. It can be used with well-subtracted
MetaFluor Analyst
6-2
Version 1.0.93
Advanced Image Processing
background. The three parameter one (y=a*e^(-b*x)+c) serves more general purpose.
Regression method, number of iterations, precision
The Simplex algorithm works the most reliably. Regression method, number of iterations, precision
should not be changed.
Action
•
The difference of fitted function from its first value is subtracted from the frames
•
Frames are factorized by the relative change of fitted function from its first value
Show Fit
Calculates the regression, shows the parameters, and displays the results on the graph (in red).
OK
Calculates the regression and process the images sequence as specified at Action filed.
Calibration
Select Calibration from the Calculate menu to open the Calibration dialog box, as shown below:
Grynkiewicz
Equation to calibrate ratiometric (or non ratiometric) fluorescent dyes:
C = Kd
R − vRmin F f 2
vRmax − R Fb 2
Where the concetration (C) is calculated from the dye dissociation constant (Kd), the maximal and
minimal ratio values (Rmax and Rmin), the intracellular viscosity (use 1 for water, usually between 0.6-0.8),
and from the free and bound dye fluorescence at the wavelength in the denominator (Ff2 and Fb2).
For non ratiometric calibration use Fmax and Fmin fluorescence intensities instead of Rmax and Rmin, taking
Ff2 and Fb2 equal to 1.
Normalization
Proportional scaling for general purposes:
C=k
F − Fmin
Fmax − Fmin
Where the concetration (C) is calculated from a arbitrary constant (k), and the maximal and minimal
fluorescent intesities (Fmax and Fmin).
MetaFluor Analyst
6-3
Version 1.0.93
Advanced Image Processing
Entering values
To acquire calibration values from Image Windows, press the red arrow button at each field, after the
corresponding ROI has been selected in the active Image Window.
Output
The order of magnitude of the calibrated values are highly affected by Kd and k. The result can easily be
out of the range of the used 16-bit data storage type. Pay attention of output box, where the data storage
type is shown of the Image Window to be calibrated. Set the data type of the calibrated Image Window
(real or integer) here. For example: if calibration ratio (real values) to intracellular calcium is nM, switch
output type to integer.
Threshold min/max
If selected, pixel values out of the range between Rmin and Rmax (or Fmin and Fmax) are masked by
calibrating as zero. Select Treat Zeros as Mask at Preferences dialog box / Datasaving to enable
masking during ROI calculation. Also select Use mask (=0) to show masking in the Image Windows.
Manual Unmove
Manual Unmove was designed to correct movements that happened during measurements. The stabile
posistioning of structures for ROI calculation in the image sequence can be ensured in this way, in the
case of uniform dislocations. Each frame can be freely dislocated or rotated by the numeric keypad
arrows (see popup menu). The movement of frames is linearly interpolated between the set positions;
the ones after the last set position are remaining in the last set position. If a frame position is set then an
“L” sign (Locked) appears on the upper left corner of the image. The first frame appears in green. The
current dislocated, rotated frame appears in red, so any dislocation can be easily noticed. To apply the
Manual Unmove command to an image, select Manual Unmove from the Filter menu. A sample Image
Window after the Manual Unmove command has been applied is shwon below:
To unmove an image after apply the Manual Unmove command, perform the following steps:
1
Drag the trackbar to the last correct position.
2
Lock the last correct frame by pressing “-“ on Numeric keypad.
3
Go to the first dislocated frame (or if the dislocation is slow, linear, into any further position).
4
Correct position by using the arrow keys in Numeric keypad for dislocation (“1” and “3 for
rotation). The red image has overlaping the green one.
5
Refine unmovement with repeating previous point in the interpolated frames.
By pressing “-“ on the numeric keypad the lock on a frame can be toggled, if the frame is not locked,
MetaFluor Analyst
6-4
Version 1.0.93
Advanced Image Processing
then its position is interpolated between the two neighboring ones. The frame movement can be reset by
pressing “*” on the numeric keypad, in this case it returns to the non dislocated position and becomes
locked. You can also right-click in the Image Window to acess the Unmove commands.
The unmovement can be finalized by pressing Enter or cancelled with Esc.
Filtering in Time
Filters acting in time are one dimensional filters, filtering a sequence of pixels in the same position in
image plane, along the image sequence. The running average (Filter / Running Average menu
command) and running median (Filter / Running Median menu command) are for noise reduction. Both
are working with a window size (in frames), which can be entered in the appearing dialog box. The
average or median is calculated in the given sized window from the beginning of the image sequence
shifting the window position one-by-en frame to the end. The result is placed back to the middle of the
window. The starting and ending, window size / 2 frames are discarded.
Temporal derivation (Filter / Temporal derivation menu command) is a temporal, 1 dimensional kernel
convolution filter. Capable for filtering any given column vector kernel, thus can be used for not only
temporal derivation, but for lowpass (or highpass) filtering in time for data smoothing. The calculated
values are multiplied by timefactor, to help data to remain in the dynamic range of the 16-bit data storage
(like temporal derivatives can be very small sometimes compared to the intensity values). Kernels can
be designed in the Preferences dialog box.
All filtering processes are in place operations.
Temporal derivation or DF/F calculations are very sensitive for (or amplifying) noise. That
is why sometimes good derivative or DF/F images can be obtained after thorough filtering
in time, but also in image plane. Median filtering can be used for removing hairy, sparklike noise from the measurements.
Temporal derivation is used for enchanced visualization of propagating wave, like
2+
intracellular Ca waves. Drawing a linescan diagram of a temporally differentiated image
sequence clearly shows the wavefront of the wave. Kernels for derivation:
1/2
0
- 1/2
MetaFluor Analyst
- 1/12
8/12
0
- 8/12
1/12
1/60
- 9/60
45/60
0
- 45/60
9/60
- 1/60
6-5
Version 1.0.93
Advanced Image Processing
Filtering in Image Plane
Filtering in image plane is used for noise reduction; however, it can also be used for extracting or
suppressing certain image details. 2D median filter (Filter / 2D Median menu command) works in image
plane with the given window size, and the result is placed in the middle of the rectangular filtering
window. 2D median filtering suppresses spots appearing the images. Image plane kernel convolution
filtering (Filter / 2D Fixed or Custom Kernel Convolution menu command) can serve as averaging, high
and lowpass filtering, spatial derivation according to the given kernel matrix. Kernels can be designed in
the Preferences dialog box. Fourier domain filtering can apply a user defined optical transfer function on
the images. The result is similar to low or highpass kernel convolution, but the filter design for filtering in
Fourier domain is more versatile, and the filtering spares the edges of the images. Practically by
appropriate filter function design in Fourier domain the desired sized objects (image details) can be
selectively amplified or suppressed. This can range from the correction for uneven background to
extraction of fluorescence signal coming from small organelles, like mitochondria.
Kernels for convolution filtering:
1/9 1/9 1/9
Averaging: 1/9 1/9 1/9 X-derivation: [1/2
1/9 1/9 1/9
1/2
0 - 1/2 ] Y-derivation: 0
- 1/2
Or similar, larger derivative kernels like at temporal filtering.
Filtering in Fourier domain
This section of the user manual assumes the knowledge of image representation in complex Fourier
domain, and optical transfer functions (See optics or system control textbooks).
This filter acts as a user defined optical transfer function ( Ĥ ). The software allows to design the Fourier
domain representation of the optical transfer function with the following limitations (for simplicity and
manageability), assuming, that the image is quadrate, and the origin is in the middle of the image:
The transfer function does not distinguish between directions.
The transfer function does not affect phase, only amplitude, thus the transfer function is real.
Thus the transfer function imagined in 3 dimensions: as transmission factor, function of x and y spatial
frequencies (wave numbers) looks like an axial symmetric object, a cone in the case of a lowpass filter.
Thus the
Ĥ
is represented by a real filter function (ffilter(k)), which describes the filters transmission
factors as a function of wave numbers. ffilter(0) is at the origin, and Ĥ is built up by circumrotating
ffilter around the origin, ensuring the same filtering in all spatial directions:
2
2
Hˆ (k x , k y ) = f filter ( k x + k y )
The filtering is done by the real multiplication of the complex Fourier transform of the image G, and
reverse Fourier transformation, that is why affects only amplitude and not phase:
G ' = F−1 { F {G} ⋅ Hˆ }
The advantage of using ffilter for optical transfer function design is that the diagram of ffilter (See filter
function design) clearly shows, that which sized image details are transmitted (amplified) or rejected. A
filter function for transmission of given sized image details is designed for a certain size and resolution
image. Using different size of images with the same filter function will different filtering.
The uniformity of the filter in different directions is satisfied only if the image is quadrate. Since this is not
always the case, or if a filter function had been designed earlier for a larger quadrate image, but now
only a region of the CCD was read out with the same resolution, and this sub image is intended to be
MetaFluor Analyst
6-6
Version 1.0.93
Advanced Image Processing
filtered similarly as the larger one, then the image has to be mapped into a larger, quadrate one for
filtering. The mapping happens by tiling the large image, quadrate with the small one, placing the
neighbouring images mirrored. The mirroring applies periodic features for the image, in this way the
edges will not be damaged during Fourier transformation.
Filter Function Design
The Set DFT Filter dialog box (DFT= Discrete Fourier Transform) can be invoked by the Filter / 2D
Fourier / Setup DFT menu command. This dialog box is for designing filter function and setting some
properties of the Fourier filtering.
On the editable graph the transmission (1=100%) of filter appears as a function of spatial frequences.
Thus low frequency (large) image details are transmitted if the beginning of the plot is high (lowpass),
while the high frequency (small) image details are transmitted if the end of the plot is high (highpass).
The pointer position is given in the status bar of the window, for the horizontal position in relative
distance from origin, percentage 100%=half image size, in spatial frequency (ν), in half of spatial
wavelength (λ/2). The shown vertical position is the transmission factor at the actual spatial frequency. In
the background of the plot a set of hyperbolically decreasing bars are visible, if the dialog box was
invoked while an Image Window was active. The bars are showing λ/2 values corresponding to size of
the active Image Window for the spatial frequencies of the graph. So high transmission factor will
transmit (amplify, if >1; or suppress, if =0) image details in the same size as indicated by the bars in
each position along the spatial frequency. If the filter function is zero at zero spatial frequency, then the
average intensity of the image will be zero.
Edit the plot in the following way:
1
Double-click to add a new point to the plot.
2
Click and drag point to move.
3
Right-click, select Delete to delete a point.
Toolbar Icons
•
Optimization
•
Reset plot to unitary function
MetaFluor Analyst
6-7
Version 1.0.93
Advanced Image Processing
•
Save — saves into own, binary format (*.flt)
•
Load — loads previously saved *.flt format
DFT Preferences
Preserve Edges
Maps the image with the mirrored tiling (described at Filtering in Fourier domain) into a double sized
image during filtering — in this way Fourier transformation does not cause artifactial stripes appearing at
the edges of the images. Double sized image means four times of calculation at DFT, thus it slows down
processing.
Real DFT output
The result appears as fixed point real values.
Enlarge image paper to 2^... using mirrored tiling
Maps the image with the mirrored tiling (described at Filtering in Fourier domain) into a given sized
window during filtering. Select this option for filtering non-quadrate images, or smaller images than that
for the filter function was designed. For fast DFT transformation 2^n sized images are optimal.
Calculate absolute value after DFT
Calculates absolute value of pixel intensities after filtering. Select this option for filtering with highpass
characteristics, if the filtered image sequence is for ROI average calculations. Loss of low (and zero)
frequency components renders the image zero mean, even during local, ROI calculations. However
absolute value calculation applies halos around objects, but makes ROI averaging feasible.
Leave only phase
After Fourier transformation the complex amplitudes are set to unitary, while the complex phase is left
intact. The filtering continues normally with the multiplication by the transfer function and reverse Fourier
transformation.
Run
Runs the filter on the active Image Window, separately on each frame. Same as the Filter / 2D Fourier /
Run DFT menu command.
Sharpening images (2D blind deconvolution):
Microscope optics (as every real optics) has low pass optical transfer characteristics. This
phenomenon causes blurring of the image and can be considered as a limitation of the resolution.
Images can be sharpened by designing a filter function where the higher spatial frequencies are
amplified for compensation of the loss of the high frequency components. Very high spatial
frequencies (>50% of half image) are carrying mostly noise; that is why these frequencies should
be suppressed rather than amplified.
Extraction of mitochondrial fluorescence for calcium imaging [1]:
Mitochondria are appearing as thin filamentous structures over the bulky cytosolic staining in
high-resolution fluorescent images of the calcium sensitive, classical chelator dye rhod-2 or its
derivatives loaded to monolayer cell cultures (this dye preferentially loads mitochondria, however
not completely selective, stains also the cytosol). With the filter function design it is possible to
design a highpass filter, which transmits the high frequency (small) details of mitochondria, while
rejects the low frequency (bulky) details of cytosol. Use the absolute value option for gaining
images for ROI calculations.
MetaFluor Analyst
6-8
Version 1.0.93
Advanced Image Processing
The theory is the following:
The fluorescent image (G(x,y)) is assumed to consist of the sum of fluorescence deriving from
the mitochondria (Gm) and the cytosol (Gc):
G = Gm + Gc
This can be done, because the focal plane of wide-field fluorescence microscopy is thick
enough to image both mitochondria and cytosol together. The Fourier transformation of the image
keeps the sum structure due to its linear nature:
F {G} = F {Gm + Gc } = F {Gm } + F {Gc }
The goal of Fourier transformation is that F{Gm} and F{Gc} are separated in the wave number
space, i.e. mitochondrial fluorescence (fine details) are represented at high, whereas that from
the cytosol at low wave numbers. Thus an appropriate optical transfer function separates
mitochondrial derived fluorescence from the cytosolic one.
Use mitofilter.flt for 512x512 pixel images acquired by a 100x optics (0.15 m/pixel).
[1]: Ákos A. Gerencsér and Vera Adam-Vizi, Selective, High-Resolution Fluorescence Imaging
of Mitochondrial Ca2+ Concentration, Cell Calcium 2001; 30.5: 311-321
Optimization of Filter Function for Image Detail
Extraction
Image detail extraction (like the discussed Mitochondrial Calcium measurement) is based on the
transmission of spatial frequencies carrying the important information, while rejecting the rest. For the
best results the optimally designed filter function is essential. Finding the best filter function is largely
empiric, manual work, the Optimize filter dialog box gives help in this.
This routine scans a range of spatial frequencies by bandpass filters in the given range, while
determining the level of image detail extraction by comparing intensities in different ROIs on the filtered
images. A new filter function can be built from the result of the scan, which probably needs also some
further manual enhancement, but gives the sketch of the filter function.
To start optimization dialog, perform the following steps:
1
Draw two ROIs on the image — one over an area rich in details to extract, and one over an
area, which is rich in details to reject.
2
Start Set DFT Filter dialog box (Filter / 2D Fourier / Setup DFT menu command), and set up
preferences (like enabling image enlargement and absolute value calculation). The filter
function will be deleted, so save it if needed.
3
Start Optimize filter dialog box, by pressing optimize icon in the top right corner. The
Optimize filter dialog box opens, as shown below:
!
!
!
MetaFluor Analyst
6-9
Version 1.0.93
Advanced Image Processing
Signal/Background ROI
Set the ROI number of details to extract in Signal ROI field, and set the ROI number of details to reject in
Background ROI field
Optimize
The routine will optimize the ratio of Signal over Background (S/N ratio) or the difference: Signal –
Background.
Compute
In this field the input frames have to be entered. There are two choices:
Calculate within the current frame: Calculates the parameter given at Optimize within the actual frame
in the actual Image Window. Use this if there are no fluorescence increases in the image sequence.
Change of signal between frames: Calculates the change of parameter given at Optimize between the
given two frames. Use this for extraction details brightening up upon a stimulus. Select Use DF/F to
compare DF/F normalized changes of Signal and Background.
Method (Frequency scan)
The routine scans spatial frequencies in the range of Frequency range fields (use numbers between 0
and 1) with bandpass filters dividing the range into Divide frequency range into number parts.
Result
New filters can be built either by taking the union of the Use the number most optimal bandpass filters, or
by building a proportional filter assigning 1 transmission to the best bandpass.
MetaFluor Analyst
6-10
Version 1.0.93
Advanced Image Processing
Optimize
Press Optimize button at the bottom to run optimization. A series of bandpass filter will run through the
filter function plot, generating results in the output of Method box. The Image Window content is left
intact. Build a new filter function by pressing the Build filter buttons of Result box.
Optimizing in situ mitochondrial calcium measurement:
Use a high-resolution image sequence of rhod-2 fluorescence, recorded during stimulation,
evoking calcium transient:
•
Set the signal ROI for the mitochondrium rich peripheral area of the cell
•
Set the background ROI to the nucleus of the cell.
•
Open Set DFT filter dialog. Select Enlarge image, if the recorded image is not
quadrate. Select Absolute value.
•
Open Optimize filter dialog.
•
Enter minotchondrial ROI for Signal, and nuclear for Background.
•
Select Signal – Background for optimization.
•
In the Compute box: select Change of signal; Enter a frame number from the
baseline, and one from the stimulus evoked fluorescence peak (where both nuclear
and mitochondrial fluorescence rise is present). Select Use DF/F.
•
In the Method box: scan range can be 0-0.5, dividing into 10 parts, however other
setting should be also tried.
•
Run optimization and build filter.
MetaFluor Analyst
6-11
Version 1.0.93