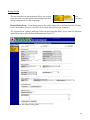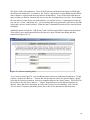
1
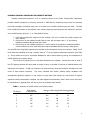
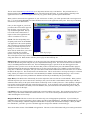
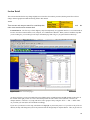
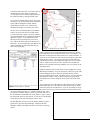
Development and Implementation of the Idaho Highway
Slope Instability and Management System (HiSIMS)
Prepared for
Idaho Transportation Department
Boise, Idaho
Research Contract No. SPR-0010 (027) 142
Report Budget Number KLK466
NIATT Report #N03-07
By
National Institute for Advanced Transportation Technology (NIATT)
University of Idaho
Principal Investigator:
Stanley M. Miller, Ph.D., P.E.
Professor of Geological Engineering
University of Idaho
Moscow, Idaho 83844-3024
Tel. 208-885-5715
Email: [email protected]
June 2003
ABSTRACT
Following initiatives and recommendations from the Federal Highway Administration (FHWA), a number of state
highway departments over the last 12 years have developed and implemented rockfall hazard management
programs for highways. The primary goal is to improve highway safety, but reductions in maintenance and
detour costs also result when slope hazards are mitigated. Additionally, a systematic method for agencies to
identify and prioritize slope hazard sites allows for highway funds to be allocated efficiently for construction
projects or counter-measures to deal with the recognized hazards.
Some state highway departments have
expanded the original focus on rockfall hazards to also include other types of unstable slope activity, such as
landslides, debris flows, and accelerated erosion. A systematic highway slope hazard assessment protocol has
been developed for the State of Idaho, which consists of a two-step procedure for hazard ratings: 1) a survey
rating by maintenance personnel to classify pertinent slope segments as having a very high, high, or moderate
potential of rockfall or erosional debris on the roadway; and 2) a detailed slope hazard rating based on extensive
modifications of the FHWA Rockfall Hazard Rating System. The Idaho Transportation Department slope hazard
management system has been developed for its centralized, intranet web server that will allow real-time
operations from multiple users within the transportation agency. This intranet web-based system is known as
Idaho HiSIMS (Highway Slope Instability Management System).
Key Words: slope stability, highway slopes, rockfall, slope hazards, slope erosion
1
INTRODUCTION
Slope instabilities along highways not only increase maintenance costs, but also may pose hazards that
lead to detours, traffic delays, and safety issues for the traveling public. Limited funds and manpower resources
are available for slope maintenance, repairs, and hazard mitigation projects. Thus, to improve fiscal efficiency
and highway safety, some method of rational, systematic evaluation of highway slope instabilities and related
hazards is needed to assess, compare, and prioritize (rank) problematic sites.
In the late 1990’s, the Idaho Transportation Department (ITD) recognized the need for a rockfall hazard
program for highways in the state and began a focused effort to develop such a program. Although some
rockfall problem areas were well known in the state, the severity and extent of these problems could not be well
established because a comprehensive inventory had not been completed for Idaho highways. This resulted in a
pattern of reactive response to rockfall events and little focus on evaluating highway slopes for preventative
treatments to enhance highway safety and to limit the State’s liability for rockfall hazards.
The initial work to inventory Idaho’s highways for rockfall hazards and develop a computer database for
managing that information has gradually evolved into a more comprehensive system that includes other slope
instabilities, such as landslides, debris flows, and accelerated erosion. An initial inventory survey was conducted
statewide for sites known by ITD maintenance personnel to produce rockfall or erosional debris on highways.
The follow-up ranking, or scoring, system for individual highway slope segments was based on the original
Rockfall Hazard Rating System proposed by the Federal Highway Administration (FHWA) in the early 1990’s
(Pierson et al., 1990; Pierson and Van Vickle, 1993), but also included extensive modifications adapted for Idaho
usage. The scoring system relies on two major categories of input: 1) the physical characteristics of the slope
and its geologic materials, and 2) the hazard exposure (risk) to the traveling public. The highway inventory
procedure and the development of the slope hazard evaluation method are described in the following sections, as
is the ITD web-based computer database and management system now known as Idaho HiSIMS (Highway Slope
Instability Management System).
2
HIGHWAY ROCKFALL INVENTORY AND SEVERITY RATINGS
Highway maintenance personnel in all six operating districts of the Idaho Transportation Department
provided valuable assistance to University personnel in 1999-2000 by completing survey forms and providing
first-hand knowledge of identified sites prone to at least minor rockfall problems across the State. The field
forms included information on the highway route number, beginning and ending mile post stations for each site,
and a rockfall severity rating of 1, 2, or 3 described as follows:
1 - Rock debris occasionally sloughs onto the roadway, with a low volume that usually requires only
minor cleanup.
2 - Debris occurs on the roadway several times per year, with the larger rocks (> 15 cm) causing
hazardous conditions during some such events.
3 - Debris occurs on the roadway frequently or in such a manner that produces a hazardous condition,
such as rockfall on a curve; these sites often require immediate attention during or after storms.
Just over 950 sites along Idaho highways were included in this maintenance survey and inventory. Nearly 200 of
those sites were identified as having a severity rating of “3” by the highway maintenance personnel (see Table
1). Survey results were input to a computer database for ease of future searching, sorting, and comparisons of
rockfall locations and severity ratings.
This initial survey focused only on rock debris delivered to the roadway. Several other sites in some of
the ITD operating districts also were noted as having a history or potential of erosional or mudslide debris to be
delivered to the roadway. Though not included in the original survey, these sites should be included in the next
round of slope hazard inventories.
The survey indicated that modern roadway design standards have
accomplished significant reductions in the amount of slope debris that reaches the road surface of highway
segments recently constructed or realigned, but older segments and secondary routes, which have a low priority
for maintenance or upgrade funds, still may be prone to persistent slope hazards.
Table 1. Summary of rockfall inventory and severity ratings.
ITD District
Total Number
of Rockfall Sites
Number of Sites with Rockfall Severity Ratings:
1
2
3
1
167
116
17
34
2
310
104
136
70
3
125
54
46
25
4
216
120
61
35
5
83
52
25
6
3
6
86
18
53
15
ALL
987
464 (47%)
338 (34%)
185 (19%)
This statewide rockfall severity inventory also provided information on initial prioritization of the “worst”
rockfall sites, based on comments from ITD maintenance personnel or on the high-hazard potential of certain
areas that may not necessarily have a history of significant rockfall cleanup activities. Such sites represent those
highway locations most worthy of receiving further attention with detailed hazard ratings and subsequent rockfall
mitigation efforts (if warranted). These sites are listed below according to route and mile post (mp).
District 1
SH 3
SH 5
SH 97
SH 200
mp
mp
mp
mp
55.0; 73.7
10.0
70.3; 94.8; 95.7; 96.0
41.5; 56.1
District 2
US 12
US 95
SH 7
SH 11
SH 13
SH 14
mp
mp
mp
mp
mp
mp
33.45; 56.45; 76.0; 78.8; 116.6; 120.1; 133.8; 159.6; 168.5; 172.4
198.0; 231.2; 286.2
51.0
4.2
14.5; 19.4
7.6; 10.1; 12.9; 16.6; 33.0; 42.0
District 3
US 95
SH 21
SH 55
mp 144.6; 173.6; 175.1
mp 11.1; 18.0; 73.8
mp 67.7; 76.5; 80.7; 91.9; 93.5; 94.2; 150.2; 150.6; 151.9
District 4
SH 75
mp 155.7; 199.2; 202.1; 203.0; 205.1; 208.3; 213.1; 220.8
District 5
US 89
SH 34
SH 36
mp 35.8; 37.1
mp 26.0
mp 114.6
District 6
US 26
US 93
SH 47
SH 75
mp
mp
mp
mp
374.5; 389.0
264.0; 273.5; 281.6; 283.3; 319.5; 324.5
11.6
224.0
DEVELOPMENT OF IDAHO SLOPE HAZARD RATING SYSTEM
One initial goal of this project was to investigate available rockfall hazard rating systems and adapt their
applicable components to build a customized hazard rating system for Idaho highways. We relied heavily on
4
previous work done by Federal Highways and by the transportation departments in Oregon, Arizona, and
Washington. As our field work progressed and we received input from ITD personnel, the Idaho rating system
gradually evolved into a unique rating system that included other roadside hazards (e.g., landslides, debris flows,
erosion) besides rockfall. This Idaho slope hazard rating system was intended to follow-up the statewide rockfall
severity inventory and provide important detailed hazard information for specific sites, information that could be
used to score, compare, and prioritize highway slopes for subsequent allocation of mitigation funds to improve
highway safety.
Previous Work: Overview of FHWA Rockfall Hazard Rating System
A rockfall hazard rating system for highways was proposed by Wyllie (1987) at a geotechnical workshop
sponsored by the FHWA (Federal Highway Administration). It relied on seven physical site characteristics and
three “risk exposure” categories:
Slope geometry:
Risk exposure:
1.
2.
3.
4.
5.
6.
7.
Slope height
Slope length
Effectiveness of catch-ditch at slope toe
Geologic structural condition
Shear strength (friction) of geologic structures
Size of rock blocks
Climate and water conditions
1. Decision site distance
2. Traffic quantity
3. Rockfall history
Scoring weights were assigned to “benchmark” values for each of the ten characteristics according to a cubic
exponential increase in severity (see Table 2).
A final hazard score for a given site then was obtained by
summing the scores from each characteristic. A total score greater than 500 indicated a site with “high risk” of a
rockfall-induced traffic accident, and a total score of 400 to 500 indicated “moderate risk” (Wyllie, 1987). English
units (rather than metric) are presented below, because they were in the original systems and have been
maintained by Idaho ITD for developing its own rockfall rating system.
This rockfall hazard evaluation tool became the foundation for a highway safety pooled-fund study
sponsored by the FHWA and 10 states, led by the Oregon Department of Transportation. The FHWA rockfall
hazard rating system (RHRS) that resulted from this study had much in common with the earlier Wyllie system,
but used four benchmarks and related scores (3, 9, 27, 81) rather than the five used by Wyllie. It also included a
5
separate option for evaluating differential
erosion on a soil-like slope, in contrast to a rock slope case.
The
Table 2. Highway rockfall hazard rating system according to Wyllie (1987).
Benchmark Descriptions and Scores
Site Characteristic
1
3
9
27
81
Slope height (ft)
< 15
15-25
25-35
35-45
> 45
Slope length (ft)
< 50
50-100
100-150
150-200
>200
Nil
Catch ditch
effectiveness
Meets Ritchie*
criteria
Adequate width,
inadequate depth
Moderate
Catchment
Limited
Catchment
Structural geology
Massive, no
fractures dipping
out of slope
Discontinuous
fractures with
random orientations
Fractures
form wedges
Discontinuous
fractures dipping
out of slope
Continuous
fractures dipping
out of slope
Rock fracture friction
Rough, irregular
Undulating
Planar
Smooth, slickensided
Clay, fault gouge
Rock block size (ft)
< 0.5
0.5 - 1
1-2
2-5
>5
Climate and water
Dry; warm winter
Moderate rainfall;
warm winter
Moderate rainfall;
some freezing
Moderate rainfall;
cold winter
High rainfall;
cold winter
Rockfall history
Nil
Occasional minor
events
Occasional events
Regular events
Major rockfalls,
rockslides
Traffic quantity
Very light
Recreational only
Moderate
Heavy
Very heavy,
continuous
Decision site distance
Adequate stopping
distance;
full shoulder
Good visibility and
shoulder width
Moderate visibility
and shoulder width
Limited visibility
and shoulder width
Very limited
visibility; no
shoulder
Note: TOTAL HAZARD SCORE (sum) has a value from 10 to 810.
* Recommended ditch width and geometry based on slope height and steepness (Ritchie, 1963).
characteristic of “decision site distance” was further quantified using FHWA and AASHTO (American Association
of State Highway Transportation Officials) guidelines for minimum decision site distance as a function of vehicular
speed, and by calculating a percentage using the actual sight distance. The actual site distance (ASD) is the
measured horizontal distance at which a 6-inch high object disappears from view when the eye height is at 3.5 ft
above the roadway. The decision site distance (DSD) is defined as the minimum distance (ft) required for a
driver in a moving vehicle to detect a hazard on the roadway, make an immediate decision, and take correction
action. Therefore, the percent decision sight distance used in the RHRS is calculated as follows:
6
%DSD = (ASD / DSD) x 100% , where DSD is given by:
DSD = 450 ft when posted speed limit is 30 mph,
600 ft when posted speed limit is 40 mph,
750 ft when posted speed limit is 50 mph,
1000 ft when posted speed limit is 60 mph,
1100 ft when posted speed limit is 70 mph.
The RHRS provides a total hazard score by summing scores in all the categories, but only one option is
used for the geologic condition; interpolation formulae also are provided for estimating scores in between the
identified benchmarks (Pierson et al., 1990; Pierson and Van Vickle, 1993). The system is summarized in Table 3
below.
Table 3. Summary of FHWA rockfall hazard rating system (RHRS) adapted from Pierson and Van Vickle (1993).
Benchmark Descriptions and Scores
Site Characteristic
3
9
27
81
Slope height (ft)
25
50
75
100
Roadway width (ft)
44
36
28
20
Catch ditch
effectiveness
Geology - Case 1
Rock structure
Rock-joint friction
Geology - Case 2
Erosion features
Erosion rates
Rock block size (ft)
and volume (cu.yd.)
Good catchment
Moderate catchment
Limited catchment
No catchment
Discontinuous joints,
favorable orientation
Discontinuous joints,
random orientation
Discontinuous joints,
adverse orientation
Continuous joints,
adverse orientation
Rough, irregular
Undulating
Planar
Clay, slickensided
Few differential
erosion features
Occasional differential
erosion features
Many differential
erosion features
Major differential
erosion features
Small difference in
erosion rates
Moderate difference in
erosion rates
Large difference in
erosion rates
Extreme difference in
erosion rates
1
2
3
3
6
4
9
12
Climate and water
Low to mod. precip.;
no freezing; no water
on slope
Moderate precip. or short
freezing periods or
intermittent water on slope
High precip. or long
freezing periods or
continual water on slope
High precip. and long
freezing periods; or
continual water on slope
and long freezing periods
Rockfall history
Few events
Occasional events
Many events
Constant events
Average vehicle risk*
25% of the time
50% of the time
75% of the time
100% of the time
Decision site distance
Adequate, 100% of
low design
Moderate, 80% of
low design
Limited, 60% of
low design
Very limited, 40% of
low design
7
Note: TOTAL HAZARD SCORE (sum of 10 scores) has a value from 30 to 810.
* Average vehicle risk (AVR) = 100% x [Avg. Daily Traffic x Slope Length (mi.)] / [Posted Speed Limit (mph) x 24 hr/day]
Note: AVR greater than 100% indicates more than one vehicle is subjected to the site hazard simultaneously.
Adaptation of Hazard System to Idaho Highways
During the 1990’s a number of states adopted the RHRS or a modified version specially designed to meet
a given state’s needs. In Idaho, work began in 1999 to systematically evaluate highway rockfall hazards and
develop a statewide database and management system to deal with these hazards. The slope hazard rating
system currently in use for Idaho highways is based partially on the FHWA RHRS but also includes elements from
the Washington State DOT Unstable Slope Management System, which uses less geologic input than the RHRS
and much more information tied to economic factors such as cleanup costs, detours/delays, and pavement
damage (Lowell and Morin, 2000). The Idaho rating system requires the field investigator to input basic field
observations and measurements, some of which are then used for internal computer calculations to provide
intermediate scores for various hazard factors.
Field data can be recorded on paper forms or typed into a
database input screen on a laptop computer or PDA (personal digital assistant). Some of the information is
obtained from ITD office files either prior to or after the field assessment. Required specific input for the
database and for computing a hazard rating is given below:
S1. ITD District No.
Example: 3
S2. Highway Route No.
Example: US 95, SH 55
S3. Begin MP (milepost)
To the nearest 0.01 mile
S4. End MP (milepost)
To the nearest 0.01 mile
S5. Side (left or right)
As observed in the increasing milepost direction
S6. Geo-type (rock or soil or both)
If both, indicate which one is dominant
S7. Posted speed limit (mph)
S8. Estimated sight distance (ft)
S9. Impacted road length (ft)
S10. Roadway width including paved shoulder (ft)
S11. Catch-ditch width (ft)
S12. Average daily traffic (ADT)
Available from ITD central database
Required categorical rating information includes the following:
C1. Slope height (ft)
C2. Slope angle (H:V) - rock
- soil
C3. Slope/ditch condition
< 30
30-50
50-70
< 1:1
1:1 - .5:1
.5:1 - .25:1
> 70
> .25:1
< 3:1
3:1 - 2:1
2:1 - 1.25:1
> 1.25:1
good runoff
some runoff
some slope
continuous slope;
8
(soil slope only)
intercep. & veget.;
ditch cleanout
reqd. rarely
intercep. & veget.;
ditch cleanout
every 5-6 years
breaks/veget.;
ditch cleanout
every 2-3 years
nil breaks/veget.;
ditch cleanout
annually, or major
events expected
to overwhelm ditch
C4. Failure frequency
1-3 per year
4-10 per year
C5.
Minor; scrape off
debris, clean ditch
Minor; some debris
on shoulder; traffic
slowed or minor
delays (< 10 min.)
Moderate; some
loading & hauling
Moderate; debris
in one lane; signif.
delays (> 15 min.)
Often and after
signif. storms
Major; signif.
loading & hauling
Major; debris in
more than one lane;
reroute traffic
with signif. detour
Very often;
nearly continuous
Extensive work
Maintenance/Cleanup
C6. Traffic Impact/Delays
Extensive; debris
across the entire
roadway;
major detour
In general, the four benchmark divisions for these categorical characteristics receive scores of 3, 9, 27,
and 81 (same as the RHRS). However, in the case of a rock slope, C1 and C2 are used in conjunction with S11
to obtain a single numerical score for catch-ditch effectiveness. The rationale is that slope height and steepness
effects on rockfall hazard are controlled (tempered) by the catch-ditch effectiveness (primarily width) at a given
site. That is, a high rock slope should not be assigned a high score (81) if an adequate catch ditch is in place at
the toe of the slope. The criteria used for catch-ditch effectiveness is based on information provided in the
Rockfall Catchment Area Design Guide from the Oregon DOT (Pierson et al., 2002). Application to the Idaho
slope hazard system is summarized in Table 4. In the case of a soil slope that could be subject to erosion or
landslide activity, the effectiveness of a catch ditch and/or barriers is assumed to depend on the same factors
(C1, C2, S11) but is handled through a separate factor for soil slopes only (C3). Though not required at each
site, photographs or digital images of the highway slope are highly recommended and should be incorporated
into the computerized database (see Figures 1 and 2).
Optional field input for the Idaho slope hazard database includes information on geologic conditions
(such as the orientation and planarity of rock discontinuities), size of rock blocks or landslide debris that may be
deposited on the roadway, impact patterns/dents of rock debris on the pavement, climate (precipitation and
freezing potential), and other comments that may include notes on number of traffic accidents due to rock/soil
debris and on identifying potential repair/mitigation methods. The overall slope hazard rating score is the sum of
ten individual factor scores as shown in Table 5. The total hazard score may range from 30 to 810. The last
factor in the table was included at the suggestion of ITD geotechnical personnel in order to account for potential
large-impact hazards that might be overlooked by focusing only on highway segments that had experienced
9
some rockfall or erosion problems in the past. Although this scoring system is intended primarily for cut slopes
above the roadway, it also can be applied to distress in fill slopes or embankments (differential settlements, slope
instabilities) by replacing the ditch effectiveness factor with a shoulder/pavement damage severity factor.
Table 4. Estimating the slope hazard score for catch-ditch effectiveness based on experimental rockfall data
from field tests in Oregon; ditch widths are in feet and represent the 0.60, 0.80, and 0.95 quantile values from
published cumulative percent retained curves for slightly inclined ditch bottoms (Pierson et al., 2002).
Slope Angle (H:V)
Height (ft)
1:1
0.5:1
0.25:1
Vertical
Score
<30
3
9
27
81
> 16
12-16
9-11
<9
> 14
12-14
9-11
<9
> 10
8-10
5-7
<5
> 12
10-12
8-9
<8
30-50
3
9
27
81
> 26
19-25
14-18
< 14
> 20
15-20
11-14
< 11
> 12
9-12
6-8
<6
> 14
12-13
10-11
< 10
50-70
3
9
27
81
> 28
20-27
16-19
< 16
> 25
18-25
14-17
< 14
> 28
19-27
13-18
< 13
> 16
13-15
11-12
< 11
> 70
3
9
27
81
> 38
28-38
19-27
< 19
> 27
19-26
14-18
< 14
> 36
25-36
18-24
< 18
> 18
15-17
12-14
< 12
10
Figure 1. Vertical rock slope with a good rockfall catch area.
Figure 2. Near-vertical rock slope with inadequate catch ditch.
Approximately 100 highway slope segments have been rated using this system (or an earlier version of
it). Evaluators used paper forms to gather input data in the field, then that information was transferred to a PC
computer database. Rather than store any digital images directly in the computer database (due to storage
space limitations), they were stored in a separate media (CD-ROM) to be available for retrieval as needed.
RECOMMENDATIONS FOR FIELD DATA COLLECTION
To maintain consistent and reliable standards for each of the input fields for the highway slope hazard
rating, ITD should implement data collection protocols to be used statewide in all of the ITD districts. Our
11
recommendations for the initial set of protocols are summarized below.
Site Location
The general location should be reported by designating the District and Route Number. More specific site
location information includes the following:
1. Beginning and ending milepost for the slope hazard site, recorded to the nearest 0.01 mile if possible.
The invesitigator should select these boundaries based on the longest extend of the highway slope that
has fairly consistent characteristics (slope height, slope angle, catch-ditch width, site distance, etc.).
Very rarely will a site extend much beyond a mile or so without an important site characteristic changing
significantly. Rather, most sites likely will be less than 0.3 mile. As ITD personnel become familiar with
HiSIMS, they will develop a uniform strategy for recognizing the road-span of a distinctive highway slope
hazard site.
Table 5. Highway slope hazard rating system for Idaho.
SCORES:
Roadway Width (ft)
3
> 40
Slope and Catch Ditch
Rock: Ditch Effectiveness
OR
good runoff
Soil Slope/Ditch
Failure frequency
9
30-40
27
20-29
81
Example
Entry
< 20
Obtain scores from Table 3.
9
27
intercep. & veget.;
ditch cleanout
reqd. rarely
some runoff
intercep. & veget.;
ditch cleanout
every 5-6 years
some slope
breaks/veget.;
ditch cleanout
every 2-3 years
continuous slope;
nil breaks/veget.;
ditch cleanout
annually, or major
events expected
to overwhelm ditch
1-3 per year
4-10 per year
Often and after
signif. storms
Very often;
nearly continuous
3
9
Impacted road length (ft)
< 50
50 - 200
200 - 500
> 500
Maintenance/Cleanup
Minor; scrape off
debris, clean ditch
Moderate; some
loading & hauling
Major; signif.
loading & hauling
Extensive work
Traffic Impact/Delays
Minor; some debris
on shoulder; traffic
slowed or minor
delays (< 10 min.)
Moderate; debris
in one lane; signif.
delays (> 15 min.)
Major; debris in
more than one lane;
reroute traffic
with signif. detour
Extensive; debris
across the entire
roadway;
major detour
Average Daily Traffic
< 200
200 - 1000
1000 - 3000
> 3000
27
Average Vehicle Risk
(AVR)*
< 25%
25 - 50%
50 - 75%
> 75%
81
> 100%
80 - 99%
60 - 79%
< 60%
9
Percent Decision
Sight Distance (PDSD)*
27
9
12
Potential for Major/Extreme
Rockfall, Landslide,
Debris Flow, or Erosion
Event not observed in
recent years
Nil
Some potential
Moderate potential
9
High potential
EXAMPLE TOTAL:
210
* Calculated based on user-specified input information (such as posted speed limit).
2. Segment code for the slope hazard site. This is the ITD-designated code for highway segments, which is
a unique identifier that can be used to differentiate between route sections that may have overlapping or
duplicate mile post readings. In most cases, this information is not required and is left to the discretion
of the investigator.
3. GPS data for the slope hazard site. If the latitude and longitude of the site have been obtained by a GPS
unit (as recorded at the approximate “center” of the slope site), then this information can be added to
the data base. We encourage ITD personnel to begin logging this GPS information into the data base for
slope sites as soon as practical; this will allow for more advanced mapping, display, and analysis
procedures in the future.
4. Side of the highway where the slope site is located. This designation is taken to be the right side or left
side as a motorist travels in a direction of increasing mile post numbers.
Site Characteristics
5. Posted speed limit in the immediate vicinity of the slope hazard site. It the site is located on a curve, this
speed limit may be less than the standard 55 or 60 mph for two-lane highways.
6. Estimated site distance for a driver to see an object on the roadway when approaching the slope hazard
site from either direction. The recorded site distance should be the shorter (minimum) of the two
measurements taken from the two directions. This distance is defined as the measured horizontal
distance at which a 6-inch high object disappears from view when the eye height is at 3.5 feet above the
roadway surface. We have had good field success using a laser, handheld range finder to take these
measurements. Site distance may be affected by horizontal curves or by vertical grade changes along a
highway.
7. Impacted road length is the typical length of roadway to be affected by a slope failure at the site. The
actual estimated length should be recorded in the field (e.g., 85 feet), even though HiSIMS uses
categories (e.g., <50 ft, 50-200 ft, and so on). The impacted road length could be as small as 15 feet
13
for an isolated rockfall (one rock) to as large as hundreds of feet for a rock slide or landslide.
8. Class of slope material at the site. The class of slope material will be designated as soil, rock, or a
combination of both soil and rock. For “mixed-mode” sites, the type of material deemed most likely to
cause problems should be designated.
Site Dimensions
9. Roadway width measured from edge to edge of the paved surface (including shoulders). The actual
width should be measured and recorded in the field, even though HiSIMS uses categories (e.g., <20 ft,
20-29 ft, and so on).
10. Slope angle of the slope hazard site. The slope angle can be measured using a handheld inclinometer,
Brunton compass, or it can be visually estimated (though this is not recommended). This angle should
be recorded in degrees; it will be used to help evaluate catch-ditch effectiveness.
11. Slope height of the slope hazard site. This is the vertical height of the slope cut, slope fill, or natural
slope that may contribute to rockfall or slope instabilities at the site. If a range finder is used to measure
the slope distance (or slope height), then the vertical height is obtained by multiplying this slope distance
by the sine of the slope angle.
12. Width of catch ditch is the typical width of the catchment area at the slope hazard site. This catchment
may be a well-defined shallow depression or just a flat area where rockfall debris may collect alongside
of the paved roadway. Its recorded width should be measured as the horizontal distance from the toe of
slope to the edge of pavement.
Other Site Information
13. Average daily traffic counts (ADT) for this segment of highway. This information is readily available from
ITD resources. The actual count should be recorded, even though HiSIMS uses categories (e.g., <200,
200-1000, and so on).
14. Failure frequency at the site. This is based on historical experience with cleanup of slope failure debris at
the site by ITD maintenance crews. The investigator should select the appropriate category from the
Idaho slope hazard rating system.
15. Maintenance and cleanup of slope failure debris at the site. This is based on historical experience and
site characteristics that may be conducive or detrimental to the cleanup of slope failure debris. For
example, some sites may allow ready disposal of debris off the shoulder of the road, while other sites
(near streams) may require loading and trucking of debris for disposal. The investigator should select
the appropriate category from the Idaho slope hazard rating system.
16. Traffic impacts and delays at the site due to a slope failure. This is based on historical experience with
the extent of cleanup and on the availability of alternate routes in the vicinity for detours. The
investigator should select the appropriate category from the Idaho slope hazard rating system.
17. Potential for a major event not observed in recent years at the slope site. This is based on the geological
assessment of particular, potential problems at the site that may not have been maintenance issues in
14
the past, but could increase the hazard potential of the site. For example, steep terrain with numerous
first-order drainages could be fairly stable in typical precipitation years, but could generate numerous
mud slides or debris flows during storm events with return periods of 50 or 100 years.
18. Miscellaneous information on site geology, photographs, maintenance history, accident counts, and
general comments can be added to the HiSIMS data base using the appropriate entry fields. We
recommend that maintenance personnel use the “Historic Data” box on the Slope Data Page to track and
update maintenance issues associated with slope hazard sites. For geologic information on key
structures, the type of structure can be designated with a single letter code entered in either the dip
direction or the dip field (such as: J124, 45 for a joint set with dip direction of 124o and dip of 45o; or
F322, 68 for a foliation with dip direction of 322o and dip of 68o).
The HiSIMS website on the ITD intranet is ready for operation except for two aspects that will need to be
completed by ITD Information Systems personnel in Boise. The first is to finalize and implement a security
firewall protocol that will allow the uploading of digital images/photographs from District offices to the central
website. The second task is to establish and implement password levels for ITD users across the state. Neither
of these capabilities is now available in the HiSIMS test site on the ITD server.
RECOMMENDATIONS FOR FUTURE IMPROVEMENTS TO HiSIMS
Although a number of improvements were added to HiSIMS after receiving ITD feedback during the May
2003 workshops around the state, several “Stage 2” upgrades could not be incorporated into the current version
of HiSIMS due to project time and budget constraints.
These proposed second generation upgrades are
summarized below, and an estimate of programmer days for each one is provided.
1. Flag a site to remove it from being searchable.
This will require a re-structuring of some of the links in the data base, meaning that additional planning
and development will be needed for HiSIMS. (4-6 programmer days)
2. Remove or edit historical comments.
Such editorial capability of the data-base fields will require more sophisticated levels of data management
within HiSIMS. (6-8 programmer days)
3. Add a new comment field for exclusive use for maintenance notes.
This will require minor formatting and some substantial data link enhancements within HiSIMS; the
15
capability to edit these comments will demand significant re-building efforts. (2-6 programmer days)
4. Capability to combine mitigation methods.
To accomplish this within HiSIMS, a much more advanced level of handling the mitigation cost matrix and
editor will be needed. (8-10 programmer days)
5. Develop an e-mail electronic submittal form (for remote Maintenance Shops without intranet access).
This enhancement will require significant planning for formatting and electronic interfacing with HiSIMS,
prior to development work. A front-end module likely will need to be produced for HiSIMS to make it
ready for receiving such e-mail submittals. (10-12 programmer days)
ACKNOWLEDGEMENTS
The authors wish to thank Robert Smith, Keith Nottingham, Brian Bannan, and Millie Miles of the Idaho
Transportation Department (ITD) for their support of this project. Numerous ITD Maintenance personnel around
the state provided invaluable assistance during the rockfall severity inventory and follow-up work. Most of the
field work was conducted by University graduate students Shari Silverman and Angela Taylor.
The initial
ACCESS data base that eventually led to HiSIMS was originated and developed by Shari Silverman. Funding
was provided by ITD for this project via the National Institute for Advanced Transportation Technology at the
University of Idaho, directed by Dr. Michael Kyte.
REFERENCES
Lowell, S. and P. Morin, 2000. “Unstable Slope Management: Washington State”; Transportation Research
News, v. 27, Transportation Research Board, Washington, DC.
Pierson, L.A., S. Davis and R. Van Vickle, 1990. “Rockfall Hazard Rating System Implementation Manual”;
Federal Highway Adminstration Report FHWA-OR-EG-90-01, Federal Highway Administration, Washington,
D.C.
Pierson, L.A. and R. Van Vickle, August 1993. “Rockfall Hazard Rating System - Participant's Manual”; Federal
Highway Administration Report FHWA-SA-93-057, Federal Highway Administration, Washington, D.C.
Pierson, L.A., C.F. Gullixson and R.G. Chassie, Feb. 2002. “Rockfall Area Catchment Design Guide”; Oregon
DOT Final Report, Proj. No. SPR-3(032), Salem, OR.
Ritchie, A.M., 1963. “The Evaluation of Rockfall and its Control”; Highway Research Record No. 17, Highway
Research Board, Washington, DC.
Wyllie, D., 1987. “Rock Slope Inventory/Maintenance Programs”; FHWA Rockfall Mitigation Seminar, 13th
Northwest Geotechnical Workshop, Portland, Oregon.
16
Appendix 1
HiSIMS USER MANUAL
This document is intended to assist those who will be using the HiSIMS (Highway Slope Instability Management
System) web application to search, maintain, or calculate cost and needs associated with Idaho highway slopes. Andrew
Crapuchettes did the development work under the direction of Professor Stan Miller, NIATT (National Institute for
Advanced Transportation Technology), and the Information Systems personnel at ITD (Idaho Transportation Department).
If you have any questions, please contact the author given below.
Document Author
Author Phone
Author e-mail
:
:
:
Andrew Crapuchettes
(208) 699-4292
[email protected]
Table of Contents
Page
Application overview . . . . . . . . . . . . . . . . . . . . . . . . . . . . . . . . . . . . . . .
2
Section detail . . . . . . . . . . . . . . . . . . . . . . . . . . . . . . . . . . . . . . . . . . . . .
4
Search
........................................
Rating Forms
........................................
Slope History
........................................
Cost Matrix
........................................
Mitigation Methods . . . . . . . . . . . . . . . . . . . . . . . . . . . . . . . . . . . .
Credits . . . . . . . . . . . . . . . . . . . . . . . . . . . . . . . . . . . . . . . . . . . . . . . . . .
4
13
18
20
22
23
Application Overview
The HiSIMS (Highway Slope Instability Management System) web application can and should be used to track the history
and hazard of highway slopes in the state of Idaho. The application uses a hazard rating system that allows the user to
determine which sites are in the most immediate need of repair. All costs calculated by the system should be questioned and
examined if they do not seem reasonable for the given site. There are numerous variables that cannot be taken into account
by the system and will need the expert eye of an ITD planner or engineer.
17
The site can be found at http://itdtest/hisims (as of July 2003) and uses only a web interface. The preferred browser is
Internet Explorer (IE), but the site will work just as well with Netscape Navigator. If you have trouble connecting to the
application or have trouble with the application in any way, please contact your ITD system administrator.
When you have connected to the application via your web browser of choice, you will be presented with a user login screen
(Fig. 1). You will need a HiSIMS User Name and Password to access the application at this point. These may be obtained
from an ITD systems administrator.
Once you have logged on, you will be
presented with a menu on the upper left
that will allow you to navigate your
way around the application. The top
level of this menu contains the five
major sections of the application and
will be covered here in overview.
Search: The first and probably most
frequently used section of the HiSIMS
web application is the search capability.
This section has two different methods
to help you find the slope that you are
looking for. The first is the location
driven search, which allows you to find
a slope site based on its location
Figure 1 (Main log-in page)
(district, road, mile post) in the state.
The second option is the Slope Characteristic driven search, which allows you to find a slope based on criteria such as hazard
rating and vehicle risk. Both searches will take you to a page for that road slope site.
Rating Forms: The second section allows you to enter new slope sites, add new hazard rating forms, manage your previous
and current hazard rating forms and print out your completed hazard rating forms. This section is broken into two different
areas, Form Management and On-line Form. The Form Management page is specific for the user that logged on to the
application. Here, you have access to all of the forms that you have worked on in the past, both submitted and in progress.
If the hazard rating has already been submitted to the server, then you will be able to see a printable version of the hazard
rating form. If the form is incomplete, then you will be able to make further modifications to the form and re-save or submit
the data for the slope site. The second section is the On-line Form. This is used to enter a new slope site and give it a hazard
rating. When you submit or save this form it will automatically be added to the Form Management page. Once a form is
submitted, it becomes part of the permanent web database and can only be modified by the system manager.
Slope History: The third section will normally be used in conjunction with one of the two search methods. When you have
found the slope that you want or entered a new road slope, then you will be able to add comments to that slope with dates
attached so that a history of the repairs and/or failures of that slope can be viewed by later users. This capability is designed
to be used by repair personnel after they return from the given site. If you go directly to this section from the menu, and
enter data for a site that does not already exist in the database, then you will be taken to the hazard rating form so that you
can add a new form for the slope.
Cost Matrix: Only users with appropriate permissions can use this and the next section. The cost matrix page allows you to
edit the cost per unit and the formula associated with that cost. You can also edit the questions that the user will receive
when calculating the cost for a slope.
Mitigation Methods: This last section is also restricted to only users with appropriate permissions. If you feel that you
should have these permissions and don’t, please contact your ITD systems administrator. The Mitigation Methods page will
allow you to add, manage, and delete mitigation methods that are used by ITD on hazardous road slopes. When you add a
new method here, you need to go to the Cost Matrix page next and give the method a cost and unit type.
These are the main sections of the HiSIMS web application. The next section of this manual will go into much greater detail
18
on each of these sections and their sub-sections.
19
Section Detail
The sections described below may change slightly in user interface from what is presented, but the general flow will not
change without appropriate modification being made to this manual.
Search
There are two main ways to search for a road slope site,
main menu search section accesses both.
and
the
Location Driven: The first way to find a highway slope (based primarily on a graphical interface) is to search based on
location. Location can mean district, route, milepost, or a combination of them all. When you have found the slope that
you are looking for, you can then go to the slope information page that will give you greater detail on that slope.
Figure 2 (Location search start page)
As shown in Figure 2 you are presented with a map of Idaho on the left and By Route and MP columns on the right. In
the column on the right you also see a list of all road slopes that meet the current criteria (full state, all routes, all
milepost markers). This list is very long and can be seen in groups of 20 by using the “Next >>” and “<< Back” links.
As you refine your search, this list will shrink accordingly.
If you move your mouse over the map, each district will highlight as your mouse passes it. If you click on any of the six
districts, the map will change and you will be presented with an enlarged map of only that district. Then, to get back out
20
to the map of the entire state, you need to click on
magnifying glass on the upper left (shown in
3). You may also move to other adjacent districts
this zoomed in map by clicking on them in the
the
Figure
from
map.
Once you have used the map to refine your search
one district, you will notice that the list of highway
on the right has changed in content, and has
significantly decreased in size. This list will
automatically change as you refine your search.
down to
slopes
The next level of refinement that can be added to
search is to specify only one route either in that
or in the entire state. Again, if you have a district
selected and add this level of refinement, both will
applied to your list. If you still have the entire
showing on the map, then specify one route to
on, it will list all of the road cuts for that route in
entire state. It is also important to note that the list
routes will update based on the district that you
don’t select on the map.
the
district
already
be
state
search
the
of
select or
always
Figure 3 (Zoomed in map of District 2)
To
select a specific route, go to the drop down list box that says “Route”.
Click on the down arrow and then select the route of your choice. Use
the button to the right of the milepost text boxes, called “Get Data”, to
access the server, which then will return the list of highway slopes that
match the new criteria. You will also notice that the text below the
route drop-down menu is now updated to display your current search
criteria. Figure 4 shows the list of six sites that were returned after
District 2 was selected on the map, and Route 162 was selected via the
drop down menu.
Further refinements may be made to the search by adding one or both
MP (milepost) numbers. If you are looking for a place on a given route
between milepost 50 and 75, then enter that data into the two text
boxes provided to the left of the “Get Data” button. You may also add
these numbers without a route or district, and you will get all of the
road slopes between those mileposts for all of the routes in the entire
state.
You can enter just one of the milepost values and press the “Get Data”
button and be able to see all of the sites after the first text box and all
Figure 4 (List for Dist. 2, SH 162)
of the sites before the second text box. So if you are looking for all of
the road cut sites on a given route for the first 15 miles, then leave the
first text box blank and enter “15” into the second text box. After
pressing the “Get Data” button, you will be presented with a list of
the sites that have an End MP value of less than 15. Figure 5 shows
this performed on the previous search. As you can see, this brought
our list down to four sites from the previous six sites.
The last thing that you will want to do with the data that you have
procured is to go to the Slope Data Page, clicking on the link
(identifier number) that contains the name of the route. This page
will be
21
Figure 5 (Mile Post refinement results)
covered in detail in the next section.
Quick Reference – Location Search
•
•
•
•
•
Pick the district on the map
Pick the route from the “Route” drop-down menu
Enter mileposts search range for the slope site
Press the “Get Data” button
Click on the link of the route name
22
Characteristic Driven: The second method for locating a desired highway slope(s) that has been rated with the hazard
scoring system is the Slope Characteristic search found in the menu just under the Location Driven search. This search
generally lets you locate a highway slope based on information about the slope and does not discriminate based on
location in the state.
Figure
6
shows
the
Figure 7 (More than 600)
startin
g page
for the
charac
teristi
c
driven
search
.
Slopes
can
have a
hazard
rating
Figure 6 (Characteristic Driven Search)
betwe
en 30
and
810. If you would like to see all of the road cuts that have a rating higher than 600, then you would pick “more than” in
the first drop down menu and then put in “600” in the text box (Figure 7).
You can think of this as building a sentence that describes the slope for which you are searching. So, if you want all of
the slopes that have been rated with a hazard level of more than 600 and are rock rather than soil, then you build a
sentence to describe the slope. “Find slope sites where the Rockfall Hazard Rating is more than 600, and the Problem
Type is rock.” This sentence is built in Figure 8.
Figure 8 (Example 1 for conditional search)
At this point, you could continue building the sentence with the use of the logical “And/Or” dropdown boxes on the left. For example, you may want the slopes described in the sentence above, but
also want any slope that shows up with an Average Vehicle Risk score of 81 (the highest severity
23
level) if the AVR score is your highest priority. Figure 9 shows this addition to the search criteria
sentence.
Figure 9 (Example 2 for conditional search)
You can use any or all of the criteria at the same time, and the slopes described by that sentence will be returned.
Once you have the search criteria sentence looking the way that you want it, then you need to press the “Search” button
to proceed. The system will display a search-results page similar to the page shown in Figure 10.
Figure 10 (Search Results)
The results that are now shown (Figure 10) can be sorted by any of the five categories (Slope ID, Hazard Rating,
Problem Type, Average Daily Traffic, and Average Vehicle Risk). To sort by the category that you would like, click on
the name (heading) of that column. The page will refresh with the rows now sorted by that column. When the page is
first displayed, the rows will be sorted by “Slope ID”. Next, to display the slope detail page, click on the “Slope ID”
link.
Quick Reference – Characteristic Search
•
•
•
•
Build a sentence describing your desired slope search
Press the “Search” button
Sort rows by clicking the column heading to sort by that characteristic
Click on the link of the “Slope ID”
24
25
Saving Searches: Once you have completed a Characteristic Driven search, you may want to save your search, so that
you will not need to enter the details again but can display any new road cuts that match your criteria. Saving searches
can be accomplished by going back to the Characteristic Driven search main page with the use of the menu or the
“Back” button in your browser.
Once there, build or confirm the
search criteria sentence you would
to save. Then, in the text box right
after the words “Save this search
type in the name of the search as
would like to see it appear later
(Figure 11). Then, click on the
“Save” button to the right of the
box. This will save all of the
details of your search criteria
sentence into a “cookie” and place
name you have chosen in the dropdown box at the top of the search
area.
like
as,”
you
text
the
T
o
Figure 11 (Saving a search criteria sentence)
Figure 12 (Saved searches)
really see this working, you will need to save an additional set of criteria
with a different name. After you have done that, you can switch back and
forth between the two by selecting them in the drop-down box mentioned
earlier (see Figure 12).
26
Slope Data Page: When you search for a slope using either of the two methods listed above you are only given sparse
detail about the slope by the page that returns the results. To look at more detail and to add historic detail, you will need
to go to the Slope Data Page (Figure 13). This page cannot be entered via the main menu but can only be seen when
referring to a specific slope from a search. You can enter the page when you conduct a location search by clicking on
the route number, and when you conduct a characteristic driven search by clicking on the Slope ID link.
Figure 13 (Slope Data Page)
Starting at the top of the page you find the information about the slope. There are many slopes in the database that do
not have hazard rating forms attached, but do have severity ratings. You can only find these slopes by the location
search, because detailed characteristics about the slope are not known. At the very top of the top box is the severity
rating (3, for this slope). The severity rating goes from 1 to 3, with 3 being the worst.
The next box down is the “Detailed Hazard Rating Form(s).” In this box you will find any and all of the rating forms
that have been filled out for this highway slope. This slope only has one form; many have none. If you would like to
see the full detail of the hazard rating form, click on the blue link that is the ID of the form (193 for this road cut). This
will bring up a printable form.
The box to the right of this is the “Historic Data” box. This will be covered in the “Slope History” section of this
manual.
The lowest box on this page is the “Mitigation Cost Estimates” box. How to use this box will be covered here, and how
it works will be covered in later sections of this manual.
Figure 14 (No cost estimate)
27
When you first come to the page you will be presented with the “Mitigation Cost Estimates” window (see Figure 14).
The “Solution” drop-down box contains a list of the current mitigation methods in the database. When you select your
preferred method from this box, you will either be presented with additional quantity needs or an estimated cost (Figure
15).
Figure 15 (Slope scaling cost)
If you select “Slope Scaling,” you will be presented with a cost based on the surface area of the slope and a cost matrix
(to be covered later). If you select one of the options requiring additional information, you will be prompted for the
information, and then you will need to click on the “Calculate” link to get a value based on those numbers (refer to
Figure 16).
Figure 16 (Rock dowels cost)
28
Rating Forms
The next item down in the main menu allows you to enter
slope sites and view and edit the hazard rating forms that
already completed or are still completing.
new
you have
Hazard Rating Form: Form Management is first on the menu, but we will start with the “On-line
Form” menu option, because if we don’t fill in a form first, then we can’t manage it.
The “On-line Form” option is made up of only one main page that allows you to enter all of the data,
upload the pictures, and calculate the hazard totals (Figure 17).
Figure 17 (On-line hazard rating form)
29
The form is fairly self-explanatory. Some of the fields start out blank because they are filled in by
the selection in another box. For instance, the “Routes” drop-down box starts blank, but then fills in
when a district is selected with the routes that are in that district. You will also notice that the user
name and date are filled in automatically, but you are able to change them if you like. If you change
the user name to a name that is not in the database, you will get an error. Continuing across the top
you will see a “Units” drop-down box. You can change this at any point and it will convert all of the
values that you have already selected. When the form is submitted, the units will be converted back
to English.
Additional options include the “Add Pictures” and “Add Geological Data” buttons near the bottom.
These allow you to attach optional data to the form to be kept with the form during and after
submission (Figures 18-19).
Figure 18 (Picture attaching form)
As you can see from Figure 18, you can add up to three pictures to each hazard rating form. To add
a picture, click on the “Browse…” button, this will present you with a file selection dialog. In this,
select the file from its location on your local computer and press the “Open” button. This will fill in
the text box to the left of the “Browse…” button. Repeat this process for additional pictures as
desired. Then, add a brief description for each of the pictures you are attaching. Last, click the
“Save to Server” button to upload the picture files to the server and return to the main form.
30
Figure 19
(Geologic Data entry form)
The “Add Geological Information to Form” window is fairly straightforward. Fill in the data that
you have, and then click the “Save To Form” button. This will add the data to the hazard rating
form and close the window. If you then click on the “Add Geological Data” button again, you will
find your data still intact and ready to edit if necessary.
The last thing you will want to do
with
the On-line Form is submit or save
it.
Both of these will place your form
into
Figure 20 (On-line form buttons)
the Form Manager (covered in the
next
section) for later editing or viewing. You will need to have all of the mandatory fields filled in to
submit the form to the server but may save the form at any point. Saving the form will also put the
form on the server, so that you can access it from other computers. Do not submit the form to the
server until you have carefully checked all the fields; once a form is submitted, it becomes a
permanent record on the server and can only be edited by trained IS personnel.
31
Severity Rating Form: The last menu item in the “Rating Forms” menu takes you to page that
allow you to add a slope without a full hazard rating. This page should only be used if data for a full
hazard rating is not available.
Figure 21 (Severity Rating Form)
This page requires little explanation beyond what is already on the page. The only optional fields
are “Segment Code”, “GPS Data – Longitude” and “GPS Data – Latitude”, the rest are required and
the page will not let you submit to the server until they have data.
You may change the “Rated by” and “Date” fields, but it is recommended that you leave them as
they are when you come to the form.
Once you have successfully submitted this for to the server, the site will be available in the location
driven search for any user on the system to access and view.
32
Form Management: The first item on our list is the Form Manager, which will allow us to manage
the hazard rating forms that we have in progress or have finished (Figure 22).
Figure 22 (Form Management)
The Form Management page shown here is for a user that has four hazard rating forms, two of them
submitted to the database. Once the hazard rating form is submitted, a new highway slope site is
added to the server and gives everyone the ability to search on any of the specifics of that slope site.
To put a hazard rating form into your list, go to the on-line hazard rating form and click the save
button near the bottom. This will save the form and bring you to this page.
To delete a submitted or an uncompleted hazard rating form, click on the trash can icon
shown on the left. There is no “undo” for this delete. If the hazard rating form has
already been submitted, you are only deleting it from your Form Manager, but it still
remains in the server database. If you delete a form that has not been submitted, it is gone forever.
The next image over in each row is the View/Edit icon. Clicking on this will produce one
of two responses. If the form has been submitted, you will view a printable (but not
editable) version of the hazard rating form. If the hazard rating form has not been
submitted yet, you will be taken back to the on-line hazard rating form page that will show all of the
fields you previously filled in.
33
Slope History
As we move down the main menu we next come to
Slope History section. While this section of the
HiSIMS web application is generally entered via the
Data Page, you can also get to the page directly from
main menu.
the
Slope
the
Figure 23 (Blank Slope History page)
If you use the main menu to navigate to the Slope History page, then you will see something like the
page shown in Figure 23 with none of the values filled in except for the date. This is because you
have not selected a slope to attach the historic data to. What you will need to do in this case is select
the route and milepost information for the slope to which you would like the data attached. If, when
you enter these values, they don’t match up with any of the highway slopes in the database, you will
be taken to the On-line form so that you may add the slope site. If the slope site already has been
rated, then the historic data will be added to that database item.
The more conventional way for you to enter
data on a slope site would be to find the site
are looking for with one of the two search
go to the Slope Data page, and click on the
new data” link in the “Historic Data” box to
right (Figure 24).
historic
that you
methods,
“add
the lower
Figure 24 (Add historic data)
34
Figure 25 (Add historic data to existing site)
When you click on the “add new data” link for the slope site we were looking at earlier, you will be
presented with the screen shown in Figure 25. Here, the route and milepost data are already filled
in. The data is still editable if you need to add historic data retroactively. Once you have the date
set, type in the main text box any descriptive data that you deem useful. Once you have written the
text in the box that you want attached to the site with the date shown above, press the “Add to
Slope” button.
Figure 26 (Historic data link)
This will send the data to the database and add it to the
site. Then, you will be taken back to the Slope Data
page. You will now notice that in the Historic Data box
that was previously blank, the data that you had in the
last screen will be showing up as a link (Figures 26-27).
Clicking on the link will make the data show up in the
text box to the right of the link. You can add as many
pieces of historic data to a roadside slope site as you
think would be useful.
.
Figure 27 (Historic data)
35
Cost Matrix
The next menu option, Cost Matrix, is connected to
the last
one, Mitigation Methods. This option, along with
Mitigation Methods, is only for super users of the HiSIMS application and will show up in the menu
based on log-on privileges. Users that would like to edit and view the Cost Matrix and the
Mitigation Methods sections of the HiSIMS web application should contact their system
administrator.
Figure 28 (Cost Matrix main page)
The items in the list on the left are all of the current mitigation methods available in the database.
These are added, edited, and removed using the Mitigation Methods section. The second column
(Cost per unit) is a user-entry field that is exactly what it sounds like. The third is the unit type with
which the cost is associated (such as lineal feet, square feet, cubic yards, and crew hours). Your
choice here will obviously have a profound effect on the cost of slope mitigation.
The next column is only for “Unit types” that need another user quantity to do the calculation. For
instance, “square feet” is straightforward and is based exclusively on the surface area of the slope.
In contrast, a lineal foot unit type on gabions would require the user to enter the number of rows for
36
an accurate calculation. If the user needs to provide more data, then the system will ask the
appropriate question. This question goes into the text box in this column. The other option for a
question is to have an “and” in the text of the question. The user will then be presented with two
text boxes. If you don’t need the user to enter two pieces of information, then don’t use an “and” in
your question.
The next column is the comments column, which can contain any information that you consider
useful or would like to save. The last column is a button to “Edit Formula” for the costing. At
present, this is just a placeholder for when that functionality is added.
Once you have made the changes that you want to save, simply scroll down to the bottom of the
page and click the “Save Changes” button. There is no “undo,” so be careful you know what you are
doing before making changes on this page.
37
Mitigation Methods
Finally, we come to the Mitigation Methods menu
item and
main page. This menu item, like the Cost Matrix
menu, is
only available for super users and will not even show up on the standard users menu. This section
(Figure 29) allows you to add, edit, and remove methods that are then given cost data in the Cost
Matrix section.
Figure 29 (Mitigation Methods main page)
To add a new mitigation method, scroll to the end of the page and fill in the name and description
fields. Then click the “Add New” button. This will add the method, and it will then show up on the
Cost Matrix page.
To edit an existing method, make a change to the text in the appropriate fields and click the “Save
Changes” button to update the database.
To delete a mitigation method, click on the “Delete” button to the far right of the method name and
description.
38
Credits
Project Lead
Programmer
ITD Contact
Hazard Data
Database Contact
Web Server Contact
Dr. Stan Miller, NIATT, University of Idaho
Andrew Crapuchettes, Crapuchettes Consulting
Millie Miles, ITD Boise
Shari Silverman, University of Idaho
Chuck Dimick, ITD Boise
James Taylor, ITD Boise
39
Appendix 2
HiSIMS SYSTEM ADMINISTRATOR GUIDE
This document provides information needed to install and maintain the HiSIMS (Highway Slope Instability Management
System) web application. The development work was done by Andrew Crapuchettes at the direction of NIATT (National
Institute for Advanced Transportation Technology), ITD (Idaho Transportation Department), Dr. Stan Miller at the
University of Idaho. If you have any questions, please contact the author given below.
Document Author
Author Phone
Author e-mail
:
:
:
Andrew Crapuchettes
(208) 699-4292
[email protected]
Table of Contents
Page
Installation Instructions. . . . . . . . . . . . . . . . . . . . . . . . . . . . . . . . . . . . . . .
2
Database Information. . . . . . . . . . . . . . . . . . . . . . . . . . . . . . . . . . . . . . . . .
General Information . . . . . . . . . . . . . . . . . . . . . . . . . . . . . . . . . . . . . .
Flow and layout . . . . . . . . . . . . . . . . . . . . . . . . . . . . . . . . . . . . . . . . . .
3
3
4
Web Application Information . . . . . . . . . . . . . . . . . . . . . . . . . . . . . . . . .
General Information . . . . . . . . . . . . . . . . . . . . . . . . . . . . . . . . . . . . .
Flow and layout
.........................................
5
5
6
Screen Shots . . . . . . . . . . . . . . . . . . . . . . . . . . . . . . . . . . . . . . . . . . . . . . .
7
40
Installation Instructions
The HiSIMS web based application uses Microsoft SQL Server and Microsoft IIS (ASP) all running on a Microsoft
Windows server. Windows, IIS, and SQL Server will be assumed to be installed on the server. See the HiSIMS CD for
installation files.
HiSIMS web application install:
The web application part of the system is designed to be stand-alone for the most part. The prerequisites are listed above.
Once these are installed, follow the steps listed below:
•
•
•
•
•
Make a folder by the name of “HiSIMS” under the main wwwroot directory or under the virtual directory in which
the web application will reside. This was setup this way to keep things separate in the event that the system was
installed on the same virtual as another web applications.
Copy everything from the “HiSIMS” folder on the HiSIMS CD into this new folder that you have created.
Right click on the newly copied folders and turn off “Read-only”. When asked, propagate to all files and subdirectories with the non-read-only status.
If this application will have its own DNS address, then resolve the address to this directory.
If not, just make a link from the main site to the HiSIMS directory. IIS should find the default.asp page and you are
ready to go.
The HiSIMS web application is designed to be part of an internal web system, and not out on the Internet. The data is not
passed securely, and the login needs to be taken care of by another part of the intranet.
41
Database Information
The database was originally designed by Shari Silverman (University of Idaho) in Microsoft Access and was adapted to
Microsoft SQL Server for this web application.
General Information
Not all of the tables that are present in the HiSIMS database are used in the web application, but contain legacy data
from the original Access database.
All tables in the database:
• tblAngle1
• tblAngle1Com
• tblAngle2
• tblAngle2Com
• tblCost
• tblCostUnitTypes
• tblEval
• tblFace2
• tblHazard
• tblHasEval2
• tblHistory
• tblHzNotes
• tblRoadcut
• tblRock
• tblSD1
• tblSD2
• tblSD3
• tblSD4
• tblSevEval2
• tblSoil
Tables used in web application:
• tblCost
• tblCostUnitTypes
• tblEval
• tblHazard
• tblHistory
• tblRoadcut
The tables that are used are listed with content and use:
• tblCost – contains the list of mitigation methods and their associated cost and descriptions. This information is
used to calculate the repair cost of a given slope. Users (with the appropriate permissions) can edit the table via
the Mitigation Method and Cost Matrix sections of the web application.
• tblCostUnitTypes – is used by tblCost to keep track of the type of cost units being used. This table can only be
edited by a database administrator.
• tblEval – is a list of the users that can access the web application and add hazard ratings to road cuts.
• tblHazard – is the core of the web application holding all of the hazard rating information and scores. Data is
inserted and retrieved from this table throughout the system.
• tblHistory – contains comments about any of the slopes with a data attached to reference what has happened to
the slope without filling in a hazard rating form every time work is done on the slope.
42
•
tblRoadcut – is the reference for each slope. Each slope is found in this table with a RCID unique identification
that is used throughout the system. Not all slopes have a hazard rating and are thus not in tblHarzard, but all
slopes are in tblRoadcut.
Flow and Layout
A picture best demonstrates this.
Web Application Information
The web application was designed using ASP, JavaScript, HTML, Cookies, and XML. All of the interfacing to the
database was done in ASP.
General Information
If the database changes to any other database provider other than Microsoft SQL Server, the
DBConnection.asp page will need to be modified to connect to the new database source. All other
interfacing to the database uses SQL (Standard Query Language) and should work with most major
databases with only minor modification.
Menu System – The menu is stored in a text file called menu.txt and is displayed using ASP to
source the data, and JavaScript and CSS to make it work on the client side.
43
Location Driven Search – uses a map system partially provided by Castle Rock Consultants, Inc. The map uses ASP
and DIV overlays to place the roads and other map features. JavaScript makes each of the districts highlight on mouseover. Clicking on a district takes you back to the same page but with an argument in the query string of the district
number. The page then displays a zoomed-in map of the district with a list of the roads in that district on the right.
Above this list on the right is a number of options to search for a slope by route and MP. Clicking on a slope will take
the user to the slope information page (covered below).
Characteristic Driven Search – allows the user to search for slopes by hazard rating, type, district, ADT (Average
Daily Traffic) and/or AVR (Average Vehicle Risk). The searches can be saved for each user and the data is saved to the
user’s computer in the form of a cookie by JavaScript. When the user presses the search button, JavaScript makes a
SQL query string from the data that the user entered and passes that on to the Search Results page.
Slope Information Page – is obtained by several paths. When a user specifies either of the search methods above and
selects an individual slope, this page is displayed. In this page the user can view the hazard rating form, add a history
based comment or do a cost estimate for the slope (only if there is a hazard rating form for the slope).
Form Management Page –is unique for each user and shows the hazard rating forms that the user has submitted or just
saved before completion. The data here is saved in an XML file on the server. If the user selects to view a submitted
slope, a printable version of the form is displayed. If the user selects an un-submitted form, the most recent hazard
rating form will be displayed (with all of the data saved from the last time it was edited). The user also can delete a form
that is un-submitted, or remove a form from this page that has been submitted.
Hazard Form Page – is where the user enters all of the hazard rating information for a slope. ASP fills some of the
option boxes with data. JavaScript changes the values in other option boxes based on what the user selects. The form
can be saved before completion, or submitted upon completion.
Slope History Page – is primarily entered from the Slope Information Page, but can also be entered via the main menu.
In this page the user can enter a comment about a slope with a date attached for reference later. The date is
automatically set on page entry, but the user has the option of changing the date to enter back-log information.
Edit Cost Matrix and Mitigation Methods Pages – work together to allow a user with the appropriate permissions to
add, edit, and delete mitigation methods and their cost. These pages are pure ASP referencing SQL.
There are obviously other pages in the web application, but these are the main pages with which the user will interface.
Flow and Layout
Another picture:
Main page
Login Page
Mitigation
Methods
Form
Management
Search Pages
New
Slope Info
- Cost calculations
- History
- Hazard Score
General Info
Existing
Cost Matrix
XML
Hazard Form
44
Slope History
Screen Shots
These may change based on user input once the site goes live.
Location Driven Search:
45
Characteristic Driven Search:
Form Management:
46
Hazard Form:
Printable Form (The format may be changed in later upgrades):
47
48
Slope Info Page:
Slope History Page:
49
Mitigation Methods Page:
Cost Matrix Page:
50