1
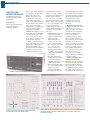
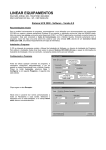
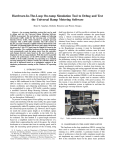
™
Moving Technology
Volume 24 Winter 2001 Newsletter
THE BRIDGE SOFTWARE INSTITUTE INTRODUCES
FB-PIER
Photo courtesy Florida Dept. of Transportation
MORE ON
TRANSYT-7F™
CONTROLLER
INTERFACE
DEVICE
HELPS IMPROVE
TRAFFIC SIGNAL
TIMING P. 2
Release 9.3 was the first in a series of
revisions designed to make
TRANSYT-7F user-friendly.
The new TRANSYT-7F input
data editor introduced within release
9.3 is intended to provide users with
a more efficient and intuitive
mechanism for coding input data.
Until now, the featured input data
editor for TRANSYT-7F has been
McT7F, which is designed to display
and edit “record types”. The
traditional record type format, which
can be seen within most TRANSYT7F input (*.TIN) data files, is not
well understood by some users.
TRANSYT-7F input data can now
be coded directly into software
screens designed to mimic the
popular Highway Capacity Software
(HCS) input data screens.
Since TRANSYT-7F can model
complex intersections, a simple
keypress loads input data for
additional traffic movements into the
same screen, 12 at a time. Other
input data screen features include:
• Link numbers automatically
listed on each screen
• Context-sensitive F1 help for
each field
• Field disabling for non-existent
movements
• Automatic balancing of the linkto-link traffic flows
• Automated coding of link
lengths*
• Intersection names on each
screen*
• User-defined behavior of the
Enter key (save data, or move to
next field)*
* -- available in release 9.4
In addition to the new input data
screens, TRANSYT-7F input and
McTrans
Department of Civil and
Coastal Engineering
PO Box 116585
Gainesville FL 32611-6585
(352) 392-0378
Toll Free 1-800-226-1013
Fax (352) 392-6629
Email [email protected]
http://mctrans.ce.ufl.edu/
UNIVERSITY OF
FLORIDA
McByte
continues p. 3
New Products
4
Updated Products
6
Did you know?
7
Advertising Directory
8
Products Listing
22
Conference & Training Calendar
32
McTrans Winter 2001
2
CONTROLLER
INTERFACE DEVICE
New Hardware and Software
Product Helps Improve Traffic
Signal Timing
By Michael Kyte
Director, National Institute for
Advanced Transportation
Technology (NIATT)
Many complex factors are involved
in designing a good traffic signal
timing plan, such as traffic
demand, street geometry, and
spacing between traffic signals.
Once a traffic engineer has
designed a good signal timing plan,
the plan should be tested and finetuned using an actual traffic
controller before it is implemented
in the field. Traffic simulation
programs such as FHWA’s
CORSIM allow engineers to test a
signal timing plan, but CORSIM’s
controller logic is “generic” and
does not incorporate all of the
features that are available on today’s
advanced traffic controllers.
NIATT’s Controller Interface
Device (CID) bridges this gap. The
CID provides a real-time link
between the CORSIM traffic
simulation model and a NEMA or
170 traffic controller, in what is
called real-time hardware-in-the-
1-NIATT’s Controller Interface Device
2-CID’s Intersection Data Screen, where user enters
movements, phases and CID ID number.
loop simulation. In this type of
simulation, the traffic controller
component of the simulation_the
internal controller emulation
logic_is replaced by a real traffic
signal controller. Both the model
and the controller run in real time,
i.e. one second of simulation takes
one second of actual time.
When an engineer wants to test
a timing plan with hardware-in-theloop simulation, the following
events occur:
1. CORSIM generates detector
actuations by modeling
simulated vehicles crossing
simulated detectors.
2. The simulated detector
actuations are sent to the
actual controller hardware.
3. The controller reacts to them
as it would react to real
detector actuations, by
updating phase indications
according to the phasing and
timing plan programmed into
the controller.
4. The phase indications are
subsequently read back from
the controller hardware to
CORSIM, and assigned to the
simulated traffic signals.
5. The simulated vehicles then
react to the simulated traffic
signals by stopping or
departing as appropriate.
It is the CID that makes this
real-time exchange of data possible.
The CID also allows the engineer
to fine-tune the timing plan in the
office rather than out in the field,
since field-testing is a timeconsuming process that can
potentially cause severe traffic
disruptions.
Suitcase Tester Function
In addition, the CID can be used as
a “suitcase tester,” to test and
evaluate the operation of a traffic
controller before it is installed in
the field. A traditional suitcase
tester is a suitcase-like box
containing switches that, when
linked to a traffic controller, can
activate functions on the controller
and monitor outputs from the
controller. A standard suitcase tester
does offer a controlled environment
for testing a controller, but it is a
time-consuming and inefficient
process. The CID’s suitcase tester
function provides a more
convenient way to test the most
widely used functions of NEMA or
170 traffic controllers.
Government, Education,
Industry Collaboration
The CID is the result of a unique
and highly successful collaboration
between government, education,
and private industry. In the mid90’s, FHWA developed a prototype
CID, which worked well but was
not suitable for mass production. In
3-CID’s Suitcase Tester Emulator screen. This is a function of the CID software
that allows traffic engineers to test whether or not a traffic controller is
functioning properly.
McTrans Winter 2001
3
TRANSYT-7F continued p. 1
1998, FHWA asked NIATT to
develop a next-generation version
of the CID, which would be
suitable for manufacture by private
industry.
NIATT assembled a
multidisciplinary team of civil,
mechanical, computer science, and
electrical engineering students to
build the hardware and software
applications, with university
researchers, and government and
private industry representatives
serving as advisers to ensure the
real-world applicability of the
finished product. Within two
years, the team had developed a
newly engineered CID, meeting
real-world manufacturing specs,
ready for production and sale to
traffic engineers worldwide. The
CID II and its software have been
licensed to McCain Traffic Supply,
of Vista, CA, and McCain expects
to have a commercial CID ready
for sale in first-quarter 2002.
The CID has been well received
by both government and industry
professionals. According to Raj
Ghaman, Research Engineer for
FHWA, “Traffic control hardware
really hasn’t changed much since
the 60s, so the invention and
reengineering of the CID is a
significant advance. We are very
proud to be partners in this
project,” he said. “For quite a small
investment, the CID can make
major improvements in the way we
manage our transportation
systems.”
For more information about the
CID, contact:
Peter Kohl
McCain Traffic Supply
2575 Pioneer Ave.
Vista, Ca 92083
760/734-5023
[email protected]
www.mccaintraffic.com
Michael Kyte
Director, NIATT
University of Idaho
Moscow, ID 83844-0900
208/885-6002
[email protected]
www.its.uidaho.edu/niatt
• Nine available map background colors
to choose from
• Drag and drop nodes on the map
• Right-click on nodes to edit the data for
that node (from the HCS-style screens)
• Progression routes drawn with bold
lines for emphasis
• Link connections redrawn automatically
after every node drag-and-drop
• Select and move entire groups of nodes
• "Undo" feature for canceling recent
changes to the map
• Superimpose link lengths, intersection
delay, and level of service on the map
• Redefine the X and Y origin of the map
• Dynamic scrolling of the map
output data can now be viewed on
the screen in the form of a twodimensional link-node diagram.
The map view does not affect results
from the model. However it may
allow the user to better understand
the data entry process, which could
indirectly improve the results from
the model, and may assist in
explaining the model to unfamiliar
parties. In addition, the ability to
superimpose information on the
map could be useful for verification
and validation of the model.
Other map view features
include:
• User-supplied bitmap
backgrounds optional
The Bridge Software
Institute Introduces
FB-Pier
The FB-Pier program is a
comprehensive analysis program to
aid in the design of bridge pier
structures supported by pile group
foundations in soil. The program
couples both linear and nonlinear
structural finite element analysis
capabilities with nonlinear static
soil models for axial, lateral, and
torsional behavior to provide a
robust system of analysis for
coupled bridge pier and foundation
systems. FB-Pier performs the
generation of the finite element
model internally given the
geometric definition of the
structure and foundation as
inputted graphically by the user.
This allows the engineer to work
directly with the design parameters
and lessens the bookkeeping
necessary to create and interpret the
model. The model is also drawn to
scale with an emphasis on 3D
visualization and easy manipulation
so that engineer can make a quick
assessment about the size and shape
of the model.
The FB-Pier program combines
the proven stability of the Florida
Pier analytical engine with an
advanced graphical interface to
simplify the modeling process. In
addition to the new Windows
interface, many new analysis
features have been added to the
program including the modeling of
pile sets (groups of similar piles),
automatic self-weight generation, a
database of cross-sections, and a
pushover analysis. New problem
types have also been added to
model pile groups, pile bents,
retaining walls, sound walls, and
high mast lighting.
The program offers great
flexibility in terms of the modeling
parameters. The user can use
default stress-strain curves for
concrete and steel or specify their
own stress-strain behavior. The user
can also specify user-defined loaddisplacement soil curves (p-y, t-z,
and t-q) and p-y group reduction
multipliers. Two additional
modeling elements are also
available to supplement the model:
springs can be added to model the
stiffness of the bridge
superstructure and additional beam
elements can be added to stiffen
parts of the model.
The FB-Pier program also offers
an in depth assessment of the
model results. Both uniaxial and
Continue p.4
McTrans Winter 2001
4
The TimeLock ActiveX control
is a simple, effective way for Visual
Basic programmers to secure their
work with a limited trial period.
The control has the advantage of
permitting e-commerce by entering
an UNLOCK CODE, after which
the secured program will run
without restrictions.
The Control performss several
checks to see if the user of the
secured program has tried to
bypass the lock, and provides a
customizable message if that
condition is found. It is simple and
easy to use, and includes a well
documented user manual and
sample.
Features:
• Writes encrypted entries to the
Windows Registry. The
location of the entries is
determined by the user
(program author)
• Writes a "marker entry"
separate from normal program
entries, which is used to defeat
uninstall/reinstall
• Works on "days remaining"
rather than Install Date. Days
Remaining is an encrypted
value and not human-readable.
• Performs several "Tamper tests"
to check if the registry entries
have been found and changed
• Carries customizable messages
to display to the user during
normal use during the trial
period and when tampering
has been discovered
• The ActiveX control is included
on a sample form with the few
lines of code required to make
the program functional. Just
fill in the name of the form
that is started after clearing the
TimeLock
• Allows the placement of
background pictures and
custom messages on the form
containing the TimeLock
• Works with all windows
platforms
• Keeps you out of dangerous
areas of the Registry
Allows uninstall/reinstall within
the specified trial period.
TimeLock ActiveX Control,
version 1.0 (#TIMELOK.W95) is
available at LOS 6 for $70.
LayerTrans is a layer utility
that works in AutoCAD to
translate the layer names and
maintain company drafting
standards for layer names, colors,
line types and block insertion
layers.
Written by an engineer with a
real production environment in
mind, the LayerTrans can easily be
the most useful one in the office.
It's easy for a cad manager to
implement company standards and
perform clean-up that is necessary.
The program is designed to
maintain consistent drafting
standards throughout a company.
Users of this program
consistently save thousands of
dollars in man hours from
automating the tedious job of
manually translating the layer
names of the drawings they
import.
LayerTrans lets you:
• Translate layers of one
company's drawing to the
layer names that are used by
your company
• Save the translation
dictionary for reuse, so when
they send the drawing again,
translation is even easier!
• Combine multiple layers onto
one new layer
• Maintain layer names, colors,
and line types according to
your company standard
• Quickly and easily translate
Microstation layers
Thoroughly tested and proven
for it's reliability, it performs
flawlessly in most Autocad
environments.
The program is written in VBA
and runs as a macro, using some of
the newest and best programming
technology now available.
LayerTrans version 1.8
(#LAYRTNS.W95) is available at
LOS 6 for $165.
KwikSoft‘ NBI Database 2000
is a powerful, simple to use
Windows‘ 98, ME, or NT
application which gives the user
quick, easy access to all of the
National Bridge Inventory data
collected annually by the Federal
Highway Administration. Use of
the program enables users to review
and summarize bridge data for the
State of choice. The user may locate
bridges by Bridge Number, County,
Route and Milepost, or Feature
Intersected, and the program
displays the location on an onscreen map. After locating the
desired structure, the user has
access to all of the 100+ items of
information collected through NBI
inspections conducted by the States
and various Federal agencies. Data
collected for each structure in the
database include inventory and
operating ratings, route, milepost,
feature intersected, sufficiency
rating, material and design type,
coordinates, functional class, year
built, year reconstructed, design
load, ADT, functional
classification, type of service, bridge
ratings, scour ratings, bridge and
roadway improvement costs, and
much, much more.
A separate program is available
for each State in the Nation, and
taken together the data represents
the entirety of information on the
614,000+ bridges which constitute
the National Bridge Inventory. The
program de-compiles the
Edit/Extract text file collected
annually by FHWA from the States
and populates the underlying
Access‘ NBI database. (Access‘ is
not required on the host computer
to run the application.) A .pdf file
containing Federal Report No.
FHWA PD-96-001, “Recording
and Coding Guide for the
Structure Inventory and Appraisal
of the Nation’s Bridges”, is included
to assist in interpreting the data.
The program is pre-loaded with
data from the Year 2000 submittal,
however the database may be
updated with a current file
(available from the State DOT) at
any time by use of a simple update
module included with the program.
An optional module provides the
means to easily manage digital
images. The underlying Access‘
FB-Pier continued p.3
biaxial load moment interaction
diagrams are provided to identify
potential failure conditions.
Additionally, the displacement and
stress results are presented for the
deformed model to better
understand the model behavior
under the applied loading. Finally,
the forces in the structure and
foundation can be plotted along
their member length and the
maximum forces for each load case
are automatically provided.
Many new features are under
development for upcoming
versions, most notably LRFD load
combinations, preloading, applied
displacement load cases,
generalized cross-sections, and
multiple soil sets (for modeling
scour and other changes in the soil
strata). In inclusion of new features
is very much dependent on
industry needs.
The program is currently
available on a stand-alone or
floating network license. Two types
of licensing allow for an outright
purchase of the program (perpetual
license) or an annual lease. Both
include phone, email, and Internet
technical support for the first year
with an option to extend the
support for additional years.
Pricing information and a 30-day
demo version of the program can
be obtained at http://bsiweb.ce.ufl.edu. The program runs
on all Windows platforms.
The BSI is headquartered at the
University of Florida in Gainesville,
Florida. It was established in
January 2000 to oversee the
development of bridge related
software products at UF. The goals
of the BSI include enhancement,
maintenance, and dissemination of
bridge software to address the
increasing demands on the
transportation industry. The BSI is
also dedicated to providing
technical assistance with the
software under the Institute’s
auspices.
McTrans Winter 2001
5
database may be used to perform
detailed analysis on the bridge
inventory, and the results may be
easily plotted by use of many
commercially available mapping
programs including MapPoint‘,
Expedia‘, Streets and Trips‘, and
ArcView‘ GIS.
KwikSoft‘ NBI Database 2000 is
available at LOS 7 for $4995.
(Specify by State).
PathPlanner ROADS merges
the high performance from the
PathPlanner family of products
with the powerful tools of your
CAD platform, creating a precise,
user friendly and open interface for
your daily design challenges.
PathPlanner ROADS is a CAD
based, inexpensive, productive tool
for evaluation and design of vehicle
maneuvering in site developments,
terminals, roadways, traffic circles,
intersections, loading bays or
whenever there is a need to
accurately evaluate space
requirements for vehicles.
Features.
User interface
Object editor:
• Design your own objects;
using an object template for
Vehicles, Trailers or SemiTrailers and PathPlanner
ROADS will simulate their
space requirements.
• Add Vehicle limitations such
as wheel configuration
including maximum steering
wheel angles, max steering
rate.
• Define your own coupling
and tracking points.
design, your CAD platform
determines your limits
• Insert "line up" positions and
PathPlanner ROADS will
generate your path and space
requirements.
• Identify obstructions and
PathPlanner ROADS
generates a clear passage
requirement.
• Allows User defined tracking
points on or off the Vehicle.
• User defined speed setting.
Animated simulations.
• Has extensive User defined
settings of simulation
parameters.
• Displays path, tires, vehicle
corners or any user defined
point on -or offset from- the
vehicle.
• Tracks a path or an offset line.
• Allows User to define where
to display the object in the
animation result.
• Reflects the result of actual
defined Vehicle limitations.
• Performs sophisticated and
precise forward or reverse
operations including multiple
vehicle configurations.
Presentation support
Allow re-simulation with same or
different objects as well as with
same or new parameters
CAD Platform
PathPlanner ROADS supports
AutoCAD 14/2000/2000i as well
as MicroStation 95/SE/J.
PathPlanner ROADS version
1.0 (#PPROADS.W95) by Simtra
AeroTech AB is available from
McTrans at LOS 6 for $995.
GPS2CAD GPS Receivers can
now output their database file into
an AutoCAD program. GPS2CAD
is a new program that allows you to
connect your hand held GPS
Receiver to your computer,
download your waypoints, and plot
them in AutoCAD. Modestly
priced, this new program is a
tremendous timesaver and
convenience! It even lets you
relocate your plot with the first
point of your traverse at a specified
coordinate. Works on Garmin 12
and AutoCAD 14, 2000 and 200i
Features of Version 2 include:
• Editing capability for the
points
• Import/Export of points to
text files
• Upload capability of the
points to the GPS Receiver
• Ability to plot the points in
AutoCAD, move them to new
locations, and send them back
to the GPS receiver
• Extensive Users Manual
• Sample files
• Troubleshooting tools
Program operation is simple. It
requires that you connect your
GPS Receiver to your computers
serial port with a connecting cable
available from Garmin.
GPS2CAD senses this
connection and waits for your click
to download the waypoint
database. Once received, it converts
the latitude/longitude points to
X,Y,Z points with the descriptors
contained in the waypoint file. It
™
Moving Technology
It’s on Us!
Call McTrans Toll Free:
1-800-226-1013
• Tech Assistance
• Orders
• Product Seminar
Information
Drafting:
• Edits, stores and retrieves
unlimited variations of your
Update Watch
displays all the points as both GPS
Receiver points and AutoCAD
points, and lets you review them
before plotting. You can choose to
relocate point No. 1 to a given
coordinate, effectively letting you
relocate the entire plot in
AutoCAD. You can also make
adjustments to the layers, line
types, and colors to be used, and
whether to plot the points,
connecting lines, descriptors..
Once all these selections are
made, simply click one button, and
the plotted points appear in
AutoCAD! This operation can be
repeated as necessary, such as
relocating the entire plot to a given
location if necessary.
The key feature of this program
is that it is a simple LOW COST
alternative to the very expensive
survey software now on the market.
It lets you turn your GPS Receiver
into a usable tool in the office by
allowing it to be used for plotting
your field activity in AutoCAD.
GSP2CAD version 2.0
(#GPS2CAD.W95) is available at
LOS 6 for $245.
Package
Version
Status
Target
Distribution
TSIS
HCS2000
TRANSYT-7F
IDAS
TRANSYT-7F
5.0
4.1b
9.3
2.2
9.4
Complete
Testing
Complete
Complete
Testing
Available
Winter
Available
Available
Winter
Registered users may upgrade
Patch Download
Patch Download
Sent to Registered users
Sent to Registered users
McTrans Winter 2001
6
VISSIM Version 3.60 The latest
update of VISSIM, the leader in
traffic and transit simulation
software, is here! Unwrap this new
version and discover exciting tools
that can help you analyze
transportation systems better than
before. Because you have either
purchased VISSIM within the past
year or have a current maintenance
agreement you automatically
receive this program update. Your
maintenance agreement also
entitles you to four hours of
technical support per year from
ITC's highly trained staff who
specialize in VISSIM. Our tech
support staff can even provide
guidance in scoping and cost
estimating for simulation projects.
3.60's New Features:
• Node Evaluation –Now able to
quickly collect data for
intersections.
• Z-Coordinate for 3-D
Networks - Allows users to
model overpasses andbridges in
3D.
• Improved Priority Rule Coding
• Mixed-Flow Bicycle Model Autos can now pass bicycles in
the same lane.
• Freeway Weaving and Merging
Behavior- Now more fluid and
dynamic.
• Enhanced Toll Plaza Modeling
- Mixed lane modeling is now
possible (e.g. exact change and
toll tags in same lane).
• Expanded Dynamic Traffic
Assignment –Notifies user
when convergence occurs and
provides dynamic assignment
path evaluations.
• 3D Modeling has been
improved for laptops and
requires less memory.
• And Much More!
VISSIM Version 3.60
(#VISSIML3) by Innovative
Transportation Concepts is
available at LOS 7. See product list
or call McTrans for pricing of
progressive levels of VISSIM
capability.
All TEAPAC programs now
include the new TEAPAC Version
5 Interface which has been
developed for all TEAPAC
programs. This includes the
SIGNAL2000, NOSTOP,
PREPASSR, PRETRANSYT,
PRENETSIM, SITE,
WARRANTS2000, TURNS, TED
and TUTOR programs distributed
by McTrans. The Version 5
interface has many new and
enhanced features for ease of use
and efficiency.
The most significant of these is a
new Tabular View for data input
and editing which displays a
maximum amount of data in a
dialog box using a table format so
that lots of data can be reviewed,
edited or input with a minimum
amount of mouse navigation. This
Tabular View compliments the two
other modes of data entry and
review already found in every
TEAPAC program: the Normal
View of the Visual Mode which
provides significant on-screen helps
and visual, graphic cues (but lacks
input efficiency), and the Manual
Mode which is highly efficient for
power users (but lacks helpful
cues). As with the Normal View,
customized Tabular View dialogs
can be generated from the Manual
Mode on the fly, adding
unmatched efficiency to the data
entry and review process.
A partial list of some of the
features offered by the Version 5
interface includes:
• the tabular view for dense,
tabular dialogs to view and
change data,
• a recent files dialog with an
option to include recent files in
the File menu,
• automatic Share and writeprotect of files written by
another Ver 5 program,
• option to log significant results
of computations in a text file,
• complete, built-in printer setup
support and management,
• popup tool-tip help under the
mouse cursor, plus status-line
help for screen cursor,
• direct linkage to other
TEAPAC programs, including
launching script files,
• registration of TEAPAC file
type allows double-click to
launch,
• WinTEAPAC Menu permits
naming a data file or script file
to use,
• a 'Getting Started' button for
first-time users is easily
customizable,
• enhanced look for all dialogs
using depressed input fields,
• direct editing of script (control)
files and small data files,
• direct editing and conversion of
text files to TEAPAC file
format,
• history of manual mode
commands for repeated
command sequences.
Educational versions are
available for half-price and
demonstration versions are
available free as downloads from
the Strong Concepts and McTrans
web pages. The Strong Concepts
web page also lists all of the
enhancements in detail which are
included in the Version 5 update.
Registered licensees of earlier
versions of TEAPAC programs may
update at a reduced fee directly
from Strong Concepts.
IDAS Version 2.2 ITS
Deployment Analysis System
(IDAS), Version 2.2, represents a
major step forward in the
performance and user friendliness
of the software. The basic analysis
procedures should remain familiar
to current users as this update
includes limited changes to the
user processes and interfaces.
IDAS Version 2.2 (#IDAS) is
available at LOS 1 for $795.
Version 2.2 will be automatically
sent to all registered users.
McTrans Winter 2001
7
DID YOU
CORSIM
HCS
When simulating oversaturated
conditions, CORSIM users
often notice that queue
spillback from the major street
will effectively block all traffic
from moving on the minor
street. The simulation results
become overly pessimistic
because in the real world,
cooperative drivers will often
allow minor street vehicles to
pass through (or join) the
oversaturated queue. CORSIM
contains a default value for the
probability of joining spillback.
When the simulation results
become overly pessimistic due
to queue spillback, the user can
calibrate the probability of
joining spillback in order to
achieve more realistic results.
The probability of joining
spillback may be coded within
the TRAFED graphical input
editor contained within TSIS 5,
or may be coded "manually" on
record type 141.
Beginning with version 4.32, the
delay and travel time per vehicle
values (from the cumulative
summary report) account for
vehicles that remain on the link
when the time period ends.
When oversaturated conditions
prevail, this should allow for
more accurate delay and travel
time results.
By default, CORSIM reports or
output files contain a
corresponding input data
report, or input "echo".
However, the input data file
may be modified so as to
suppress the input echo. A
request to suppress the input
echo may be specified within
the TRAFED graphical input
editor, or may be coded
manually on record type 210.
Version 4.1a contains a new
TwoLane module implementing
the procedures from Highway
Capacity Manual (HCM2000)
Chapter 20 for Two-Lane
Highways. These
computational procedures had
remained unchanged
throughout the 1985, 1994,
and 1997 editions of the HCM.
However, the procedures have
now changed significantly as
prescribed in the HCM2000,
including increasing the base
capacity from 2,800 to 3,200
pcph in both directions and
adding a new directional
analysis with the capability to
analyze passing lanes.
Many computational procedures
from the Highway Capacity
Manual involve a "primary
measure of effectiveness" that is
used to determine an overall
level of service for the facility in
question. The procedures from
HCM2000 Chapter 20 on
Two-Lane Highways are unique
in that there are effectively two
primary measures of
effectiveness used to obtain
level of service for "Class I"
highways. These measures are
"percent time-spent-following"
and "average travel speed". In
order to achieve a specific level
of service, Class I highways
must meet both criteria by
having a sufficiently low
percent time-spent-following in
conjunction with a sufficiently
high average travel speed.
"Efficient mobility" is
considered paramount on
"Class I" two-lane highways,
where motorists expect to travel
at relatively high speeds.
Motorists do not necessarily
expect to travel at high speeds
on Class II highways. These
highways may function as
access routes to Class I facilities,
serve as scenic or recreational
routes, or pass through rugged
terrain. On these highways,
mobility is less critical, and level
of service is defined only in
terms of percent time-spentfollowing, without
consideration of average travel
speed.
KNOW?
TRANSYT-7F™
Release 9.4 introduces phasing
sequence optimization, using
the genetic algorithm. Phasing
sequence can be optimized on
both the major and minor
streets. During optimization,
TRANSYT-7F examines
virtually all feasible phasing
sequences including leading and
lagging left-turns with and
without overlap, lead-lag
phasing, and split phasing.
Relative to right-hand driving,
the program is designed to be
equally effective in optimizing
phasing sequences for networks
with left-hand driving (e.g.,
having leading or lagging rightturns). The user may allow full
optimization throughout the
network, but can also specify
restrictions on optimization at
any approach of any
intersection. On every
approach, the user may specify
whether they wish to allow
optimization, overlap phasing,
lead-lag phasing, leading
through movements, or the
"yellow trap".
TRANSYT-7F's computation of
uniform delay (d1) can be
confirmed through use of the
Spyglass utility program,
included within release 9.
Using Spyglass, the uniform
queue length from simulation
can be plotted within
spreadsheet software.
Subsequently, the uniform delay
value can be obtained by
computing the area under the
uniform queue profile. When
oversaturated conditions
prevail, residual demand delay
(d3) is included within the
value of uniform delay. The
computation of incremental or
random delay (d2) can be
confirmed by using a calculator
or spreadsheet to apply the
Highway Capacity Manual
formula for incremental delay.
Moving Technology
Highway Capacity
Analysis Seminars
HCM2000 Procedures and
HCS2000™ Applications
Bend, Oregon
Feb 27-Mar 1, 2002
This seminar is 3 days and covers the HCM2000 analysis
procedures and HCS2000™ software applications for Multilane
Highways, Basic Freeway Segments, Freeway Weaving, Ramps
and Ramp Junctions, Unsignalized Intersections and Signalized
Intersections; with notes on Freeway Facilities, Urban Streets,
Two-Lane Highways and Transit Capacity.
For more information or to register online, go to:
http://mctrans.ce.ufl.edu/conferences/training
For seminar information, contact Bill Sampson at:
352-392-0378, ext. 241 or [email protected]
For registration information, contact Mitch Davis at:
352-392-0378, ext. 229 or [email protected]