1
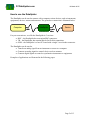
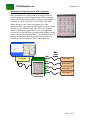
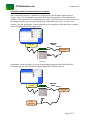
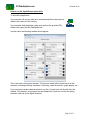
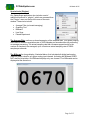
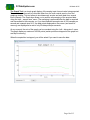
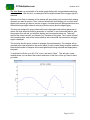
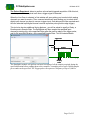
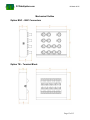
PCDataSpider.com
16 March 2015
DataSpider - USB Data Acquisition Module
User Manual
Description
The Data Spider is a module that allows interfacing electrical instruments or devices with a
computer. It can take up to 4 analog electrical signals (from 0V to 5V) and up to 4 digital
electrical signals (0V or 5V), converts them into digital data, and sends that data to a computer. It
can also receive commands from a computer to generate up to 2 analog electrical signals (from
0V to 4V) and up to 4 digital electrical signals (0V or 5V).
The Data Spider module incorporates a programmable controller (Propeller from Parallax) along
with a dedicated circuitry to process the different electrical signals and communicate with a
computer via a USB link. The module is pre-programmed with a standard firmware (written in
Spin and Propeller Assembly) and a standard set of instructions, but can also be customprogrammed to perform specific functions or respond to specific commands. The module also
comes with a basic data acquisition software “SpiderScope” written in Python that can run on
almost any personal computer.
Both the firmware and the SpiderScope data acquisition software are available as Open Source
on Github (https://github.com/pcDataSpider). The Github repository has more detailed
information on both.
The module is also offered as Open Source Hardware on the Open Hardware Repository
(www.ohwr.org) under “USB Projects” as usb-adc2k12b4ch-dac2k10b2ch-dio8ch.
Page 1 of 13
PCDataSpider.com
16 March 2015
How to use the DataSpider
The DataSpider can be used to connect with a computer various devices such as instruments,
equipments, devices, sensors and actuators. The general use connection is illustrated below.
Computer
DataSpider
USB
Device
Cable
Wire
For your convenience, we offer the DataSpider in 3 versions:
• BNC – the DataSpider has convenient BNC connectors.
• TB – the DataSpider has terminal blocks for flexible connections.
• OEM – the DataSpider is a bare PC-board with a single 2-rows header connector.
The DataSpider can be used to
• Transfer an analog signal from an instrument or sensor to a computer.
• Generate an analog signal to control a device such an actuator.
• Generate digital signals to control or synchronize instruments or equipments.
Examples of applications are illustrated in the following pages.
Page 2 of 13
PCDataSpider.com
16 March 2015
Interfacing analog instruments with a computer
Many instruments or sensors generate an analog electrical
signal in response to events or phenomena. Most instruments
(mostly older instruments) bring this analog electrical signal as
an output on a BNC connector. You can connect this BNC
output directly to one of the Analog Input (AI) of the
DataSpider BNC, and connect the DataSpider to your computer
platform via the USB cable link. Then from your computer,
using our SpiderScope application or your own application,
you can receive the data from your instrument, display it on the
screen, and save it to your hard drive. You can connect up to 4
instruments and simultaneously acquire the data from all 4
instruments on your computer. This is illustrated below.
Computer
DataSpider
AI-0
BNC
Coax
Cables
Instrument 1
AI-1
Instrument 2
USB
AI-2
Instrument 3
AI-3
Instrument 4
Page 3 of 13
PCDataSpider.com
16 March 2015
Controlling analog instruments from a computer
Some instruments also have capabilities to respond to an external digital signal such as a
“trigger” pulse. The DataSpider can generate such signal in respond to a command from the
computer. This command can be generated easily with a click of the mouse (or push of a key) on
the computer display when using our SpiderScope application software (or you can easily
develop your own application). In this configuration, the acquisition of the data by the computer
can be synchronized with the trigger pulse.
BNC Coax
Cables
Computer
Analog Out
AI-0
USB
Instrument 1
DataSpider
Trigger In
DO-0
An alternate variance would be to use an external trigger generator connected to both the
instrument and one of the DataSpider Digital Input (DI) as illustrated below.
BNC Coax
Cables
Computer
DataSpider
USB
Analog Out
AI-0
Instrument 1
Trigger In
DI-0
Pulse
Generator
Page 4 of 13
PCDataSpider.com
16 March 2015
SpiderScope application
Main features:
• Compatible with Windows, MacOS, Linux (written in Python).
• Basic software is released as Open Source (github/pcdataspider).
• Saves data in csv (comma separated values) file format.
• Main control panel window with all channels.
• Data acquisition with timing, sampling rate, averaging, trigger.
• Analog and Digital output signals.
• Simple display tools:
Large billboard display (numeric value and bar graph)
Simple time graph
Data scan (single point acquisition from push-button or trigger)
Basic function generator (pulse, square wave, saw-tooth, sine wave)
• Easily expandable: add your own tools or functions.
How to install the SpiderScope application:
From the internet (https://github.com/pcDataSpider/SpiderScope):
You can download the full source code from our Github repository (make sure to select the
“testing” branch). Read the Wiki information on how to install the application.
From the provided CD:
Simply copy the bin.zip file on your computer in any location of your choice, and then un-zip
it. This will install all the components you need. You may then want to crate a shortcut on
your desktop to point to the SpiderScope.exe file.
Page 5 of 13
PCDataSpider.com
16 March 2015
How to run the SpiderScope application:
To launch the application:
If you have the full source code (such as downloaded from the internet),
double-click (open) the file main.py.
If you have the built distribution code (such as from the provided CD),
double-click (open) the file DataSpider.exe.
In either case, the following window should appear.
This is the main control panel window. This lets you access all the functions for all the
channels, including start/stop acquisition, file saving, channel selection, graph display, etc…
If you just want to acquire data and save it in a file, it is best to do this directly from this
window. This window / control panel can be divided into 2 portions: one for the analog
channels, and one for the digital channels.
Page 6 of 13
PCDataSpider.com
16 March 2015
Controlling the Analog Channels.
All analog channels, Analog Input 0 - 3 and Analog Output 0 - 1, have similar controls.
Each analog channel has its own control panel, and all channels are controlled
independently. Controls are implemented with “buttons” and input fields on the panels. All
buttons are activated by clicking on them with your mouse. The control panels for the
analog channels include the following:
Analog Input Channels.
•
Record button (grey and red circle at top right corner of panel)
•
Sample rate input field
•
“Set Timer” button
•
Start/Stop button (blue circle at bottom right corner of panel)
Analog Output Channels.
•
Record button (grey and red circle at top right corner of panel)
•
Output Power input field
•
“Set Timer” button
•
Start/Stop button (green circle at bottom left corner of panel)
The “record” button activates the file saving feature. When activated, a new window will
open to specify the location and name of the file that will be used to save the data. Once
activated, the button will “light-up” with a bright red center. THIS DOES NOT START DATA
ACQUISITION. Data is saved in cvs format, and includes a header with a date and time
stamp, and the channel being recorded. The data is saved in 2 columns, one for the actual
time (in decimal seconds) for each sample and one for the value.
The sample rate input field is self-explanatory. You can enter any positive value, however
the maximum that can be implemented is 3000 samples per second for a single channel.
Decimal values correspond to sampling rates less than 1 sample per second (0.1
corresponding to 1 sample every 10 sec).
The output power field is also self-explanatory. You can enter any positive integer value
between 1 and 1000.
The “Set Timer” button enables an internal timer that will control the duration of the
acquisition (for input channels) or activation (output channels). When activated, it will open
a new window in which you can enter the desired duration in hr:min:sec format. If the timer
is not activated, the data acquisition (or output activation) will last as long as the Stop/Start
button is lit.
The Start/Stop button controls the data acquisition (or output activation). Data acquisition
will start as soon as it is activated. When activated, the button will “light-up”. Clicking a
second time will turn it off and stop the acquisition.
Page 7 of 13
PCDataSpider.com
16 March 2015
Controlling the Digital Channels.
All digital channels, Digital Input 0 - 3 and Digital Output 0 – 3 are controlled from a single
panel, The controls are very simple, as there is no specific sampling rate nor any specific
output level to be controlled. The channels are simply either ON (digital value of 1) or OFF
(digital value of 0).
The status of each Digital Input channel is indicated by the blue buttons on the left side, and
the status of each Digital Output channel is controlled by the green buttons on the right side.
The control panel includes a single “Set Timer” button that enables an internal timer that will
control the duration of the acquisition (for input channels) and activation (output channels).
When activated, it will open a new window in which you can enter the desired duration in
hr:min:sec format. If the timer is not activated, the data acquisition (or output activation) will
last as long as the Stop/Start button is lit.
The control panel includes a single “Record” button (grey-red circle at top right corner of
panel). When activated, the state of all 8 digital channels will be recorded and saved in a
file. Data is recorded and saved only when the state of any digital channel changes.
Page 8 of 13
PCDataSpider.com
16 March 2015
Special tools (Plugins).
Our SpiderScope application also includes a set of
additional functions or “plugins”, which are accessed from
the “Plugins” menu on the top left corner of the main
window. These tools include:
•
•
•
•
•
Average Filter (on-board averaging)
Graphing Tool
Billboard
Line Scan
Pulsed Experiment
The Average Filter performs on-board averaging of the sampled data. This allows keeping
the maximum effective acquisition rate of 3000 samples per seconds while still performing
an average processing. The actual sampling rate then increases proportionally to the
number of samples to be averaged, up to a maximum actual sampling rate of 50000
samples per seconds.
The Billboard is a large display, illustrated below, that includes both digital and analog
(side bar graph) value for any given analog input channel. Activating the Billboard DOES
NOT start an acquisition. One Billboard displays only one channel. Four Billboards can be
displayed at the same time.
Page 9 of 13
PCDataSpider.com
16 March 2015
The Graph Tool is a simple graph display of the analog input channel value being acquired.
The actual acquisition can be controlled either from the main control panel or from the
graphing window. This tool allows to simultaneously acquire and save data from several
input channels. The Graph also allows you to perform an averaging of the acquired data
using the “edit – sample size” menu. The averaging is performed after the data is acquired
and transmitted to the computer, so if you have selected a sample rate of 200 samples per
second and a sample size of 10, the data points displayed on the screen (and saved in
memory) are displayed at a rate of only 20 data points per seconds.
At any moment, the axis of the graph can be re-scaled using the “edit – dimensions” menu.
The graph displays a maximum of 4000 points (earlier points are dropped off the graph but
are kept in memory).
When the acquisition is stopped, you will be asked if you want to save the data.
Page 10 of 13
PCDataSpider.com
16 March 2015
The Line Scan is a combination of a simple graph display with a triggered data sampling
and acquisition. With this tool, one data point will be acquired each time a trigger signal is
detected.
When the Line Scan is selected, a first window will open asking you to select which analog
channels you want to acquire. Then a second window will open asking you to select which
digital input channel you want to use as a trigger. One data point will be acquired each time
the selected input digital channel receives a positive pulse (positive edge trigger).
This tool was designed to acquire data while one independent and external parameter is
varied. We thus assumed that this parameter is “scanned” in an incremental fashion, and
the program thus will ask you what the starting and incremental values are. These will
become the values on the X co-ordinate (or X variable) of the graph. The X-value will start
at the starting value, and will be incremented by the incremental value each time a trigger
signal is detected.
This tool also has the option to take an average of several samples. The samples will be
acquired at the rate selected on the control panel of each channel being acquired, and then
the selected number of samples will be averaged before being acquired and displayed on
the graph.
To stop the Line Scan, go to the “File” menu, and select “Save”. This will open a new
window where you can select the location and name of the file in which you want to save
your data.
Page 11 of 13
PCDataSpider.com
16 March 2015
The Pulsed Experiment allows to perform a timed and triggered acquisition. With this tool,
one data point will be acquired each time a trigger signal is detected.
When the Line Scan is selected, a first window will open asking you to select which analog
channels you want to acquire. Then a second window will open asking you to select which
digital input channel you want to use as a trigger input. One data point will be acquired each
time the selected input digital channel receives a positive pulse (positive edge trigger).
This tool also has two additional timing features: you will be asked to specify a Delay, a
Duration and a Sample Rate. The DataSpider will then sample the specified input
channel(s) starting only at the specified Delay after the positive edge of the trigger pulse,
and for the specified Duration, at the specified Sample Rate. This is illustrated below.
Trigger Pulse
Delay
Duration
On-board sampling
Sampling
Period
The DataSpider module will perform on-board averaging of all the samples acquired during the
specified duration before sending them to the computer. A sampling rate of up to 50,000 samples
per seconds can be specified. The Trigger pulses can repeat at a frequency of up to 3,000 Hz.
Page 12 of 13
PCDataSpider.com
16 March 2015
Mechanical Outline
Option BNC – BNC Connectors
Option TB – Terminal Block
Page 13 of 13