1
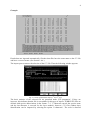
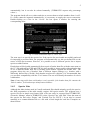
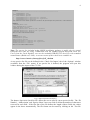
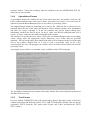
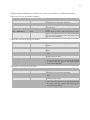
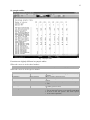
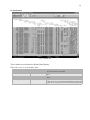
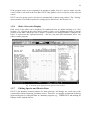
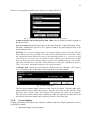
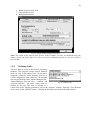
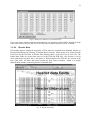
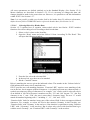
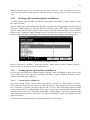
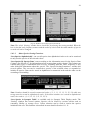
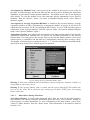
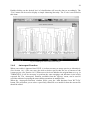
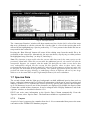
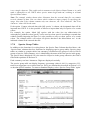
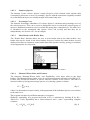
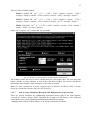
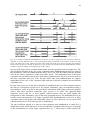
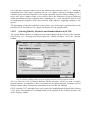
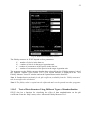
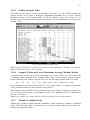
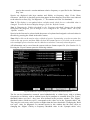
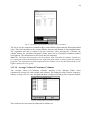
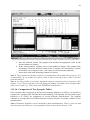
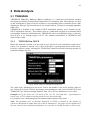
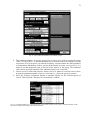
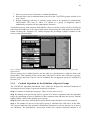
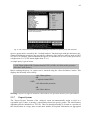
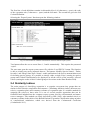
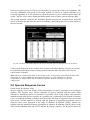
31
0 – not defined; 1 – tree layer (high) ; 2 – tree layer (middle) ; 3 – tree layer (low) ; 4 –
shrub layer (high) ; 5 – shrub layer (low) ; 6 – herb layer (high) ; 7 – juveniles; 8 –
seedlings; 9 – moss layer.
Layer is the most important information about the species. It is displayed automatically at the
bottom Status Bar near the selected species’s name. Layer can be displayed in the Species Data
Column: from the ‘Species’ menu, select ‘Species Data’ and ‘Layer View’ or select the Layer
Icon on the Icon Bar. (See Section 1.5.1.) Layer can be displayed as a number, as text or both.
1.7.2
Frequency and Cover Values
The ‘Species Data’ submenu (from the ‘Species’ menu) has functions for writing ‘Frequency’,
‘Maximum Cover’ or ‘Median Cover’ to the Species Data Column. ‘Frequency’ is the
frequency of species occurrences in the data set. ‘Maximum Cover’ is the species’s maximum
cover value in the data set. ‘Median Cover’ is calculated from all non-zero cover values.
These statistics can also be viewed by selecting ‘Species Statistics’ from the ‘Species’ menu.
(To return to Standard Display, it is necessary to select ‘Species Statistics’ again.)
1.7.3
Sequence and Species Colour
The ‘Sequence’ function writes consecutive numbers into the Species Data Column. The ‘No.
of Species Colour’ function writes each species's current colour to the Species Data Column
according to the following code: 0 – black, 1 – red, 2 – blue, 3 – sea-green, 4 – green, 5 –
yellow, 6 – violet, 7 – grey.
1.7.4
Transformation of Species Data
Numerical values (n) in the Species Data Column can be replaced by their squares (n2), square
roots ( n ) or multiplicative inverses (1/n).
1.7.5
Statistics Summarizing Relevé Data
Short headers can contain data about the relevés such as means of Ellenberg indicator values,
sums of species statistics, Shannon-Wiener indices, potential heat load etc. (See Section 1.8.) A
statistic summarizing the short header data from the relevés in which the species occurs – such
as minimum, maximum, mean or median value – can be written to the Species Data Column.
From the ‘Species’ menu select ‘Species Data’ and ‘Short Header Data’. This gives a menu of
summarizing statistics to choose from.
1.7.6
Ellenberg Indicator Values
Ellenberg indicator values can be written to the Species Data Column: from the ‘Species’ menu
select ‘Species Data’ and ‘Indicator Value’. This opens a menu for selecting whether to display
indicator values for ‘Light’, ‘Moisture’, ‘Continentality’, ‘Temperature’, ‘pH’ or ‘Nutrients’.
Before using this function, it is necessary that the indicator values be defined. More information
on Ellenberg indicator values will be included in later editions of this manual.
1.7.7
External Species Data
Other species data can be imported into JUICE if they are in a suitable format. An example of a
simple text file (denoting ploidy level) accepted by JUICE is show below: