1
Office energy saving potential through component
based automation, a design and implementation
Marcel Jillings
University of Groningen
Software Engineering and Distributed Systems
Sijmon Heitmeijer
University of Groningen
Software Engineering and Distributed Systems
supervised by
Alexander Lazovik, University of Groningen, The Netherlands
Alexandru Telea, University of Groningen, The Netherlands
August 27, 2013
Version 1.0
1|73
Abstract
One of the focus points of the University of Groningen in teaching and research is energy and sustainability. In
2012 two PhD students from the Distributed Systems research group proposed a prizewinning plan to make
the Bernoulliborg building sustainable in terms of waste disposal and the use of water and energy. The
proposed plan is being executed in the course of the year 2013. This thesis is part of the execution of the plan's
energy savings solution that aims to save at least 7.7% (107,514 kWh) annually through automatically
controlling HVAC systems, lights, computers, appliances, and providing energy consumption tracking.
A new automated system had been designed and installed in the north wing on the fifth floor of the
Bernoulliborg building that is capable of monitoring and influencing the energy consumption of the offices and
common areas. Plugwise devices have been installed, after considering multiple sensors and actuators, to
monitor the energy consumption of devices and to turn them on or off. A computer client has been developed
that acts as an activity sensor and provides the system with the ability to safely shut down computers or to put
them into a standby mode. The installed system consists out of multiple loosely coupled software components
that each fulfill their own dedicated tasks. Kafka has been chosen as the message queue by which the
components communicate with each other through JSON messages. A ZooKeeper instance is used to monitor
the state of components and provide automatic discoverability for all the components, including the Kafka
message queue.
Based on the actual measured energy consumption data and the functionality of the created Green Mind
system a simulated result was formed for the energy saving potential of the design. The biggest energy saving
potential is the office and hallway lighting which, even on a bright sunny day, consumes multiple kilowatt
hours per day. Computers use around one kilowatt hour per week per computer outside office hours, even
when turned off. Through a smart set of rules the Green Mind system is capable of saving that energy by
automating the control of the devices.
2|73
Acknowledgments
We would like to express our sincere gratitude to our supervisor, Alexander Lazovik, for his continuous
support, enthusiasm and knowledge. Without his guidance and persistent help this thesis would not have been
possible.
Special thanks go to our second supervisor, Alexandru Telea, for his friendly advice, motivation and insightful
comments.
We would also like to thank Faris Nizamic and Tuan Anh Nguyen for their encouragement and invaluable
suggestions.
We have greatly benefited from the discussions with our fellow team members, Mattijs Meiboom, Rosario
Contarino, Amedeo Merlo, Brian Setz and Ruurtjan Pul.
Our deepest appreciation goes to the volunteers that allowed us to install sensors and monitor their offices.
Without their support this thesis would not have been possible.
3|73
Table of contents
Abstract .................................................................................................................................................................. 2
Acknowledgments .................................................................................................................................................. 3
Table of contents .................................................................................................................................................... 4
List of Figures .......................................................................................................................................................... 7
List of Tables ........................................................................................................................................................... 8
Introduction ............................................................................................................................................................ 9
1.1 Context ......................................................................................................................................................... 9
1.2 Research goals ............................................................................................................................................ 10
1.2.1 Hypothesis .......................................................................................................................................... 10
1.2.2 Measurable goals ................................................................................................................................ 10
1.2.3 Planned solution ................................................................................................................................. 11
1.2.4 Expectation ......................................................................................................................................... 11
1.3 Contributions.............................................................................................................................................. 12
1.4 Overview .................................................................................................................................................... 12
Related work ......................................................................................................................................................... 13
Technical approach ............................................................................................................................................... 15
3.1 Design overview ......................................................................................................................................... 15
3.1.1 Physical layer....................................................................................................................................... 16
3.1.2 Service layer ........................................................................................................................................ 16
3.1.3 Persistence layer ................................................................................................................................. 16
3.1.4 Logic layer ........................................................................................................................................... 17
3.2 Sensors and actuators ................................................................................................................................ 17
3.2.1 Inventory ............................................................................................................................................. 17
3.2.2 Computer ............................................................................................................................................ 20
3.2.3 Lighting................................................................................................................................................ 21
3.2.4 Other ................................................................................................................................................... 22
3.3 Databases ................................................................................................................................................... 23
3.3.1 Inventory ............................................................................................................................................. 23
3.3.2 Neo4j ................................................................................................................................................... 24
3.3.3 OrientDB ............................................................................................................................................. 24
3.3.4 DEX ...................................................................................................................................................... 25
3.3.5 Overview ............................................................................................................................................. 26
3.3.5 Conclusion ........................................................................................................................................... 27
3.4 Message queue .......................................................................................................................................... 28
3.4.1 Inventory ............................................................................................................................................. 28
4|73
3.4.2 RabbitMQ ............................................................................................................................................ 29
3.4.3 Kafka ................................................................................................................................................... 29
3.4.4 HornetQ .............................................................................................................................................. 29
3.4.5 Overview ............................................................................................................................................. 30
3.4.6 Conclusion ........................................................................................................................................... 31
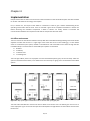
Implementation .................................................................................................................................................... 32
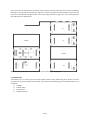
4.1 Office environment .................................................................................................................................... 32
4.1.1 Kitchen area ........................................................................................................................................ 33
4.1.2 Meeting area ....................................................................................................................................... 34
4.1.3 Office ................................................................................................................................................... 34
4.1.4 Hallway ................................................................................................................................................ 34
4.2 Architecture................................................................................................................................................ 34
4.2.1 Physical layer....................................................................................................................................... 34
4.2.2 Service layer ........................................................................................................................................ 35
4.2.3 Persistence layer ................................................................................................................................. 35
4.2.4 Logic layer ........................................................................................................................................... 35
4.3 Components ............................................................................................................................................... 35
4.3.1 OrientDB ............................................................................................................................................. 36
4.3.2 Sensor and actuator gateway ............................................................................................................. 36
4.3.3 Consumption measurement ............................................................................................................... 37
4.3.4 Controller ............................................................................................................................................ 38
4.3.5 Orchestrator........................................................................................................................................ 40
4.3.6 ZooKeeper ........................................................................................................................................... 40
4.3.7 Other components .............................................................................................................................. 41
4.4 Communication .......................................................................................................................................... 42
4.5 Discussion ................................................................................................................................................... 43
Theoretical results ................................................................................................................................................ 45
5.1 Consumption measurements ..................................................................................................................... 45
5.1.1 Offices ................................................................................................................................................. 45
5.1.2 Public areas ......................................................................................................................................... 48
5.2 Estimated energy saving potential and other research ............................................................................. 53
5.2.1 Lighting................................................................................................................................................ 54
5.2.2 Workstation ........................................................................................................................................ 54
5.2.3 Appliances ........................................................................................................................................... 55
5.3 Discussion ................................................................................................................................................... 55
5.3.1 Reliability and applicability ................................................................................................................. 55
5.3.2 Lighting................................................................................................................................................ 55
5|73
5.3.3 Workstations ....................................................................................................................................... 56
5.3.4 Appliances ........................................................................................................................................... 57
Conclusion ............................................................................................................................................................ 58
Future work .......................................................................................................................................................... 60
7.1 Extending and improving the sensors and actuators ................................................................................. 60
7.2 Comfort enhancement ............................................................................................................................... 60
7.3 Testing the system, sensors and actuators ................................................................................................ 61
7.4 Security ....................................................................................................................................................... 61
7.5 Administrator panel ................................................................................................................................... 61
7.6 Extending rule support for controller......................................................................................................... 62
References ............................................................................................................................................................ 63
Glossary ................................................................................................................................................................ 73
6|73
List of Figures
Figure 1.1
The Bernoulliborg building.
9
Figure 3.1
Architectural overview of the Green Mind system.
15
Figure 4.1
Map of the offices and kitchen area on the east side of the fifth floor.
32
Figure 4.2
Map of the offices and meeting area on the north wing of the fifth floor.
33
Figure 4.3
Content of a hour entry as returned by the SAGW.
38
Figure 4.4
Example of a simplified rule to turn a computer off when it is idle and it is after 20:00.
39
Figure 4.5
Example of an extended rule to turn a light on when the weather is cloudy.
39
Figure 4.6
JSON object of a typical request.
42
Figure 4.7
JSON object of a typical successful response.
42
Figure 4.8
JSON object of a typical error response.
43
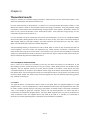
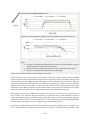
Figure 5.1
Energy consumption summary of office lights.
46
Figure 5.2
Energy consumption summary of workstations.
47
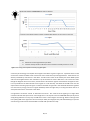
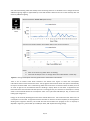
Figure 5.3
Energy consumption summary of the kitchen microwave oven.
48
Figure 5.4
Energy consumption summary of coffee machine in the kitchen.
49
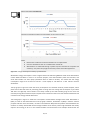
Figure 5.5
Energy consumption summary of the fridge in the kitchen.
50
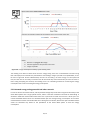
Figure 5.6
Energy consumption summary of lights in the corridor.
51
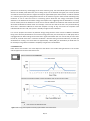
Figure 5.7
Energy consumption summary of the electric water boiler in the kitchen.
52
Figure 5.8
Energy consumption summary of the meeting room.
53
7|73
List of Tables
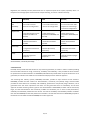
Table 3.1
Overview between Neo4j, DEX and OrientDB about scalability, availability, performance,
documentation, community, price and usage.
27
Table 3.2
Overview between RabbitMQ, Kafka and HornetQ about scalability and availability,
performance, documentation, community and usage.
31
Table 4.1
The three available values for the status field in a response JSON object.
43
Table 5.1
Summary of the potential energy saving found through the measurements.
54
8|73
Chapter 1
Introduction
This chapter introduces the background and research goals for this thesis about potential energy saving in
offices through the use of a component based building automation system.
First, in Section 1.1, the context of the research domain is provided in order to create a better understanding
of the origin and the reasons for this research. After clarifying the domain, the hypothesis and research goals
are given in Section 1.2 along with a summary of the used approach and expectations. Finally, in Section 1.3,
the relevance and contributions of this thesis are listed before giving an overview of the further structure of
this thesis in Section 1.4.
1.1 Context
This thesis is conducted as part of multiple research projects, related to energy and sustainability, at the
Distributed Systems research group at the University of Groningen. Energy and sustainability is one of the
focus points in teaching and research of the university [3].
In 2012 Tuan Anh Nguyen and Faris Nizamic, two PhD students from the Distributed Systems research group,
proposed a prizewinning plan [1] to make the Bernoulliborg building sustainable in terms of waste disposal and
the use of water and energy. Winning the Green Mind Award [2] means that the proposed plan is being
executed in the course of the year 2013. This thesis is part of the execution of the plan's energy savings
solution that aims to save at least 7.7% (107,514 kWh) annually through automatically controlling heating,
ventilation, and air condition (HVAC) systems, lights, appliances, and providing energy consumption tracking.
HVAC systems are applied to control the indoor environment comfort (e.g., room temperature and
ventilation).
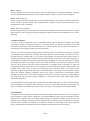
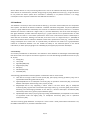
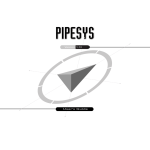
Figure 1.1: The Bernoulliborg building.
The Bernoulliborg is located on the Zernike Complex in the
Dutch city Groningen and was officially opened in
February 2008. It accommodates 350 staff members and
500 students. The overall size is 33 by 83 meters and a
height of 27 meters. It houses both the Faculty of
Mathematics and the Faculty Natural Sciences as well as
the departments of mathematics, computing sciences and
artificial intelligence. Figure 1.1 shows the facade of the
building. Common areas such as a library, cafeteria and
lecture rooms are located on the two lower levels. Offices
are located in three separate wings on the three upper
floors of the building.
In order to reach the proposed minimal energy consumption saving of 7.7% a system has to be designed that
can alter the state of devices such that energy can be saved without the loss of comfort or drastic alterations
to the building's structure. A building management system (BMS) is already present in the building, which is
accessible remotely by the campus management. BMS systems are widely used in buildings to control and
monitor the electrical equipment of the building, such as lighting and HVAC systems. However, the BMS
located at the Bernoulliborg building is limited to controlling electrical equipment on a building level. The only
segmentation in the system is at most on a 'per wing' basis, which is nowhere near the envisioned granularity
of management on a 'per person' or 'per room' level. The control of the BMS is limited and not easily
accessible by third party software, it was thus not integrated into the design of the new system.
9|73
Due to the limitations of the BMS it is necessary to install new sensors and actuators so that it becomes clear
what, or who, uses the most energy and to measure how much exactly is being consumed at what time. These
sensors and actuators also use energy but need to create enough energy savings to justify their costs. A live
experiment was created to monitor eight actively used offices, located on the fifth floor in the north wing (the
leftmost wing in the picture of Figure 1), in order to measure energy consumption, test the possible sensors,
determine their usefulness, and gain knowledge about the interaction of office workers. Along with the offices
the experiment also includes the adjoining hallway, meeting room, toilets and kitchen/communal area.
The plan proposed for the Green Mind Award encompasses more than just energy saving and the system in
this thesis thus takes into account the other components that will be integrated with the system over time.
1.2 Research goals
First, in Subsection 1.2.1, the hypothesis for this thesis is provided. In order to narrow down the scope a fixed
number of research goals have been set. This section describes those goals in Subsection 1.2.2, as well as the
plan to reach those goals in Subsection 1.2.3 and the initial expectations about the outcome of the thesis in
Subsection 1.2.4.
1.2.1 Hypothesis
The purpose of this experiment is to design and build an actual working system that is capable of automating
energy consumption management in regular offices that are being used by employees. Previous research [4]
has indicated that energy can be saved by implementing such automated systems but are usually limited to a
small scale implementation in a controlled environment. The ever growing amount and implementations of
sensors and the connectivity of such devices make it possible to implement such a system in a working
environment, outside of a lab setup.
By implementing the system in an uncontrolled environment of actively used offices, it will presumably be less
stable due to users tampering with the sensors out of curiosity or inexperience. It also raises the case that no
office worker is alike, which means the amount of potential energy saving will differ from office to office. It will
therefore be of use to find out if an automated system will scale up to a larger and more volatile operating
environment. The system should not lose too much of its effectiveness in order to save energy while justifying
the costs, both in money and energy consumption of the system itself, and the effort required of installing
such a system in an existing or new building.
Based on previous research, discussions with building managers, and observations during walkarounds in the
Bernoulliborg the potentials of saving energy are high and the system should be able to save energy even if the
scale and volatile environment lower the efficiency of the system. The hypothesis is thus as follows:
'Installing a building automation system that controls multiple occupied offices has the potential to save
energy.'
1.2.2 Measurable goals
A total of three goals have been set in order to judge the effectiveness of the final implementation. The details
of these goals are described in this subsection and will be used in the discussion of the estimated results and
the conclusion of this thesis later on.
10|73
Goal 1 - Lighting
Based on the goal set by the proposed plan for the Green Mind Award: the energy consumption of lighting
should be lowered by 25%. Lighting is currently motion enabled or always on, which is not very efficient.
Goal 2 - Electronic devices
Based on the goal set by the proposed plan for the Green Mind Award: the energy consumption of electronic
devices should be lowered by 25%. Non-essential devices sometimes remain enabled unnecessarily (e.g.,
during absence, night, or weekend).
Goal 3 - Return on investment
Based on the goal set by the proposed plan for the Green Mind Award: costs of installation should be returned
within 7 years at most. Savings should be high enough to make the purchase and installation of such a device
appealing.
1.2.3 Planned solution
In order to reach the envisioned goals, an automated system needs to be able to influence the energy
consumption of lights and electronic devices in the existing offices. The system also needs to collect the
consumption information of the individual devices for research purposes and to create user awareness to
encourage even more energy savings by the users themselves.
The plan is to reach the goals by installing remotely accessible sensors and actuators in the offices to provide
an automated system with all the necessary data to base decisions on and to make it possible to set nonessential devices in standby mode or to turn them off completely. The governing system itself consists of
multiple subcomponents. Each component performs different tasks and has their own dedicated goal (e.g.,
collecting the consumption measurements). Components work together to reach their common goal, reducing
the energy consumption in the offices, and to share useful information with the other components so that
both the raw sensor data and other processed information is accessible to each component. To make the
management of these components easier, the components communicate either through a REST interface or a
message queue, which allows for loose coupling between the components. REST is the dominant web
application programming interface (API) that is usually described in the context of HTTP, whereas message
queues are separate software components that can be used for asynchronous communication where
messages are placed onto a queue until the recipient receives them. The data is stored in a central database
and components find each other through ZooKeeper, an open-source server which enables highly reliable
distributed coordination.
It is envisioned that over time new sensors and actuators are added to the system, as well as new components
that provide better or completely new functionality, so that the system keeps updating and improving. The
system is named the Green Mind system which refers to its origin as a proposal for the Green Mind Award.
1.2.4 Expectation
Through the loose coupling of the individual components the system should scale better, more easily adapt to
new components, and be easier to manage than a conventional BMS. By using a dynamic combination of small
hardware, that integrates with the existing building design, and dedicated software the system has the
potential to save energy at a relatively low cost without the loss of comfort and even the potential to increase
comfort. Based on previous local projects and preliminary research the initial design of the system should be
able to reach the goals of this thesis while also forming the basic framework for future research.
11|73
1.3 Contributions
The main driver behind this project is the focus of the university on energy and sustainability and also the
implementation of the winning plan of the Green Mind Award. Through this thesis a framework is built that
presents a multitude of new research possibilities for bachelor and master thesis projects, such as research
into energy awareness amongst employees, as well as allowing the university to design and develop new
'homegrown' ideas, a desire expressed in the original call for submissions for the Green Mind Awards [5].
Accessibility to a live testing environment of actively used offices is something that is rarely done before and
gives the University of Groningen an edge over other universities which they can use as a selling point.
Other research focuses on measuring and influencing devices in a controlled environment and point out that
there is energy to be saved through smart automated management. This project aims to determine if such
solutions are still manageable and efficient in a larger and more volatile environment. Another point of focus is
to create a system that is setup in such a manner that it is applicable to multiple buildings. Not just another
prototype but a system that is usable in production in the future. Although the topic of sustainability is hot at
the moment, research has yet to bring forth a fully functioning solution that can operate in a working
environment.
This thesis introduces a new system design and contains the consumption data collected from the offices
located at the University of Groningen in The Netherlands. This consumption data is used to estimate the
possible annual energy saving potential of the system of when it would have actually been operational. Due to
two unfinished components that were co-developed by two other groups, it was not possible to automatically
influence the energy consumption with the Green Mind system.
In summary, this thesis offers the following contributions:
● Encourages numerous new research projects for bachelor and master thesis and allow the design and
development of new 'homegrown' ideas.
● Provides accessibility to a live testing environment of actively used offices for the university.
● The designed system is to be used in production in the future, rather than being another prototype.
● Introduces a new system design for component based automation to achieve potential energy
savings..
● Provides energy consumption data from offices located at the University of Groningen in The
Netherlands.
1.4 Overview
This section presents how the remainder of the thesis is organized. Chapter 2 is about related work and
introduces the theoretical framework and previous related research. Chapter 3 provides an overview of the
tools and methods being used, where both the used hardware and software technologies are outlined.
Chapter 4 presents the architecture of the developed system as a whole. The used solutions are explained,
while referring to the goals set in this introduction, and their results are discussed. Chapter 5 discusses the
potential results and contains the collected energy consumption measurements. The estimated results are
compared to results of previous research and an explanation is given for why the measurements are as they
are in Chapter 5 as well. Finally, Chapter 6 concludes this thesis with a recap of the research goals and a
summary of the objectives and results, followed by future work in Chapter 7.
12|73
Chapter 2
Related work
Numerous researches have analyzed and shown the energy saving potential in office buildings. Lighting has
been pointed out by various sources [10, 11, 12, 13] as an area with significant energy improvement
potentials. Besides lighting office equipment (e.g., computer and monitor) influences the energy usage to a
great extend. Kawamoto et al. [8 Table 4] and Webber et al. [9 Table 3] show that a large percentage of
computers and monitors are not turned off but in standby mode during non-office hours (40% in Japan and
75% in US). According to the authors of [8], computers and monitors in offices are found to be in standby
mode for no less than 21 hours a day. HVAC systems can also contribute to the possible energy and cost
savings according to several studies [14, 15, 16]. This thesis focuses only on lighting and office equipment for
energy saving potential as the HVAC installed at the Bernoulliborg building is only manageable on a per-wing
basis, rather than on the envisioned per-room basis.
BMS systems are widely used in buildings to observe and grasp the status of energy consumption in operation.
Besides monitoring BMS systems are able to control the internal environment of the building and can, if
configured properly, reduce the energy consumption. However, these BMS systems typically do not have fine
grained access to each room, or even each floor, and encompass a larger area. For example, the BMS used at
the Bernoulliborg building only has access to a whole wing and cannot monitor individual rooms. Studies [17,
18, 19, 20, 21] have been presented by the scientific community to incorporate more intelligence in the BMS
systems to optimize the building's energy usage. Two studies [17, 21] show a similar effort to reduce the
energy consumption by equipping the building with multiple sensors and provide that information to the BMS
system. Rules are created, based on the context information provided by the sensors, to achieve an optimal
energy efficiency and comfort condition of the building. Although both studies seem to be one of the most
well-described and complete approaches that are similar to the work in this thesis, both require a BMS. The
approach in this thesis does not depend on a BMS system and can therefore be used in any building. In
addition, the study presented by Han et al. [21] does not provide any information about potential energy
savings that can be achieved through the system. The study by Doukas et al. [17] only provides information
about the potential cumulative energy savings made through the system, rather than the potential energy
savings per device (e.g., computers, lighting).
Despite the scientific interest in improving the energy consumption through BMS systems, Nguyen et al. [24]
describe in a survey about energy intelligent systems that the three main energy consuming subsystems in
buildings (i.e., HVAC, lighting and office equipment) also draw the attention of numerous studies. From the
researched studies, some focus on one subsystem only, while others try to save energy for two or even three
subsystems. The majority (22 out of 32) of the reviewed studies focus only on one subsystem, whereas this
thesis focuses on two subsystems. Six studies focus on HVAC and lighting, three focus on HVAC, lighting and
power plugs, and two others focus on lighting and power plugs only. iSpace [25] and Intelligent Buildings by
Davidson et al. [26] are the two projects that only focus on lighting and power plugs, similar to the focus of this
thesis. The work presented in [25] differs with this thesis because, although it can be used for energy savings,
it is focused on autonomous environments and on student bedrooms, rather than offices. In addition, the
energy consumption is not monitored. Although Davidson et al. do the same conceptually [26], the system in
this thesis uses a different implementation. For example, [26] uses a Multi-Agent System (i.e., each agent is
linked to, and manages, a particular entity in the building such as an office, device, or person) and relies on a
Bluetooth-based indoor positioning system that requires software to be installed on the mobile phone of each
user. From the three studies that focus on all three subsystems, two of these studies [27, 28] solely focus on
houses instead of our focus on offices. The other study, namely the GreenerBuildings project [23], considers
multiple buildings, such as offices, universities and hotels, for deployment. The architectural model of the
13|73
GreenerBuildings project was used as a starting point for the architectural model for the work in this thesis.
Unlike GreenerBuildings, this thesis solely focuses on offices, does not interact with the Smart Grid and is
deployed in actively used offices instead of a lab building [23].
There is one study in particular that precedes the work in this thesis. Georgievski et al. [22] proposed a system
to monitor and control the office environment while coupling it with the Smart Grid. The work in this thesis
differs in the fact that it does not connect with the Smart Grid and is destined to be used for a whole building
in production, rather than an isolated test site of three offices.
14|73
Chapter 3
Technical approach
In this chapter the hardware and software technologies of the system are outlined. This chapter starts with a
design overview of the system in Section 3.1, followed by an approach for the sensors and actuators of the
system in Section 3.2. Finally, an approach for the database is given in Section 3.3, followed by the message
broker in Section 3.4.
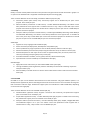
3.1 Design overview
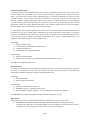
The Green Mind system has been built out of loosely coupled components that each have their own
designated tasks. This section briefly describes each component that is depicted in Figure 3.1. The components
communicate with each other asynchronously through the Kafka message queue. In Chapter 4, these
components will be explained in more detail. The architecture of the system is briefly addressed by this section
in order of the layers (bottom-up) that are shown in Figure 3.1.
Figure 3.1: Architectural overview of the Green Mind system.
15|73
The typical operation cycle is as follows: the SAGW and SMS send messages to the context based on the
changed values from their sensors and actuators; the context processes these messages to create new
variables and sends the variables to the controller; the controller looks up the rules and executes them based
on the received variables; messages that require action taken are then sent from the controller to actuator;
the orchestrator then sends commands to either the SMS or SAGW, depending on the received message; the
SMS or SAGW then executes the requested action (e.g., turn off the Plugwise device); the cycle repeats. The
components do not wait until a full cycle is completed (e.g., a change in the sensor value can occur at any
moment).
3.1.1 Physical layer
All the different kinds of sensors and actuators are located in the physical layer. A sensor measures a quantity
(e.g., light, movement) that can be read by an external component, whereas an actuator performs actions
based on commands from an external component (e.g., turn on the power, put a computer to hibernate).
These sensors and actuators can be accessed through the sensor and actuator gateway (SAGW), which
provides custom interfaces to all the sensors and actuators so that the system can easily access the
functionality of the actuators and sensors, no matter the vendor or version of the hardware. Components in
the physical layer only gather information from the sensors and actuators and merely allow the higher layers
to easily access the sensors and actuators. The SAGW has currently only support for two sensors and
actuators, namely the PC client and the Plugwise interface. Other sensors and actuators can be added when
needed. The PC client is responsible for detecting activity on the computer and changing the state of the
computer (i.e., on, off, hibernate or sleep). The Plugwise interface is responsible for easy access to the
Plugwise devices that can request the energy consumption and also change the state of the Plugwise devices
(i.e., on, off).
3.1.2 Service layer
Components in the service layer use the functionality of the physical layer to provide added value for the
higher layers. The service components provide functionality that exceeds the 'get and set' level of the physical
layer and simplifies sensor and actuator access even further. Some components create new output themselves
(e.g., when processing and converting the consumption data from the Plugwise devices), while others just
process high level commands and translate those to commands that can be used by the SAGW. For example,
the context component creates new variables (e.g., room occupancy) by combining information received from
multiple sources, such as the sleep management server (SMS) and the SAGW. The SMS enables (through the
SAGW PC client) the orchestrator to manage the state of the connected computers, and provides information
about activity on the computers to the context component. The orchestrator is also able to change the state of
the Plugwise devices through the SAGW Plugwise interface. The consumption component uses the SAGW
Plugwise interface also, namely to measure the energy consumption of the devices that are connected to the
Plugwise devices.
3.1.3 Persistence layer
The persistence layer acts as a system wide long term storage. The data is stored by the components in such a
way that it can easily be accessed in the future. The storage can also be used by components to store their
state in, so that a component can always continue from the previous state if necessary (e.g., in the case of a
hardware failure). The main data stored in OrientDB is the energy consumption measured by the consumption
component, the variables created by the context, the rules from the controller, the user information from the
dashboard, and the state of the connected Plugwise devices from the SAGW. Each component also registers
16|73
itself to the ZooKeeper instance, so components can find each other if needed and also determine if all
components are online.
3.1.4 Logic layer
The components belonging to the logic level are the high level components. These components use all the
available data and functionality from the lower layers in order to make calculated decisions about the state of
devices. This is also the layer where the system management components are located. The controller is the
component responsible for providing the system with the ability to automate the sensor and actuator
behavior, which can possibly influence the energy consumption. The main function of the dashboard and
mobile app is to raise awareness of the energy consumption to the employees.
3.2 Sensors and actuators
The sensors and actuators are necessary to provide energy consumption tracking and to potentially reduce the
energy consumption. These sensors and actuators need to create enough energy savings in order to justify
their costs.
3.2.1 Inventory
An inventory of sensors and actuators that are feasible (technically, monetarily and privacy wise) to integrate
into the system are described in this subsection. Each sensor and actuator has advantages and disadvantages
that will be used as the input for the eventual approach.
Seat pressure sensor
A seat pressure sensor can be placed at a location where it can detect the pressure of an occupant sitting on
the seat. This can either be inside, below or on top of the seat. As soon as an occupant sits on the seat, the
seat pressure sensor detects the weight and signals it to the receiving party.
Advantages
● Detect room occupancy, unless the seat is moved to another room.
Disadvantages
● Does not detect computer usage (e.g., moving the seat to another desk for a meeting).
● Not all seats are suitable for placing a seat pressure sensor (e.g., wooden seats).
● Requires significant effort and costs to install and integrate in existing environment.
Price: 65-235€ (custom built excluding development and build costs [29, 30, 31] or prefabricated [32, 33]).
Energy consumption sensor
An energy consumption sensor can detect the energy consumption of connected appliances (e.g., computer or
lights). The sensor can be placed between the appliance plug and the socket for easy installation. The sensors
can also be equipped with the ability to wirelessly switch on or off appliances, making the sensors not only
useful to actively monitor but also to influence the energy consumption.
Advantages
● Insight in the energy consumption of connected appliances.
● Switch appliances on or off (e.g., after working hours).
● Easy installation.
17|73
●
●
Wirelessly switch on or off appliances.
A power strip provides an easy and cheap way to increase the number of connected appliances (e.g.,
for connecting multiple lights).
Disadvantages
● Protrudes from the socket (in case the sensor is not integrated into the wall socket).
● Easy for users to avoid (i.e., by using another socket or by removing the energy consumption sensor).
Price: 35-65€ [6, 7].
PIR sensor
A passive infrared (PIR) sensor can be placed at a location where it can detect movement. PIR sensors only
detect movement, rather than the location of that movement. As the range and field of view of a PIR sensor is
limited, it is often placed at the ceiling in order to maximize coverage. As soon as a PIR sensor detects
movement it signals it to the receiving party.
Advantages
● Detect room occupancy.
● Easy installation.
● Unobtrusive placement.
● Available as multi sensor (light intensity and PIR).
Disadvantages
● Reliability varies (e.g., by direct sunlight or direct wind from an air conditioner or heater)
● Does not detect the location of movement.
● Requires constant movement.
● Does not detect very slow movement.
Price: 60-250€ (custom built excluding development and build costs [29, 30, 38] or prefabricated [36, 37]).
Light sensor
A light sensor can detect light intensity in low light conditions (indoor), high light conditions (outdoor) or both.
As the light intensity measured highly depends on the location of the light sensor (e.g., near a window), placing
multiple light sensors in a shared office (with different desk locations) can improve the accuracy of influencing
the energy consumption based on the light intensity.
Advantages
● Determine whether lights should be switched on or off.
● Available as multi sensor (light intensity and PIR).
Disadvantages
● Minimum acceptable light intensity level depends on the user.
● Interference with lights being switched on.
● Highly dependent on location.
Price: 55-250€ (custom built excluding development and build costs [29, 30, 40] or prefabricated [36, 37, 39]).
18|73
Computer software sensor
A computer software sensor can detect input, such as mouse and keyboard, activity of the user. As soon as the
mouse is moved, the scroll wheel used or a key is pressed, activity is registered by the computer software
sensor. The amount of time after the last registered activity can be used to determine the idle time of the
computer. However, using only the input devices to determine if a computer is idle may not be enough. For
example, consider a complex program that requires several hours to complete. One way to solve this problem
is by also monitoring the CPU and GPU usage of a computer. Another way is to allow a select group of users to
temporarily override the activity detection mechanism. The computer software sensor can also be equipped
with the ability to turn a computer off, to sleep and to hibernate.
In case of laptops, the portability aspect does not necessarily cause concerns for the computer software sensor
to function. As long as the laptop remains reachable by the other components of the system, it can still be
used to turn the laptop to sleep, hibernate, or off. The energy consumption measurements for a laptop remain
a point of interest with or without the computer software sensor (e.g., laptop is charged elsewhere or is not
plugged in at the office because of remaining battery life).
Advantages
● Detect computer usage.
● Easy installation at no additional hardware costs.
● Unobtrusive placement.
● Updatable to incorporate new features.
Disadvantages
● Requires constant activity.
● Easy for users to avoid (e.g., by killing the process of the software sensor).
Price: 0€ (excluding development costs).
Ultrasonic sensor
An ultrasonic sensor generates sound waves and evaluates their echos to measure the distance to an object.
The sensor can be placed in front of the user (faced to the office chair). Desk usage can be detected by
measuring the difference between an empty and occupied office chair.
Advantages
● Detect desk usage.
● Does not require movement.
Disadvantages
● Obtrusive placement (in front of user).
● Reliability varies (e.g., rotating the office chair).
● Does not detect computer usage (e.g., user is making notes in front of the computer).
Price: 65-75€ (custom built excluding development and build costs [29, 30, 41, 42]).
Other sensors
Several other sensors were considered but dropped for consideration for the actual approach:
● Radio frequency identification (RFID), near field communication (NFC) or WiFi tags, due to the
accompanying requirement to use badges. Badges can be lost, forgotten, and are not ideal in an open
building such as an university because of the amount of visitors and students.
19|73
●
●
●
Door sensors, due to inability to detect multiple persons in an office and due to the inaccuracy (e.g.,
standing in the door opening to simply wave to a colleague).
Cameras, due to privacy concerns.
Mobile phone tracking software, due to privacy concerns and similar disadvantages as the previously
mentioned tags.
3.2.2 Computer
The computer is the main center of activity in an office. Per computer in an office there are two variables to be
measured to determine context and to influence the energy consumption:
● Energy consumption, where either the computer and monitor are measured, for determining context,
separately or combined. A baseline measurement of the energy consumption, compared to later
measurements, can measure how effective the solution is.
● Computer usage, which consists of the idle time (i.e., the computer is powered-on but not used) and
the active time (i.e., the computer is powered-on and used). The idle and active time are both
important to determine context and to influence the energy consumption.
The following sensors can be applied for the energy consumption and computer usage:
● Energy consumption sensor
To monitor the energy consumption of the computer, monitors, or both combined.
● Ultrasonic range sensor
To determine if someone is sitting in front of the desk.
● Computer software sensor
To detect computer usage and to influence the power state (sleep, hibernate or off), which has the
potential to affect the energy consumption.
● Seat pressure sensor
To determine if someone is setting on their seat.
To measure the energy consumption of the computer, there are two possible scenarios:
1. 1x energy consumption sensor and 1x power strip. The power strip will be used to connect both
computer and monitor(s) to. The energy consumption sensor will measure the total energy
consumption of all devices connected to the power strip.
2. 2x energy consumption sensor and 1x (optional) power strip. The power strip will only used when a
computer has multiple monitors. The energy consumption sensor will measure the energy
consumption of the computer and monitors separately.
The advantage of using the second scenario is that it will be possible to turn off a monitor completely using the
energy consumption sensor. With the first scenario it will only be possible to use the standby mode of the
monitor (which still uses a small amount of energy), but the upside is that it will cost nearly half of the first
scenario. Kawamoto et al. [8, Table 5] show that an average monitor uses 1.5W (LCD) to 5W (CRT) in standby
mode, which is automatically applied by the operating system when a computer is put in S3 (commonly
referred to as standby, sleep or suspend-to-ram), S4 (commonly referred to as hibernate or suspend-to-disk),
or off. Kawamoto et al. [8, Table 3] also show that a computer and monitor have an average power-on time of
6.9 hours per day during office hours, including 3.9 hours of idling time. Studies also show [8 Table 4, 9 Table
3] that a large percentage of monitors during non-office hours are not turned off but in standby mode (40% in
Japan and 75% in US). From the observed patterns in [8], a monitor could be in standby mode for 21 hours a
day. With CRT monitors discontinued for years, the LCD monitor is widely used in offices. With 21 hours per
day in standby mode, this results in a total of 0.0315 kWh potential waste each day. With energy prices per
kWh being an estimated 0.23€ [46], each monitor costs roughly 0.0073€ each day. As the energy consumption
20|73
sensors start at 35€ it would take more than 13 years to break-even, resulting in a low return on investment.
To reduce complexity and due to the low return on investment of the second scenario, the decision was made
to use the first scenario.
To measure computer usage and influence the energy consumption of the computer, there are two possible
scenarios:
1. 1x ultrasonic range sensor, 1x seat pressure sensor and 1x computer software sensor. As single
sensors, the ultrasonic range sensor and seat pressure sensor both have severe shortcomings, but
reliable computer usage detection can be achieved by combining both sensors.
2. 1x computer software sensor. The computer software sensor will measure the amount of time the pc
is idle.
Based on the computer usage, and particularly when the computer is not being used, the computer's power
status (i.e., on, S3, S4 or off) can be changed to influence the energy consumption. In both scenarios can the
computer software sensor be used to put the computer in a different power status to achieve potential energy
savings, whereas the operating system will automatically put the monitor in standby mode when the power
status of the computer changes. In the second scenario the computer software sensor can detect computer
usage (e.g., by monitoring the input devices), even though it can also be used to improve the accuracy of the
first scenario. The other two sensors of the first scenario both have their shortcomings, but combining the
sensors can achieve reliable computer usage detection. The advantage of using these two sensors, especially
when combined with the computer software sensor, is that computer usage can be detected almost instantly
and also with better accuracy compared to the second scenario. The main shortcoming of the second scenario
is that acting upon detecting when the computer is not being used cannot happen instantly. For example,
when only input devices are used for computer usage detection, it is unlikely that the user is constantly using
the input devices of the computer. A delay (e.g., 10 minutes) can partially solve this, although a delay will
never achieve the same accurate results as using the first scenario. However, as the first scenario already costs
roughly 130€ (without the required computer software sensor) and because it would still need a delay (e.g.,
the user is only grabbing a piece of paper from a drawer), the decision was made to use the second scenario.
3.2.3 Lighting
Lights are used throughout the whole building, not only the office lights can be influenced but also the lights in
the hallways. For the lights in the building there are three variables to be measured to determine context and
to influence the energy consumption:
● Movement, to determine context and influence the energy consumption. The movement can be used
to determine whether lights should be switched on or off.
● Energy consumption, where the measurement, for determining context, can either be done over a
single light or multiple lights at the same time. A baseline measurement of the energy consumption,
compared to later measurements, can measure how effective the solution is.
● Light intensity, where the value can be used to determine whether lights should be switched on or
off. The light intensity is important to determine context and to influence the energy consumption.
The following sensors can be applied to measure movement, energy consumption and light intensity:
● Light sensor
To measure the light intensity (in lux) near the location of the sensor.
● Energy consumption sensor
To monitor the energy consumption of the lights, either over a single light or multiple lights at the
same time.
21|73
●
PIR sensor
To determine if a room (or hallway) is occupied or not.
To influence the energy consumption of the lights, there is three possible scenario:
1. Ax energy consumption sensor, Bx light sensor and Cx (optional) power strip, where the values of A,
B and C depend on the situation of the lights.
2. Ax energy consumption sensor, Bx light sensor, Cx PIR sensor and Dx (optional) power strip, where
the values of A, B, C and D depend on the situation of the lights.
3. Ax energy consumption sensor, Bx PIR sensor and Cx (optional) power strip, where the values of A, B
and C depend on the situation of the lights.
The type and amount of sensors required per location depend on the situation. For a busy hallway one light
sensor and one energy consumption sensor, with a power strip to connects all lights, can suffice to maximize
potential energy savings. On another hand, a hallway that is not often used can use a PIR sensor instead of a
light sensor. In case the situation requires a light sensor, the energy consumption sensor can be used to switch
off the lights when the intensity measured is greater than a predefined value. The measured intensity from the
light sensor can also be used to switch on the lights using the energy consumption sensor when the value is
below the predefined value. On the other hand, the PIR sensor can be used for locations such as rooms and
hallways, where lights should be switched on when movement is detected. As PIR sensors only detect constant
movement, a delay is often required to have the lights not constantly switch between on and off. Multiple
possibilities of switching lights on or off are achievable in case both a light sensor and PIR sensor, combined
with an energy consumption sensor, are used. To maximize the potential energy savings in this case, it is
recommended to let the PIR sensor have priority over the light sensor when the light intensity is under a
predefined value, and to let the light sensor have priority over the PIR sensor when the light intensity is above
a predefined value. In general, the key elements to decide the sensors for a location are the amount of users
that pass through the area, the amount of daylight entering the area, the type of area, and the personal
preferences of the users. This resulted in the decision to have the ability to use all three possible scenarios.
3.2.4 Other
There are other devices (e.g., a beamer, a warm water boiler and an oven/microwave) that are not available in
high quantities but that are still very common in office environments and used very regularly throughout the
day. These devices can be turned off outside office hours to save power. For these devices there is at least one
variable to be measured to determine the context:
● Energy consumption, where the measurement, for determining context, can be done over each
device. A baseline measurement of the energy consumption, compared to later measurements, can
measure how effective the solution is.
● Variable X, where X can be used to influence the energy consumption of a device. The only
requirement for the variable is that a sensor is required for the measurements.
The following sensors can be applied to measure movement, energy consumption and light intensity:
● Energy consumption sensor
To monitor the energy consumption of the device.
● Sensor X
To measure variable X.
Even though these devices are not placed in the computer and lighting category, it is always possible to include
other variables (e.g., movement) or sensors (e.g., PIR sensor) that can be used to influence the energy
consumption. Scenarios of using sensors other than the energy consumption sensor depend on the type of
22|73
device. Most devices are only used during office hours and can be switched off safely otherwise, whereas
other devices can maximize their potential energy savings by using additional sensors (e.g., using a PIR sensor
to only enable the stereo system when movement is detected). In all possible scenarios is an energy
consumption sensor required to determine how effective the solution is.
3.3 Databases
The database is necessary to store and retrieve the data (e.g., the sensor measurements) for the components
of the system. The data can be stored in traditional - relational - databases using tables. The primary difference
is that in a graph database the relationships are stored at an individual record level, whereas in a relational
database the structure is defined at a higher level (i.e., the table definitions). One of the main advantages is
that graph databases provides index-free adjacency (i.e., graph traversals can be performed with no index
lookups) that can lead to a much better performance. Each sensor measurement contains relationships to
other data such as the floor, building, time and date, and room or user. As a large amount (i.e., 1,000,000) of
sensor measurements with a traditional database caused severe performance issues (e.g., retrieve the total
energy consumption for a certain hour on a specific date), the decision was made to use a graph database
instead of a traditional database. This also enables the ability to use advanced queries on the stored
information, for which query languages such as SPARQL [47] and Cypher [53] have been developed.
3.3.1 Inventory
An inventory of databases are described in this subsection. Each database has advantages and disadvantages
that will be used as the input for the eventual approach. The most described graph database choices are [76,
91, 92, 93]:
● Neo4j [117].
● Titan [118].
● HyperGraphDB [119].
● AllegroGraph [120].
● DEX [121].
● InfiniteGraph [122].
● OrientDB [123].
The following graph databases were dropped for consideration after an initial review:
● Titan due to the large number of issue reports [94], (third party) licensing problems [113], and an
unpredictable fluctuating performance [114].
● HyperGraphDB due to an inadequate community [49], no replication mechanisms [96], and the time
between subsequent releases being nearly 2 years [97, 98].
● AllegroGraph due to only supporting 5 million nodes in the free version [99], an inadequate
community [101], support that is accessible only through email (e.g., no forums) [100], and a focus on
describing and interchanging metadata on the web (i.e., Resource Description Framework (RDF)
information) rather than a general purpose database [102].
● InfiniteGraph due to the pay as you go pricing starting at 4.000 EUR (the price depends on the number
of supported nodes and edges) [103], an inadequate community [104], and no replication
mechanisms [105].
The three remaining graph databases are subject to a closer review - Neo4j is described in Subsection 3.3.2,
OrientDB in Subsection 3.3.3, and DEX in Subsection 3.3.4.
23|73
3.3.2 Neo4j
Neo4j is a robust and fully ACID transactional Java persistence engine that stores data structured in graphs. It is
an open-source database that is supported and developed by Neo Technology [48].
There are three different versions of Neo4j, released for different purposes [49]:
● Community edition (GPL license). Only community support and is allowed only for open source
projects. Price: 0 EUR per year.
● Advanced edition (commercial or AGPL license) - includes Advanced Monitoring. This edition comes
with professional email support that is available 10 hours a day, 5 days a week. Both open source
projects and commercial projects are allowed. Price: 0 EUR per year for open source or 6.000 EUR per
year for commercial projects.
● Enterprise edition (commercial or AGPL license) - includes High Availability Clustering, Online Backups
and Advanced Monitoring. This edition comes with professional email support that is available 24
hours a day and 7 days a week. Both open source and commercial projects are allowed. Price: 0 EUR
per year for open source or 24.000 EUR per year for commercial projects.
Advantages
● Support for many languages and frameworks [50].
● Active community for deployment, development and problems [51].
● Used in production by large corporations such as Adobe, Mozilla, Lufthansa and Cisco [52].
● Excellent availability and horizontal (read) scaling characteristics for up to dozens of servers [54].
● Active development. A new major version comes out approximately every six months, with minor
versions (containing mostly bug fixes) every month [59].
● Great documentation available, such as guides, tutorials, videos and books [60].
● Improvements to vertical scalability are scheduled for 2013 [55].
Disadvantages
● High performance relies heavily on the available RAM of the system [56].
● The high availability clustering features (used for availability and horizontal scalability) require the
enterprise edition [57].
● Write scalability is limited. Clients can write to slave nodes but the master node remains the limited
factor [58].
3.3.3 OrientDB
OrientDB is an open source database with features from both document and graph database systems. It is
developed and supported by Orient Technologies and two of the three versions can be used free of charge for
both commercial and free usage. Professional support plans are available for 2.500 to 4.000 EUR, depending
on the license and length [64].
There are three different versions of OrientDB released [49, 50]:
● Standard edition (Apache2 license). Support is limited to the community, but professional support
plans are available. Price: 0 EUR per year.
● Graph edition (Apache2 license) - includes TinkerPop Stack [65]. Support is limited to the community,
but professional support plans are available. Price: 0 EUR per year.
● Enterprise edition (commercial license) - includes TinkerPop Stack, Query Profiler, Configurable Alerts
and Production Support for 1 year. This edition comes with professional email support that is
available 9 hours a day, 7 days a week. Price: 4.000 EUR per year.
24|73
Advantages
● Supports both document and graph data models [68].
● Uses query language similar to SQL [61].
● Support for many languages and frameworks [112].
● Distributed architecture: horizontal scalability (read and write) to improve performance and
availability [106, 107].
● Replication can be configured to use either synchronous mode (always consistent) or asynchronous
mode (eventual consistency) [106].
● Supports multi-master replication, allowing each node to read and write to the database [106].
● Great documentation available, such as guides, tutorials, videos and books [107].
● Improvements to vertical scalability (e.g., distributed transactions) are scheduled for version 2.0
which is expected to be released before the end of 2013 [79].
● Active development, a new major version comes out approximately every six months, with minor
versions (containing mostly bug fixes) every month [110, 111].
Disadvantages
● Not used in production by large corporations (only in medium sized corporations) [67].
● Scalability/replication is limited to local networks only [69, 73, 78].
● Community is not as large and active as Neo4j, but questions are usually answered within a day or
two [73].
3.3.4 DEX
DEX is a high-performance and scalable graph database system. It is developed, supported and licensed under
a proprietary license by Sparsity Technologies.
There are three different configurations for the DEX licenses available [80]:
● Size - small (up to 1 million objects), medium (up to 100 million objects), large (up to 1 billion objects)
and very large (more than 1 billion objects). Licenses can be upgraded to a higher size.
● Sessions - the number of concurrent sessions, between 1 and unlimited.
● High availability - provides horizontal scalability that allows DEX to handle larger workloads.
There are five different licenses of DEX available that have the same amount of features, depending on the
selected configurations [80]:
● Evaluation license - for personal testing purposes. The configurable size is limited to small only.
● Research license - for academic research purposes. All configurations are available, but registration is
required.
● Development license - for business testing purposes. All configurations are available, but registration
is required.
● Commercial license - for business production purposes. All configurations are available. Price: 475
EUR per year for the most basic configuration to 11.515 EUR per year for the most complete
configuration. Support hours are based on the configurable size and professional support is available
8 hours a day, 5 days a week [81].
Advantages
● Great documentation available, such as guides, tutorials and examples [109].
● Development is widely focused on multiple aspects of the database [85].
● Efficient usage of available disk and memory resources [83].
● Active development, a new major version comes out approximately every six months [112].
25|73
Disadvantages
● Does not support many languages and frameworks [66].
● Inadequate community, the number of new posts per week on the community forums are limited but
questions are usually answered within a week [87].
● Expensive compared to Neo4j and OrientDB.
● A failure of the master node leaves the system non-operational, despite a master-slave
implementation [89].
● Not used in production by large corporations, the available scenarios only describe research projects
with limited periods [88].
● There are no minor version releases [112].
3.3.5 Overview
The following guarantees must be provided by the graph database:
● Scalability. It is likely that one database will be used per building, university or company. With the
amount of sensor measurements done it is important for a database to handle increased load in such
a way that the throughput can increase when resources (e.g., more servers) are added.
● Availability. As the components of the system depend on the data that is stored in the database it is
important that the database is always accessible. Without the data important decisions cannot be
taken to influence the energy consumption and is it possible that sensor measurements from a
specific time are lost.
● Performance. If the database is unable to cope with a large amount of new sensor measurements
(i.e., the inserts are coming in at a higher rate than the database can process), it will eventually come
to a stop. The read performance is also important as the components of the system rely on the sensor
measurements. The performance of reads and writes simultaneously is important too to ensure that
all system components continue to function.
● Documentation. The documentation of the database can address topics like tutorials, how to setup
the database, drivers, language bindings, and tutorials. A database is not considered without well
written and complete documentation as there are too many uncertainties and risks involved.
● Community. An important aspect of a database is the community evolving around it. Without a
community it is often hard for users to ask questions and find tutorials about the product. A
community is also important to ensure that development continues with input from the users (e.g.,
suggest new features or submit bug reports).
● Price. A free or open-source database is preferred because of the open character of the system. This
includes not limiting the amount of possible nodes for the database.
● Usage. The usage, or adoption rate, is an important aspect of a graph database. It affects aspects such
as development (e.g., continue with input from the users or the possibility to add patches or
functionality in open-source software), stability (e.g., it is unlikely a company is going to use unstable
software in production) and support (e.g., more users available to ask and answer questions).
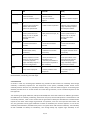
st
For each of the seven guarantees there is one graph database to provide the 1 best solution, with the other
nd
rd
two graph databases providing the 2 or 3 best solution. The guarantees are compared based on the closer
review from subsections 3.3.2, 3.3.3, and 3.3.4 and are shown in Table 3.1. A '++' denotes an exceptional
property, a '+' denotes a positive property, whereas a '-' denotes a negative property for a specific graph
database.
26|73
DEX
OrientDB
st
2
+ Read and write.
- Only local network
support.
rd
1
++ Multi-master replication.
nd
1
+ Best performance [75, 76,
77, 115].
nd
2
+ Great documentation
available.
rd
2
+ Substantial and active
community.
rd
1
+ Nearly all features are
available for free.
+ The enterprise edition is
the cheapest compared to
DEX and Neo4j.
rd
2
+ Used by medium sized
companies.
Scalability
1
+ Read and write.
+ Internet network support.
Availability
3
+ Master-slave replication.
- Master failure leaves
system non-operational.
Performance
2
- Similar performance as
Neo4j [75, 76, 77, 82] but
severely lower than
OrientDB.
Documentatio
n
2
+ Great documentation
available.
Community
3
- Smallest (but active)
community.
Price
3
- Always requires a license
unless it is only for testing
or research purposes.
- High availability requires a
separate configuration.
Usage
3
- Only research projects.
Neo4j
nd
3
- Read.
+ Internet network support.
rd
st
2
+ Master-slave replication.
- High availability requires
the enterprise edition.
st
2
- Similar performance as
DEX [75, 76, 77, 82] but
severely lower than
OrientDB.
nd
1
++ Best documentation
available.
nd
1
++ Largest and most active
community.
st
2
- Enterprise edition is the
most expensive (only for
commercial projects).
- High availability requires
the enterprise edition.
nd
1
++ Used by large sized
companies.
nd
nd
st
st
nd
st
Table 3.1 - Overview between Neo4j, DEX and OrientDB about scalability, availability, performance,
documentation, community, price and usage.
3.3.5 Conclusion
As shown in Table 3.1, the DEX graph database only provides the best solution for scalability. Even though
scalability is absolutely important for the components of the system, OrientDB provides almost similar
scalability features with the only scalability limitation being no internet network support. As the DEX graph
nd
rd
database provides the 2 or 3 best solution for all the other guarantees, it is not considered anymore for the
final approach.
The remaining two graph databases, Neo4j and OrientDB, both have best solutions for different guarantees.
OrientDB excels in scalability, availability, performance and price, whereas Neo4j excels in documentation and
community. However, Table 3.1 also shows that the guarantees of Neo4j and OrientDB are intertwined with
respect to each other. Even though all guarantees are important, some are more important than others and
also, the guarantees of two graph databases can both be satisfactory for the final approach. In case of the
scalability of the database, OrientDB clearly wins as it supports both read and write scalability. The availability
of both OrientDB and Neo4j are satisfactory, even though Neo4j only supports high availability in the
27|73
enterprise edition. In terms of performance is OrientDB a clear winner, while Neo4j has the largest community,
largest usage and by far the best documentation in terms of quantity, quality and diversity. On the other hand,
Neo4j also has the most expensive enterprise edition and is missing important functionality for scalability in
the free version. The fact that the performance and scalability of OrientDB are better and that the
documentation, usage and community of OrientDB are also sufficient led to the decision to use OrientDB
instead of Neo4j for the final approach.
3.4 Message queue
The message queue can be used by the components of the system to communicate with each other, with or
without knowing the physical location of the other components. Message queues can significantly simplify the
implementation of the separate components and also improve performance, scalability and reliability. Another
advantage of using a message queue is that the sender and receiver do not need to communicate with the
message queue at the same time as the messages are stored onto the queue until the recipient receives the
message. As a result, the communication between different components is asynchronous. The communication
between the components is further discussed in Section 4.4, whereas the communication directions between
the different components are depicted in Figure 3.1. Because of the aforementioned advantages the decision
was made to use message queues for the communication of the system.
3.4.1 Inventory
An inventory of message queues are described in this subsection. Each message queue has advantages and
disadvantages that will be used as the input for the eventual approach. The most described message queue
choices are [132, 133, 134, 135, 136]:
● ActiveMQ [124].
● Zer0MQ [125].
● Kafka [126].
● RabbitMQ [127].
● Qpid [128].
● Amazon SQS [129].
● HornetQ [130].
● Apollo [131].
The following message brokers were dropped for consideration after an initial review:
● Zer0MQ due to having no guaranteed delivery of messages [137] and that most functionality requires
you to implement and combine various components of Zer0MQ [138].
● Apollo due to an inadequate documentation [131] and community [149, 150].
● Amazon SQS due to being software as a service (SaaS) only [139] and having a pay-as-you-go pricing
scheme [140].
● Qpid due to number of bug reports [141] and having an inadequate community [142, 143].
● ActiveMQ due to the number of user complaints [145, 146, 147] and having a low performance [135,
136, 144].
The three remaining message queues are subject to a closer review - RabbitMQ is described in Subsection
3.4.2, Kafka in Subsection 3.4.3, and HornetQ in Subsection 3.4.4.
28|73
3.4.2 RabbitMQ
RabbitMQ is an open source enterprise messaging queue based on the emerging AMQP [183] standard.
RabbitMQ is developed and supported by GoPivotal Inc., whereas VMWare provides a commercial licensed
release of RabbitMQ under the vFabric™ brand name [151]. Professional support plans are available by both
GoPivotal Inc. and VMWare for undisclosed prices.
Advantages
rd
nd
● Largest community compared to Kafka (3 ) and HornetQ (2 ) [167, 168, 169, 170, 171, 172].
● Professional support available by two companies.
● Well written and complete documentation [173, 174].
● Used by large companies such as VMWare [176], Nokia [176], Huffington Post [176], Aadhaar [176],
Digg [178] and NASA [178].
● Replication support for a cluster [180].
● Uses master-slave for high availability/scalability [156].
Disadvantages
● The amount of configuration required for high availability/scalability [156].
● Clients can only write to the master node [132, 156, 182].
3.4.3 Kafka
Kafka is an open source high-throughput publish-subscribe messaging queue that is scalable, durable and faulttolerant by design. Kafka was originally developed at LinkedIn [152] before it became an Apache project.
LinkedIn is still involved in the development of Kafka and uses Kafka internally for several processes [153].
Advantages
● High availability/scalability is built in and easy to setup [157].
● The client maintains what was received and can request previous messages (e.g., at startup) if needed
[159].
nd
rd
● The setup and code required is the easiest compared to RabbitMQ (2 ) and HornetQ (3 ) [163, 164,
165].
● Well written and complete documentation [161, 162].
● Used by large companies such as LinkedIn, Twitter, Tumblr, Foursquare, Netflix and Mozilla [166].
nd
rd
● Best performance compared to RabbitMQ (2 ) and HornetQ (3 ) [135, 136, 143, 144, 175].
● Uses a variant of master-slave for high availability/scalability [153, 159].
● Clients can write to each node [159].
● Replication support for a cluster [159].
Disadvantages
st
nd
● Smallest community compared to RabbitMQ (1 ) and HornetQ (2 ) [167, 168, 169, 170, 171, 172].
● Requires external application (i.e., Zookeeper) for discovering message topics and nodes [159].
● No professional support available.
3.4.4 HornetQ
HornetQ is an open source multi-protocol and asynchronous messaging system designed with usability in
mind. HornetQ was originally developed as JBoss Messaging 2.0 and is currently developed by the community
with assistance from a small team located at Red Hat/JBoss [154]. Red Hat/JBoss also provides professional
support for HornetQ through their regular subscription model [155].
29|73
Advantages
● Professional support available by two companies [155].
● Replication support for a cluster [181].
● Clients can write to each node [181].
● Uses a variant of master-slave for high availability/scalability [181].
rd
● Larger community compared to Kafka (3 ) [167, 168, 169, 170, 171, 172].
Disadvantages
● The amount of configuration required for high availability/scalability [158].
● Large, but unreadable and complex documentation (e.g., often no explanations, lack of structured
online examples) [160].
st
nd
● Lowest performance compared to Kafka (1 ) and RabbitMQ (2 ) [135, 136, 143, 144, 175].
● Not used by large companies except for Last.fm [179].
● Requires shared storage for scalability that is accessible by all nodes [181].
3.4.5 Overview
The following guarantees must be provided by the message queue:
● Scalability. It is likely that one message queue will be used per building, university or company. With
the amount of messages sent (e.g., sensor measurements) it is important for a message queue to
handle increased load in such a way that the throughput can increase when resources (e.g., more
servers) are added.
● Availability. As the components of the system depend on the data that is sent through the message
queue it is important that the message queue is always accessible. Without the data important
decisions cannot be taken to influence the energy consumption.
● Performance. If the message queue is unable to cope with a large amount of data sent through the
message queue (i.e., the data is coming in at a higher rate than the message queue can process), it
will eventually come to a stop.
● Documentation. The documentation of the message queue can address topics like tutorials, how to
setup the message queue, and tutorials. A message queue is not considered without well written and
complete documentation as there are too many uncertainties and risks involved.
● Community. An important aspect of a message queue is the community evolving around it. Without a
community it is often hard for users to ask questions and find tutorials about the product. A
community is also important to ensure that development continues with input from the users (e.g.,
suggest new features or submit bug reports).
● Usage. The usage, or adoption rate, is an important aspect of a message queue. It affects aspects such
as development (e.g., continue with input from the users or the possibility to add patches or
functionality in open-source software), stability (e.g., it is unlikely a company is going to use unstable
software in production) and support (e.g., more users available to ask and answer questions).
st
For each of the six guarantees there is one message queue to provide the 1 best solution, with the other two
nd
rd
message queues providing the 2 or 3 best solution. The guarantees are compared based on the closer
review from subsections 3.4.2, 3.4.3, and 3.4.4 and are shown in Table 3.2. The scalability and availability
guarantees are grouped together in Table 3.2 because of their related properties. A '++' denotes an
exceptional property, a '+' denotes a positive property, whereas a '-' denotes a negative property for a specific
message queue. Regarding the scalability and performance guarantees for the Green Mind system, there are
no specifics about the actual requirement for these guarantees due to several reasons. The main reasons are
that the amount of messages highly depend on the number of sensors and actuators (currently undecided),
how often the measured quantities change from the sensors, and the deployed scale of the system.
30|73
Regardless, the scalability and the performance are an important aspect of the system, especially when it is
likely that one message queue instance will be used per building, or even for a whole university.
RabbitMQ
Kafka
nd
1
++ Can send to each node.
+ Amount of configuration.
nd
1
++ Best performance
compared to RabbitMQ and
HornetQ.
st
2
+ Great documentation
available.
st
3
- Smallest (but active)
community.
st
1
+ Used by large sized
companies.
Scalability
and
Availability
2
+ Can send to master.
- Amount of configuration.
Performance
2
+ Second best performance
compared to Kafka and
HornetQ.
Documentatio
n
1
++ Best documentation
available.
Community
1
++ Largest and most active
community.
Usage
1
+ Used by large sized
companies.
HornetQ
st
2
++ Can send to each node.
- Requires shared storage.
- Amount of configuration.
nd
st
3
- Worst performance
compared to RabbitMQ and
Kafka.
nd
3
- Worst documentation
available.
rd
2
+ Substantial and active
community.
st
2
- Used by almost no (large)
companies.
rd
rd
nd
nd
Table 3.2 - Overview between RabbitMQ, Kafka and HornetQ about scalability and availability, performance,
documentation, community and usage.
3.4.6 Conclusion
HornetQ never provides the best solution for any of the six guarantees, as shown in Table 3.2. While providing
the second best solution for usage, community, scalability and availability, it also provides the worst solution
for performance and documentation. As RabbitMQ and Kafka both provide better or equal solutions for all six
guarantees, the decision was made to not consider HornetQ anymore for the final approach.
The remaining two memory queues, RabbitMQ and Kafka, provide an equal amount of best solutions.
RabbitMQ provides the best solution for documentation, community and (shared) usage, whereas Kafka
provides the best solution for scalability and availability, performance and (shared) usage. However, not all
guarantees have the same importance and there are also guarantees that are satisfactory for the final
approach for both remaining memory queues. The documentation of RabbitMQ is better and the community
larger, but the documentation and community of Kafka are satisfactory too. In terms of the performance,
scalability and availability is Kafka the clear winner. The fact the scalability and availability of Kafka are better
than that of RabbitMQ and that the performance of Kafka is at least two times that of RabbitMQ [175] led to
the decision to use Kafka instead of RabbitMQ for the final approach.
31|73
Chapter 4
Implementation
Chapter 4 describes the office environment and the architecture of the Green Mind system that was installed
to monitor and influence the energy consumption.
First, in Section 4.1, the layout of the offices is introduced in order to give a better understanding of the
operating environment and the scale. Then an overview is given of the complete architecture in Section 4.2
before discussing the individual components in detail in Section 4.3. Finally, Section 4.4 handles the
communication between the components and how the components find each other.
4.1 Office environment
The main area to be controlled is located on the top fifth floor of the Bernoulliborg building and consists of two
adjacent corridors that connect in a right angle at the north-east corner of the building (⌋ ). In total twelve
areas are controlled by the system, located on the fifth floor and connected to each other through the two
included hallways. The areas that are controlled by the system are as follows:
● 8x office.
● 2x hallway.
● 1x kitchen area.
● 1x meeting area.
The first eight offices pertain to employees from the Distributed Systems group at the university. After the
system is tested and found stable, more offices from the university are going to be connected the Green Mind
system.
Figure 4.1: Map of the offices and kitchen area on the east side of the fifth floor.
The east side of the fifth floor consists out of four offices and a kitchen area. The offices give room to one or
more employees. Figure 4.1 shows the layout of the workplaces and light fixtures in those offices as well as the
kitchen area.
32|73
Figure 4.2 shows the layout of the north wing, which contains the other half of the environment controlled by
the system. The right side of the hallway in Figure 4.1 connects to the bottom of the hallway in Figure 4.2. The
layout of the workplaces and light fixtures in the north wing is depicted in Figure 4.2. The north wing houses
four offices and one meeting area.
Figure 4.2: Map of the offices and meeting area on the north wing of the fifth floor.
4.1.1 Kitchen area
The kitchen area is a common social area where office workers mostly meet during lunch breaks to use the
microwave or to get their food from the fridge. The kitchen has the following types of appliances that can be
controlled:
● 1x fridge.
● 1x water boiler.
● 1x microwave.
● 1x coffee machine.
33|73
4.1.2 Meeting area
The meeting area is a designated office for holding discussions and presentations. The meeting area does not
contain any equipment except for a projector. The following types of devices can be controlled for the meeting
area:
● 1x lighting fixture.
● 1x outlet strip (for portable devices).
4.1.3 Office
Offices are the most common areas and differ in size, shape, interior and occupancy throughout the building.
Despite the different design the general usage remains the same and thus the following can be controlled
inside an office:
● N computer and appliances, where N depends on the amount of workplaces and people in an office.
● 1x lighting fixture.
It is worth noting that the systems of the university, and the portable devices of the employees, run different
operating systems. This is not only important in the case of putting computers in standby but also for the
implementation of the Green Mind system itself because the system has to run on all the systems of the
university.
4.1.4 Hallway
Hallways are the common entrance halls that run between the different areas. The hallways allow entrance to
the offices, kitchen area and meeting area that are controlled by the system. In total there are two hallways
being controlled, which are depicted in Figures 4.1 and 4.2. The following types of devices can be controlled
for each hallway:
● 1x lighting fixture.
4.2 Architecture
The Green Mind system has been built out of loosely coupled components that each have their own
designated tasks. These components need to work on the systems of the university, which consist out of
different hardware and operating systems. The majority of the components were therefore written in Java
because an easy to understand cross platform programming language was preferred and Java was already
commonly used in the Distributed Systems group at the university. There are two exceptions, the backend of
the Dashboard & Mobile App was developed in Python and the PC client was developed in C++ to eliminate the
dependency to install Java on each system.
In Section 3.1 a design overview was briefly addressed about the components and basic architecture. The
components will be explained in detail in Section 4.3, but first the overall architecture of the system is
addressed in the order of the layers (bottom-up) that are shown in Figure 3.1.
4.2.1 Physical layer
All the different kinds of sensors and actuators are located in the physical layer. These sensors can be accessed
through the sensor and actuator gateway (SAGW), which provides custom interfaces to all the sensors, so that
the system can easily access the functionality of the actuators and sensors no matter the vendor or version of
the hardware. Components in the physical layer only gather information from the sensors and actuators. They
do not process the reading or send out commands by themselves, the components merely allow the higher
layers to easily access the sensors and actuators. By allowing access to devices in the physical layer instead of
34|73
having higher components access them directly (e.g., through the use of shared software libraries or other
common code for the individual sensor interfaces) it becomes easier to maintain and update the code of the
interfaces without significant chances ending up with different kinds of implementations per component or
that fixes are not being shared with developers of other components. Another reason to use a physical layer is
that devices exist that can only be accessed through one physical location (e.g., a USB stick is required to
access the connected devices) or accessed by one component at a time (e.g., a serial port connection that
cannot be shared). The complexity of the diversity of sensors and actuators is also something that the
developers of other components should not have to deal with.
4.2.2 Service layer
Components in the service layer use the functionality of the physical layer to provide added value for the
higher layers. The service components provide functionality that exceeds the 'get and set' level of the physical
layer and simplifies sensor and actuator access even further. Some components create new output themselves
(e.g., when processing and converting the consumption data from the Plugwise devices), while others just
process high level commands and translate those to commands that can be used by the SAGW.
4.2.3 Persistence layer
The persistence layer acts as a system wide long term storage. The data is stored by the components in such a
way that it can easily be accessed in the future. The storage can also be used by components to store their
state in, so that a component can always continue from the previous state if necessary (e.g., in the case of a
hardware failure). The separation of the storage into the persistence layer makes it easier to manage the
storage for all the components combined, instead of each component managing their own storage system.
Another advantage of using one storage is the potential to increase availability and stability of the system by
adding more servers, as it is possible that individual components will not expand their storage system unless
absolutely needed (e.g., performance of an individual server becomes too low).
Figure 3.1 shows the persistence layer above the physical and service layer. Typically the persistence layer is
one of the lowest layers because the only purpose is the storage and retrieval of data. Figure 3.1 differs from
the typical order merely for the sake of keeping the design of the figure easy to understand while still showing
all the connections to the storage. Based on importance and functionality the persistence layer could be
placed at the same level as the physical layer.
4.2.4 Logic layer
The components belonging to the logic level are the high level components. These components use all the
available data and functionality from the lower layers in order to make calculated decisions about the state of
devices. This is also the layer where the system management components are located. Usually components in
the logic layer have, or would benefit from, a full fletched graphical user interface as opposed to the lower
level components where a console application suffices. Even though the input is coming from the lower layers
to the logic layer, the processed data in the logic layer (i.e., output) will be used as input for the lower layers in
turn.
4.3 Components
This section describes the function of the individual components from the different layers of the Green Mind
system. All the components are loosely coupled, which means that components can operate independently of
each other. The added advantage is that the other components can remain running if another component fails
35|73
(or wait until the failed component is online again). Loose coupling also means that components find each
other at runtime as opposed to static compile-time binding. The components communicate through a common
message topic to make it easier to replace components or to run multiple instances in the future (e.g., if a
single component becomes a bottleneck). Communication between the components is done with a Kafka
message queue which is accessible by the components through ZooKeeper. The communication is further
discussed in Section 4.4.
4.3.1 OrientDB
After careful consideration (see Section 3.2) OrientDB was picked as the main storage facilitator for the whole
Green Mind system. For some components is communication not enough and the data they create is not only
important at the moment of creation but also for later reference (e.g., for research or presentational
purposes). This historical data needs to be stored in a central place so that other components can also access
this common data without the help of communication from other components. By relying heavily on other
components the chance of losing data increases because when there are more components there are also
more possible points of failure. By providing a storage system (especially with data replication, such as
OrientDB, to increase reliability and availability) it is not always necessary to go through the different
components to gather the required data.
A good example of important data is the indirect cooperation between the consumption component and the
dashboard & mobile app component. The dashboard & mobile app component uses the gathered data from
the consumption component to present the user with graphs and other statistics about the energy
consumption. Instead of having the consumption component communicate all the new consumption
measurements to the dashboard & mobile app component directly (which would then also need to store it
somewhere to show historical data), the consumption measurements are stored in the database directly. The
dashboard & mobile app then retrieves this data from the database on request.
Other data that is also stored in the database are the rules of the controller component, the variables of the
context component, the sensor list that is maintained by the SAGW and user management of the dashboard &
mobile app component.
4.3.2 Sensor and actuator gateway
Sensors and actuators are an important part of the Green Mind system. Without the sensors there is no data
for components to base their decisions upon and without actuators it is not possible to influence the energy
consumption. A big concern with the sensors and actuators is that they return different types of values and
that the method of retrieving those values differs per vendor. On top of that do the sensors and actuators
often not easily interact with software and require extra effort is to easily interact with them (e.g., through
Java). Because the Green Mind system is currently a research framework in particular, with the initial
implementation running at the University of Groningen, it is almost certain that different hardware will be
added in the future.
The SAGW is designed to generalize and simplify access to sensors and actuators for the other, high level,
components. Low level communication, such as serial communication with the Plugwise devices, is
implemented in different interfaces which the SAGW uses to execute the commands and requests from the
other components. The SAGW also converts any encoded values, such as hexadecimal representations, to
useful values because conversion often depends on the implementation of the sensors and actuators and
higher level components should not be bothered with this conversion. Instead of the high level components
communicating with a specific component of each specific sensor (which is likely to change in the future), they
36|73
communicate with the SAGW only. The main advantage is that only a new interface has to be added to the
SAGW when a new sensor is added, making sensors a lot easier to manage. For the Plugwise devices a
completely new implementation was written in Java to be able to turn devices on and off, as well as retrieving
the consumption information for all the available devices.
The sensors or actuators for the SAGW are also not limited to hardware only. In the case of the sleep
management server (SMS) component it was necessary to run a small piece of software on the workstation
computers to determine if a computer was being used (active or idle state) or to put the computer into
another state (on, sleep, hibernate and off). The abilities of the software installed on the workstation
computers are handled by the SAGW just like any other actuator.
Components communicate with the SAGW through a Kafka message queue and JavaScript Object Notation
(JSON) objects. JSON is text-based and designed for human-readable data interchange. REST would have been
a valid alternative for communication between the components, but a message queue has several important
advantages compared to REST (e.g., allows for better scalability, can persist the messages that are sent, allows
clients to receive pending messages after a failure [184]). Kafka easily integrates with ZooKeeper and also
allows the SAGW to easily communicate to multiple components, which is especially useful when other
components also need to be notified when the state of a device changes (e.g., the context component can be
notified instantly when the orchestrator component changes the state of a device) to eliminate the need for
polling the state of devices continuously.
4.3.3 Consumption measurement
Plugwise devices are used to measure the consumption of devices or to turn connected device on or off. Each
Plugwise device has three different buffers that contain consumption data:
1. A 1 second buffer that contains the energy consumption of the last second.
2. A 8 seconds buffer that contains the energy consumption of the past 8 seconds.
3. A history buffer that stores the energy consumption per hour for more than a year.
An older and smaller research project at the University of Groningen [188] retrieved the one and eight seconds
buffers at a fixed interval, but in the larger office environment this turned out to be impractical due to the
extra processing time needed for the larger amount of Plugwise devices. The latency of the Plugwise Zigbee
network also increased due to the increased spread of the Plugwise devices relative to other Plugwise devices
and the architectural obstructions between the Plugwise devices. Plugwise also notes that the one and eight
seconds buffers are not as reliable as the hourly intervals and the hourly intervals should always be preferred
for precise measurements.
The consumption component uses the history buffer instead of the one or eight second buffers to limit the
network traffic and processing load. Upon request, the log address of the log that contains the desired hour
(e.g., the previous hour) is passed along. Each log address points to four entries of an hour (e.g., when
requesting the consumption for 14:00 a response could contain 11:00, 12:00, 13:00 and 14:00, depending on
the log address used for the request). The consumption component requests the historic data once every hour
from the SAGW and continues retrieving entries until the last history entry that is stored in the database is
reached.
By requesting all history logs until the last log that was stored in the database it is also no longer an issue when
the consumption component fails, the Plugwise devices will continue to monitor the energy consumption and
when the consumption component restarts it will simply gather all the missing data. The same also applies
when the network of the Plugwise devices is temporarily unreachable. When the network connection is
37|73
reestablished the consumption component will retrieve everything until the last stored history log in the
database.
Even though the consumption component works closely together with the SAGW to retrieve the consumption
measurement data, it is not part of the SAGW. Retrieved data needs to be correctly stored in the database and
old or missing history log entries also need to be retrieved. This added data management is not part of the
SAGW and thus are the energy consumption measurements handled by this separate component.
Plugwise stores data in the form of an amount of pulses, which can be converted to the corresponding watts
being consumed by the connected device(s). Figure 4.3 shows all the data in an hour entry that is returned by
the SAGW after requesting the energy consumption of a Plugwise device. Most of the values are derived from
the pulses and are stored to simplify processing for higher level components. Some sources [185, 186] indicate
that the pulses should be corrected for both the current energy consumption and the historic energy
consumption, whereas another source [187] indicates that the corrections are only used for the historic energy
consumption. However, the software developed by the manufacturer (i.e., Plugwise Source) is only using the
uncorrected values. As there is no definitive answer it was therefore opted to return both values to minimize
problems with conversions in the future. All returned values are stored in the database to make sure that no
data is lost.
{
"address": "0D060E4C",
"time": "2013-06-03T15:00:00.000+02:00",
"pulses": 974116,
"watt": 577.0219,
"kwh": 0.57702184,
"correctedpulses": 558222.6,
"correctedwatt": 330.66562,
"correctedkwh": 0.33066562
}
Figure 4.3: Content of an hour entry as returned by the SAGW.
4.3.4 Controller
The controller is the sole component responsible for providing the system with the ability to automate sensor
and actuator behavior, which can positively affect the energy usage. Without the controller the system is not
able to act upon the sensor and actuator variables but can only monitor and store the variables from the
sensors and actuators. By adding a component to the system that can analyze the sensor variables and control
the actuators it can read and change the state of the connected device (e.g., turn off a monitor in the
weekend), and therefore achieve potential energy savings.
Because of existing experience in the Distributed Systems group, the desire to dynamically add new commands
without the need to recompile, and the variations of user preferences (e.g., some users like their offices dark)
the decisions was made to develop a rule-based controller that uses a format that is easy to read and write.
These rules provide the ability for the system to act upon the sensor and actuator variables (e.g., in the
weekend all computers should be turned off or be in hibernate).
38|73
Because the rules are to be parsed, evaluated and executed the decision was made to use an expression
language to facilitate the querying and manipulation of Java objects at runtime. MVEL [199] was chosen after
careful consideration between several other expression language:
● ANTLR [189], which always requires a separate executable [194] and is mostly developed for treebased language recognition [189].
● Jep [190], which is only available as a trial version [195].
● JUEL [195], which has no active development [197] and low performance compared to MVEL [192].
● OGNL [191], which has low performance compared to MVEL [192].
● JEXL [193], which has no active development [198] and low performance compared to MVEL [192].
MVEL provides the controller with the ability to evaluate the rules with nearly the same performance as
regular Java code and also provides a list of powerful features suitable for parsing, evaluating and executing
the rules (e.g., projections, folds, property navigation) [200].
The variables that the controller received from the context can be used in the rules. A variable contains a type
(e.g., computer), an identifier (e.g., 127.0.0.1), a name (e.g., is_idle) and a value (e.g., false). A list of all
variables and their state is initially send to the controller by the context the moment the controller is started,
whereas only the changes of the variables are send by the context afterwards. Variables from the same type
are grouped together (e.g., computers) for easy access by the rules. The controller itself provides one
additional variable that is not received from the context, namely a date variable. The date provides the rules
with the ability to use the day, month, year, hour, minute, isweekend and isweekday in their evaluations.
Through the context variables the rules can act immediately upon changes from the sensors and actuators. In
Figure 4.4 an example is depicted of a simplified rule, whereas Figure 4.5 depicts an example of an extended
rule. To distinguish between a simplified and an extended rule, the rule has to start either a # or an @.
#(misc['date'].get('hour') >= 20 && computers['127.0.0.1'].get('is_idle') == true =>
computers['127.0.0.1'].set('state', 'off'))
Figure 4.4: Example of a simplified rule to turn a computer off when it is idle and it is after 20:00.
@(Weather weather = new Weather(); if (weather.getWeatherFor('Groningen') == Weather.Cloudy) {
lights['LIGHT_1'].set('state', 'on'); })
Figure 4.5: Example of an extended rule to turn a light on when the weather is cloudy.
The simplified rules are based on a predicate, the expressions before the first =>, that should evaluate to true
before the remaining part (the expressions after the first =>) of the rule is evaluated and executed. The
variables that are set in the remaining part of the rule are immediately sent to the orchestrator after the rule is
evaluated and executed. Figure 4.4 and 4.7 only show examples of a single device, but it is also possible to
create a rule for a whole group, (e.g., a rule for all computers. Because the simplified rules are using a
predicate to determine whether or not the remaining part of the rule should be executed, it is possible to
improve the performance of such rules by determining which specific types and identifiers are used in the
predicate. For example, it is not required to evaluate a predicate of a rule that only uses computer['10.0.0.1']
when a variable change for computer['127.0.0.1'] is received from the context. All in all, the simplified rules
provide the users with an easy and fast way to act upon the sensor and actuator values to positively influence
the energy consumption.
39|73
The extended rules are direct Java code and provide the users to create rules that go beyond the possibilities
of the simplified rules. The extended rules do not feature a predicate and are always evaluated after a variable
change is received from the context due to the sheer amount of expression possibilities. However, the ability
to execute direct Java does impose a security risk that is not present with the simplified rules. Depending on
the need for more complex rules, and the gains in energy saving potential of such rules, the use of extended
rules could be justified to provide more possibilities to increase the overall energy saving potential of the
system.
Each time a new rule is added to the controller it is automatically stored to the database. After the controller is
restarted the rules are retrieved from the database and it is determined which rules use which variables in
order to improve performance for when variable changes are received from the context. The flexibility of the
rules provide the Green Mind system with the ability to achieve potential energy savings by acting upon the
sensor and actuator variables that are send by the context. The output from the controller is sent to the
orchestrator, which in turn will send a message to the SAGW or the SMS based on the input of the controller.
4.3.5 Orchestrator
In order to keep the controller as simple as possible the execution of the plans made by the controller is left to
the orchestrator. The orchestrator component acts a buffer between the physical layer and the controller and
takes care of sending the commands at the correct time, as well as the order of execution. Each plan can be
started and stopped at any time, or paused and resumed if necessary. To limit the chance of the orchestrator
component becoming a bottleneck, the orchestrator is multithreaded and implemented in such a way that
multiple instances of the orchestrator can execute simultaneously.
The orchestrator communicates with the SMS and SAGW, depending on the instructions received from the
controller. The SMS handles the requests from the orchestrator to change the state of workstations and the
SAGW handles the state change requests for the other devices. The current state change requests are
straightforward and consist out of a unique identifier for the device (e.g., a MAC address, IP address) and the
desired status of a variable. The status can be on, off, sleep, or hibernate in case of the workstations for the
SMS, whereas the possible statuses of a variable depend on the type of the device for the SAGW.
4.3.6 ZooKeeper
Not all the components of the Green Mind system are running on the same computer. One reason can be
because of hardware limitations and another reason is the importance of the geographical location (e.g.,
making sure that the person responsible for maintenance is as close to the system as possible for direct
access).
Each component registers the IP addresses and ports used with ZooKeeper at startup. ZooKeeper allows
components to find each other without the need to know the IP address of each other, which reduces the
amount of configuration necessary for each component. ZooKeeper also makes it easy for a component to find
out if all components are up and running because a component does not have a ZooKeeper entry anymore
after it fails. Integration with ZooKeeper greatly simplifies maintenance and automates discovery of the other
components. Another advantage is that Kafka uses ZooKeeper out of the box as well for the same purpose. As
Kafka also has the ability to connect to a remote ZooKeeper installation, instead of using the shipped
installation, only one installation is required for both Kafka and the components of the Green Mind system.
40|73
4.3.7 Other components
Because of the scale of the system some of the components (i.e., context, SMS and dashboard) were
implemented by other teams. The tasks of these components in the Green Mind system are discussed in this
subsection.
Context
Sensors and actuators are mostly limited to one simple task (e.g., a PIR sensor is either true or false when
there is movement). A common problem in the Bernoulliborg building is that the lights in the offices also
contain such a PIR sensor, which means that if an employee is working quietly at a desk the sensor will not
detect any movement and will turn off the lights. The task of the context is to avoid such problems by creating
a completely new variable by combining values from multiple sources. In the case of the lights this could mean
that a new variable is created called RoomOccupancy, which is set according to the activity readings from both
the computer client and the PIR sensor. This means that when the PIR sensor does not register movement and
the computer is still being used the lights will remain on. The variables generated by the context expand the
possibilities of the system even further by creating valuable additional information from the sensor input.
The context either requests or receives a notification about the changes of the sensor and actuator states
through the Kafka message queue. These states are then processed by Twitter Storm to form the new context
variables through a predefined truth table. The variables, both processed and original, are stored in the
OrientDB database and are also passed on to the controller.
SMS
The sleep management server component and the SAGW computer client were developed together. The
computer client runs on any workstation and exposes certain abilities from the computer to the Green Mind
system. Besides a value to indicate whether the computer is active or idle, is the possibility to put the
computer to sleep, hibernate, on or off included in these abilities.
The workstations and their states are managed by the SMS. When a state changes of a computer client then
the SMS will communicate with the context component by sending out a notification that the context variables
need to be updated accordingly. Other components (e.g., the orchestrator) can instruct the SMS to change the
state of a given computer, but also request information about the computer from the SMS if necessary.
The SAGW computer client was developed in C++, as opposed to Java for the other components, because
when C++ is used for development there is no need to install the Java dependency on each workstation. This
provides a faster, easier and better manageable solution that also adheres to the ICT security policy of the
university of Groningen.
Dashboard
To raise awareness and decrease energy consumption as much as possible it is important to provide feedback
or to create a social element. All the visualizations of the Green Mind system are handled by the dashboard.
Employees can view their consumption online or through a mobile app. The dashboard and mobile app
component is larger and has more diverse tasks than most of the other components. It handles both the
authentication for remote viewers and also serves all the different presentational formats to the users on the
different device types (e.g., public display in the building, applications on mobile phones).
Even though an employee can view the energy consumption of his own workstation, for a public display in the
building it is not desired to single out a specific user. With the data model used in the database for the energy
consumption (i.e., a user is located in a room and that room in turn belongs to a floor of a building) it is
41|73
possible to change the detail of the data. For public displays the dashboard will use a more general
representation such as energy consumption on a per floor or per building basis.
4.4 Communication
All the components in the Green Mind system communicate with each other through the use of JSON objects.
JSON was picked because of the good readability, simple syntax and ease of use. JSON is also less verbose than
alternatives like XML, which decreases the size of the message payloads.
Developers of components that communicate with each other dictate the content of the messages that are
communicated with each other. Depending on the data that the component requires the body of the JSON
object may change. For the sake of traceability with asynchronous communication and readability and
consistency in generic messages, a basic template was specified to which all the messages of components
should adhere. This basic template is depicted in Figure 4.6.
{
"id": "7FB0A415-7AED-440F-A4D7-EDFEB299ED2C",
"data": {
"method": "requestdevicestate",
"parameters": {
"mac": "000D6F000098C09E"
}
}
}
Figure 4.6: JSON object of a typical request.
Each request that a component sends should have an id by which the message can be uniquely identified. In
the case of the request in Figure 4.6 the id consists of a regular Globally Unique Identifier (GUID), which is a
unique reference number that can be used as an identifier. The id field can be used to couple request and
response, which is especially useful in cases where communication happens asynchronous. As a message
queue is always asynchronous the id field is mandatory to trace the response back to a request.
{
"request": "7FB0A415-7AED-440F-A4D7-EDFEB299ED2C",
"status": "success",
"data": {
"mac": "000D6F000098C09E",
"state": "on"
}
}
Figure 4.7: JSON object of a typical successful response.
When a component responds to a request it reuses the original id from the request and places it into the
request field of the response object. There is also a status field that indicates whether the component was able
to correctly process the request or not. Figure 4.7 and Figure 4.8 depict an example response message, with a
successful and an error status respectively.
42|73
{
"request": "7FB0A415-7AED-440F-A4D7-EDFEB299ED2C",
"status": "error",
"data": {
"code": 123,
"message": "PlugwiseDevice is not set to an instance of an object."
}
}
Figure 4.8: JSON object of a typical error response.
In the case of Figure 4.7 the component correctly processed the request and returned all the available data.
Figure 4.8 shows a JSON object for when the request fails or an error occurred. Instead of returning any of the
requested data, the JSON object contains a specific error code and a message that describes the problem. The
code field is internally unique for a component (e.g., code 1 might mean invalid parameter for one component
and could not find device for another), but cannot refer to more than one specific error. The status field can
have one of the three states listed in Table 4.1.
Type
Description
success
All went well and (optional) data was returned.
fail
There was a problem with the submitted data/parameters.
error
An error occurred while processing the result.
Table 4.1: The three available values for the status field in a response JSON object.
4.5 Discussion
The Green Mind system has been implemented in the course of about six months and the required
components are accounted for. However, at the moment of writing the system as a whole is only partially
operational, which can only be solved by further development of the partial finished components. The
components in question are the SAGW, of which basic functionality is operational but only as a temporary
standalone component rather than the desired form as discussed in Subsection 4.3.2, and the context
component, which is unable to communicate with other components but can process variable changes and
update the context variables accordingly in test situations. These components were co-developed by two
other groups that were unable to finish the components in the time slot of this thesis.
Although it is currently not possible to test the Green Mind system over a long period of time to determine
whether it is able to lower energy consumption completely autonomously, the Green Mind system has already
been gathering consumption data for weeks and is installed and functioning in the offices. All the sensors and
actuators can be accessed through the software. The controller has been successfully tested with a dummy
context component and with that the rest of the system functioned as dictated by the architecture design.
Automation cannot function due to the incomplete SAGW and context components, but the purpose of
designing and building a system that is able to actually function in offices has been met.
By installing the Plugwise devices, that function as both sensor and actuator, the Green Mind system can reach
all the necessary sensors and actuators through the wireless ZigBee network. The computer clients also
43|73
communicate through the local TCP network and also require no additional infrastructure to be installed, as
was intended. The computer clients even function as very cheap occupancy sensors because most of the work
being done in the offices involves a workstation one way or another. These basic actuator and sensor
capabilities, combined with the knowledge of the time of day, already makes for a system capable of saving
energy in the Bernoulliborg building. Workstations can be turned off at night and in the weekend. Lights can be
turned off during the day while normally the built-in motion sensor of the office lights would still turn the
lights on, even if there is enough sunlight available.
The sensor capabilities of the Green Mind system are currently somewhat limited, but the SAGW provides the
possibility to add more sensors over time. The current system would mostly benefit from a light illuminance
sensor and a better means to detect occupancy. The light illuminance sensor would allow the system to better
manage the lighting in specific rooms according to the available sunlight, instead of only relying on the time of
day and occupancy. A big drawback of such sensors is that commercial solutions are rigid and expensive. The
current viable occupancy sensor is cheap, but has some drawbacks (e.g., no location and amount of occupants,
and are all delay-based) that limit the potential energy savings. The investment for all offices is large, especially
without proper research into the kind of sensors and their effectiveness (e.g., what is the correct positioning of
such sensors and which value ranges should be supported). For an implementation with the scale such as the
Green Mind system it might even turn out that home built sensors are able to provide a better and cheaper
solution. The main concern is that installing all kinds of sensors is expensive and potentially unnecessary. If
done correctly the installation and choosing of the sensors is a whole separate research project.
All in all the Green Mind system is capable of reaching the goals set out in the introduction. Both lighting and
devices can be monitored and controlled. The Green Mind system is a framework that allows the University of
Groningen to expand its research into sustainability in new direction, such as user awareness, and provides the
researchers with real and up-to-date data. The loose design of the system components means that it can be
enhanced over time, exceeding the goals of this initial design, and thus provides more possibilities than the
existing built-in BMS.
44|73
Chapter 5
Theoretical results
Chapter 5 presents the collected energy consumption measurements from the Green Mind system in the
office environment that was discussed in Section 4.1.
First, the measurements are presented as is in Section 5.1. The measurements presented in Section 5.1 are
without the system's ability to automatically influence the energy consumption. Using the gathered energy
consumption measurements the estimated energy saving potential of the system is discussed in Section 5.3
based on the current functionality of the Green Mind system. These potential energy savings are also
compared to previous work in Section 5.2.
For cost calculation the price of €0.07 per kWh will be maintained [201]. The cost of an individual Plugwise
device is €33 [202]. Working weeks consist of 40 hours, 8 hours per day, and 5 days in the week, totaling to
228 workdays [204] per year (after holidays). This leaves 128 hours per week (24 hours a day and 7 days a
week, minus 40 working hours) that are outside office hours.
The Bernoulliborg building is operated from 7:30 to 20:00, which is based on the measured time that the
corridor lighting is turned on. Public area equipment (e.g., coffee machine, microwave) is expected to be
online for the total 12:30 hours, which leaves a remaining 11.5 hours per day that the building is considered
empty. For a whole week this results in 105.5 hours (11.5 hours per day for 5 days per week, plus 24 hours per
day for 2 weekend days) that are outside office hours.
5.1 Consumption measurements
Over a course of six weeks, from mid-May to late July, the office environment on the fifth floor of the
Bernoulliborg has been monitored 24 hours a day and 7 days a week. Measurements are divided into two
segments. The first segment consists out of the devices located in the offices. These devices and their
consumption depends on occupancy of the offices and the usage of the devices by the staff that is located in
that specific office. The second segment consists out of the devices that are common goods. These devices are
used by multiple people and mostly remain active throughout the day, even without people being present
(e.g., hallways are always lit).
5.1.1 Offices
Two types of devices are measured in offices. There are the lights, which are grouped together to a single
Plugwise device, in case of multiple fixtures, and the workstations which have one Plugwise device each. Due
to modern monitors already having a low energy consumption in standby mode, as discussed in Subsection
3.2.2, it was decided to group the computer, monitor and any auxiliary devices in a power strip that is
connected to the workstation Plugwise device. The Green Mind computer client can put the computer into
sleep or hibernate mode. The Plugwise device only needs to be used as an actuator if it is desirable to
eliminate any remaining standby power consumption of the workstation completely.
45|73
Measured between 75-225 watt (75 watt per fixture).
Light
Common consumption pattern of two combined light fixtures in the course of one day.
Common weekly consumption pattern of two combined light fixtures in an office.
Notes:
● Maximum of three light fixtures per office.
● Fixtures already contain a PIR sensor and cannot be manually turned on or off.
Figure 5.1: Energy consumption summary of office lights.
A summary of the energy consumption of the lights in the offices is given in Figure 5.1. Important items to note
are that the monitored offices have at least two and at most three separate light fixtures. These fixtures are
already controlled by a PIR sensor in the office. This PIR sensor could not be used by the Green Mind system
and thus the Plugwise device was installed on top of the fixtures and the PIR sensor. This means that even
though the Plugwise device is turned on, the PIR sensor still needs to register movement for the lights to work.
It is not possible for the office workers to turn lights on or off manually. The effects of the PIR sensor are also
represented in the two graphs of Figure 5.1. Most noticeable at night and in the weekends where the lights do
not consume any energy, but also on regular weekdays where the lights stay on all day (even when the sun is
active) because there is movement in the office.
A single fixture consumes around 75 watt when turned on. This means that the lighting of a single office
consumes 150-225 watt per hour for around eight hours. This equals to around 1200-1800 watt per day that is
simply being wasted on a sunny day. The PIR sensor alone is not enough to save energy. With an average of 4.5
hours [203] (56% of the eight hours of work time per office) of sunlight per day and 228 workdays per year the
annual savings could amount to 153.9 kWh to 227.81 kWh per office annually.
46|73
Measured between 15-220 watt.
Workstation
Common consumption pattern of a workstation in the course of a day.
Common weekly consumption pattern for an office workstation.
Notes:
● Researchers sometimes use their workstation to run experiments.
● Common workstations still use 7-10 watt when turned off.
● Workstations are measured through a power strip that contains the computer and
monitor(s). This power strip might occasionally contain extra office appliances.
Figure 5.2: Energy consumption summary of workstations.
Workstation energy consumption is more irregular because of staff having different needs. Some workstations
contain better hardware in order to run research projects, some staff members prefer dual monitors, and
some staff member use their laptop (sometimes with an external monitor). This means that the energy
consumption ranges from around 15 watt for a small laptop to 220 watt for a dual monitor research
workstation.
The top graph in Figure 5.2 shows the hourly consumption of a standard university issued computer, which
peaks around 167 watt when all processing power is being used. On average the consumption is just above
100 watt. The slight dip around 13:00 is most likely caused by the staff member going out for lunch and
manually turning off the monitor and/or computer for the duration of the lunch. Note that the workstation still
consumes some energy outside office hours.
The week graph in Figure 5.2 shows the consumption of workstations throughout the week. Workstation 1
(WS1) is similar to the workstation from the top graph. However, workstation 2 (WS2) is used for research
purposes and thus never shuts down, not even in the weekend. WS2 poses the problem that workstations for
research are usually stocked with above average hardware to be able to process high workloads that usually
requires more energy to do so. In the monitored office environment there are multiple machines that are
47|73
powered on continuously, all belonging to the same research group. The Green Mind system could put these
devices into standby mode when they are not being used, such as weekend and nights, but as those systems
are used for research purposes this might not always be appreciated by the staff. Instead, it could be enforced
as a university policy that only designated machines can be used for long term tasks instead of allowing every
researcher to run his own local server or monitoring system. Note that the energy consumption of WS2
stabilizes in the weekend at the lowest energy consumption level, suggesting that the workstation is running
but not actively used in the weekend. In some cases it could be sufficient for staff to be able indicate time slots
where the workstation should be active. For example, in the case of a web server that is only accessed during
work hours it would be sufficient to leave that computer running all day, even when the computer client
indicates that the user is idle, but is put it in standby at night and in the weekend.
It is hard to pinpoint the amount of potential energy saving because of the amount of different hardware
being used. University workstations still consume energy when they are turned off, but a staff laptop that is
unplugged will not. When taking into account that a regular workstation still uses 7 to 10 watt per hour when
turned off, it would mean that in a 40 hour workweek 7-10 watt is being consumed 128 hours per week per
workstation for nothing. This comes down to approximately 1 kWh (22%) per workstation per week that can
be saved by turning off the workstation completely at night and in the weekend.
5.1.2 Public areas
Public devices are located in the areas adjacent to the offices. This includes the light fixtures in the corridor
and the appliances located in the kitchen area.
Measured between 2.6-510 watt.
Microwave
Common consumption pattern of the microwave oven in the course of a day.
Common weekly consumption pattern of the microwave.
Notes:
● Uses around 2.6 watt when idle.
Figure 5.3: Energy consumption summary of the kitchen microwave oven.
48|73
The microwave is used throughout the day and energy consumption peaks during lunch. Figure 5.3 shows the
energy consumption of the microwave in detail. The energy consumption of the microwave can not be called
excessive, around 2.6 watt is consumed when the microwave is idle. By turning the device completely off
outside office hours around 274 watt (2.6 watt * 105.5 hours) can be saved per week, which still adds up to
around 6% saving of its weekly energy consumption.
Measured between 38-192 watt.
Coffee machine
Common consumption pattern of the coffee machine in the course of one day.
Common weekly consumption pattern of the coffee machine.
Notes:
● Consumes 56 watt on average when idle.
● Turning it completely off might
Figure 5.4: Energy consumption summary of coffee machine in the kitchen.
Coffee machines are common in offices and Figure 5.4 shows that the idle consumption of such a device is
high, even when it is not being used. Most measurements were 58 watt, although roughly every six hours a
measurement of about 38 watt occurs when the coffee machine was idle. Thus, on average the coffee machine
uses 56 watt when there is no staff member to us it. There is no need for the coffee machine to be active
outside office hours which means a potential energy saving of 5900 watt (56 watt * 105.5 hours) per week,
which is around 50% savings of the total weekly energy consumption of the coffee machine.
Potential issues with turning off the coffee machine at night and in weekends is that the machine might not be
capable of recovering from long downtime. Besides the hardware limitations there might also be issues with
the 'freshness' of the products stored inside the machine when the power is lost over longer periods of time.
The fact remains that the monitored coffee machine consumes a substantial amount of energy at night and in
the weekend. Judging by the recommendations by Bush et al. [205] regarding the energy efficiency of coffee
machines it should be possible to disable the coffee machine completely.
49|73
Measured between 3.6-291 watt.
Fridge
Common consumption pattern of the fridge in the course of one day.
Common weekly consumption pattern of the fridge.
Notes:
● Consumes 16.6 watt on average when left undisturbed.
Figure 5.5: Energy consumption summary of the fridge in the kitchen.
The fridge in the kitchen is used to keep drinks and the lunches of the staff cooled. The daily consumption
shown in the top graph of Figure 5.5 shows that the fridge is cooled on intervals. Energy consumption rises
during offices hour when staff opens the fridge and thus more cooling is required. Energy consumption peaks
at lunch and dinner time.
The fridge cannot be turned off completely because the drinks and food in the fridge need to be cooled to stay
fresh. Previous research by the Distributed Systems of the University of Groningen has shown that the fridge is
capable of cooling sufficiently when only turned on for 15 minutes of every hour [22]. During these 15 minutes
the fridge is cooling at the maximum energy usage. Taking into account that the rated consumption of the
fridge is 70 watt, the consumption of the fridge during those 15 minutes per hour should be around 17 watt at
most. This is nearly the same as our measured average of 0.166 kWh when the fridge is left undisturbed. As
previous research in [22] also revealed that the cooling was sufficient even during the lunch hours, it would
mean that our above average consumption of the fridge during office hours could be eliminated.
On average the daily energy consumption of the fridge is around 0.4 kWh watt (the energy consumption
during the weekend in the lower graph of Figure 5.5) while during regular weekdays this amounts to 0.465
kWh. As a result, there is a difference of 0.065 kWh between a regular weekday and a day in the weekend. This
would mean a saving of 0.325 kWh (5 days * 0.065 kWh) per workweek and a yearly saving of 14.82 kWh (228
working days * 0.065 kWh) per fridge, which amount to around a potential energy saving of 10%.
50|73
Measured between 560-755 watt (when on).
Corridor
lighting
Common consumption pattern combined corridor light fixtures in the course of one day.
Common weekly consumption pattern of combined corridor light fixtures in an office.
Notes:
● Corridors are operated at building level and are only turned off completely (including
the Plugwise device) at night and in the weekend.
● Light are turned on around 7:30 and remain on till around 20:00 (± 12.50 hours).
● Always on, not operated by movement like the office lights.
Figure 5.6: Energy consumption summary of lights in the corridor.
The two hallways of the monitored office environment are so large that the two hallways have been divided
into three corridors with a Plugwise device monitoring the corresponding corridor. The hallway lighting has the
same hardware as the office lighting but the hallway lights are not controlled through an PIR sensor. Lights are
continuously lighting the hallways until they are turned off on a building level. As they are similar to the office
lighting they also have the same flaw: on sunny days they remain turned on. Figure 5.6 shows the energy
consumption of the different corridors. The consumption pattern of the corridors is identical but the amount
of fixtures in corridor 2 and corridor 3 is slightly lower than the amount grouped into corridor 1.
Both hallways consume around 1900 watt combined when turned on. This means that on a sunny day each
hour 1.9 kWh, in the monitored office environment on the fifth floor alone, could potentially be saved in
energy consumption simply by turning the hallway lighting off. Taking into account that the hallway lights are
continuously turned on when it is sunny outside there is a total energy saving potential of 1846.8 kWh (36%)
per year, with an average of 4.5 hours of sunlight per day and 228 workdays per year.
In some cases it might be desired to have more detailed control over the lighting so that it is possible to only
turn on specific fixtures and partially light the hallway. For example, in the corner where the hallway in the
51|73
east side of the building meets the hallway of the north wing there are no windows to let in sunlight and some
additional lighting might be appreciated by some staff members whereas the rest of the hallways does not
need any additional lighting.
Measured between 43-577 watt (when active).
Electric water
boiler
Common consumption pattern of the water boiler in the course of one day.
Common weekly consumption pattern of the electric water boiler.
Notes:
● Does not consume any power when not heating.
● Consumes 20 watt per hour on average when left undisturbed for a whole day.
Figure 5.7: Energy consumption summary of the electric water boiler in the kitchen.
There is also an electric water boiler installed in the kitchen area. Figure 5.7 shows the consumption
information that was measured for this boiler. The top graphs shows that the boiler uses power intermittently
to keep its content heated. This is useful during office hours when there is need for instant hot water, but not
so much at night and in the weekend when the building is empty. When no hot water is tapped from the
faucet the boiler consumes about 20 watt per hour on average per day. This continuous consumption is clearly
visible in the weekends where the consumption evens out at just below 500 watt per day, as visible in the
lower graph of Figure 5.7.
Energy can be saved by disabling the water boiler outside office hours. This would mean that 105.5 hours of
consumption can be saved. It might take time for the boiler to reheat its content completely so starting before
working hours might be necessary. This would still leave around 100 hours (roughly an hour is required, as
depicted in Figure 5.7), which adds up to 2 kWh per week, 23% of potential energy savings.
52|73
Measured between 43-577 watt (when used).
Meeting room
Common consumption pattern of the meeting room in the course of one day.
Common weekly consumption pattern of the electric water boiler.
Notes:
● Beamer is unplugged after usage.
● No other appliances are present in the room.
● Usage is sporadic.
Figure 5.8: Energy consumption summary of the meeting room.
The meeting room does not leave much room for energy saving. There are no fixed devices and users bring
their own laptops and a beamer for presentations and meetings. Usage is sporadic and unpredictable, as can
be seen in Figure 5.8. On the individual days the users on Thursday y use more energy in a short period of
time, but the users on Thursday x used the room for the whole day and consumed less per hour but more in
total. Taking everything into account, the meeting room is an interesting location for monitoring the energy
consumption but not for controlling the energy consumption.
5.2 Estimated energy saving potential and other research
In order to discuss the measurements, and the potential savings they entail when using the functionality of the
Green Mind system over a longer period of time, Table 5.1 has been created to summarize all the findings. It
should be noted that measurements were taken over a period of six weeks and not over a whole year. The
current estimated annual values are calculated based upon the average energy consumption of the actual
measured devices within and outside office hours during these six weeks, whereas the after estimated annual
values are estimated only based on the possibilities of the Green Mind system to limit the energy
consumption.
53|73
Device
Current
estimated
annual (kWh)
After
estimated
annual (kWh)
Potential annual savings
(kWh)
Potential
Savings
(%)
Light - 1 office fixture
136.8
59.85
76.95
56%
Light - 1 corridor fixture
213.75
136.8
76.95
36%
Device - water boiler
397.73
284.09
113.64
28%
Device - fridge
160.82
146
14.82
9%
Device - coffee machine
592.21
261.25
330.96
56%
Device - microwave
208.37
190.25
15.45
7%
Device - 1 workstation*
224.73
173.9
50.83
22%
* Due to diversity only the standard university issued workstation is taken into account. Research workstations consume more power and
are active 24 hours a day and 7 days a week, partial down time will at least equal or exceed the savings of a standard workstation.
Table 5.1: Summary of the potential energy saving found through the measurements.
5.2.1 Lighting
As mentioned in subsection 5.1.2, the hardware of the corridor and office lighting is the same. This means that
the potential savings are also the same when disabling the lights when the sun is out. For an office fixture this
means that around 56% of the annual energy consumption can potentially be saved. For the corridor lighting
this is only 36% because the building remains open for longer than the regular office hours and, unlike the
office lighting, the corridor fixtures are not controlled by a PIR sensor. Corridor lights are thus turned on longer
annually while the hours of sunlight are the same for both, resulting in less potential savings. The savings of
36% and 56% are substantial because they could be reached even when the installed fixtures already contain
energy efficient lighting, and offices are even only enabled by motion sensors.
According to Boyano et al. [15] lighting is the highest contributor to energy consumption in medium climate
zones, such as the Netherlands, at 50%. Through lighting control, such as taking natural light into account, they
estimate potential savings for lighting to be 22% to 42% depending on the level of automation utilized. The
proposed plan of energy saving through light sensors reached savings of 11% to 47% in a field study conducted
in open-plan offices [206]. A large multi campus building experiment, by Sheng-Yuan Yang [207], with an
energy-saving multi-agent system also managed to reach savings up to 20% for lighting.
5.2.2 Workstation
Based on the measured energy consumption of workstations that had been turned off, it should be possible to
save 22% annually per regular workstation by cutting the power to these workstations completely at night and
during weekends. For workstations it is only possible to estimate the potential energy savings for the
remaining energy consumption when the workstation is supposed to be turned off completely. This is caused
because there is no data about idle time available yet from the Green Mind system.
Other research that contained details about workstation energy savings mostly only focus on computers and
incorporate multiple stages of energy savings such as disabling monitors, putting the computer into sleep
mode and shutting down computers outside office hours. A study in Japan [8] showed that an average desktop
computer consumed around 30% of its energy during idling, and 40% in non-business hours. On the other
54|73
hand, there was the study conducted by Park et al. [208] that only showed an energy saving of 0.2% by setting
the time of power usage or by using a motion sensor to control a laptop. The multi campus building
experiment by Sheng-Yuan Yang [207] showed energy savings of 15% for computers.
5.2.3 Appliances
All the other measured devices are located in the public kitchen area, something that is present in most offices
but not explicitly mentioned in detail by other papers. The fridge and microwave have an energy saving
potential of 9% and 7% respectively. The measurements in [208] also include a microwave and the measured
energy savings for that microwave add up to 3.3%.
For the coffee machine a potential energy saving of 56% is estimated, mainly because the high energy
consumption of the machine outside office hours. The electric water boiler has the potential to save 28% of its
energy consumption. Both suffer from the flaw that they do not enter a standby mode and thus keep heating
water even without demand. No comparison material could be found for the energy consumption of the water
boiler and coffee machine.
5.3 Discussion
In this section the measurements and estimations about potential energy savings from Chapter 5 are discussed
in relation to the costs of the sensors and actuators and the usage of those sensors and actuators.
5.3.1 Reliability and applicability
Reliability and making predictions on energy consumption measurements is something that is always
debatable. The implementation of the Green Mind system has been able to reliably measure the energy
consumption of multiple devices over the course of six weeks. The next period of six weeks might differ
because of all kinds of influences (e.g., temperate, sunlight, holidays). Even during these six weeks it became
clear that the usage, and thus the energy consumption, can be irregular at times. This is especially so in the
case of the energy consumption of regular workstations when compared to workstations that are being used
for research.
Even with the irregularities the measurements and estimates are still applicable. By using averages, and taking
into account the excesses, the estimated potential energy savings give a credible and applicable scenario that
could be reached through building automation. There is no denying that the measurements presented in
Chapter 5 show that there is still unnecessary energy consumed by all the measured devices. Especially with
the motion sensors already being used by office lighting, it shows that more automation is necessary to
increase the efficiency even further.
5.3.2 Lighting
The goal of lowering the consumption of lighting by 25% can easily be reached when turning lights off when
there is enough natural light available. The estimations show that at least 36% can be saved. A potential
problem with realizing these savings is determining the right amount of light sensors and placing them
correctly in order to optimize the savings. The unique design of the blue facade of the building, which uses an
external frame on top with partially printed transparent plates attached, might limit the incoming daylight.
Light sensors and detailed occupancy models are necessary to form a better estimate. Judging by the similar
ranges (11% to 47% [15, 206]) in energy savings from other papers, and in particular the 20% energy savings on
lighting in campus buildings [207], it is safe to conclude that the goal of 25% can be reached.
55|73
The monetary savings are €5.38 (76.95 kWh * €0.07) per light fixture. When taking into account the goal to
have a return of investment within seven years this would amount to the possibility to spend around €35 per
fixture in sensor equipment. In most cases it is sufficient to group multiple fixtures together. For example, the
current installation groups two or three fixtures, that are present in a single office, together into one Plugwise
device. This leaves at least €37 (70 - 33) for the installation of one or more light sensors in the office.
5.3.3 Workstations
Research workstations consume considerably more energy than their regular counterparts and are mostly
turned on 24 hours a day and 7 days a week. The estimation, in Table 5.1, of an energy savings potential of
22% per regular workstation does not represent workstations that are used for research because they are
continuously turned on. When looking at the annual savings for all the workstations combined, including the
research workstations, the potential energy savings are likely to turn out lower. On the other hand, the
monitored offices belong mostly to the same research group and there are multiple research workstations
active 24 hours a day and 7 days a week. Depending on the research it might be possible to combine some of
these workstations. Only eliminating one of these research workstations would already save a considerable
amount of energy. The decision to turn off a research workstation, or at least put in into sleep mode, is not
something that the system can easily make on its own and requires input from the responsible researchers.
Most likely the use of research workstation specific rules would be a good compromise. For example, a
research workstation could be turned off at night but during the day (including weekends) the workstation is
expected to be operational. The detection of such research devices at least provides building management the
possibility to open such discussions with staff members to determine a reasonable policy regarding such
devices.
For a regular workstation the monetary savings will be around €3.56 (50.83 kWh * €0.07). As the goal is to
return the investment within seven years this would add up to around €24, which is not enough to cover the
cost of the installed Plugwise device. Because saving on the remaining energy consumption if the workstation
is turned off alone is not sufficient, and to reach the goals stated in the introduction, it is necessary to also
execute additional algorithms to put computers into standby modes as fast as possible. Judging that 30% of
the energy consumption is caused when the computer is idle [8] it should still be possible to reach the goal of
25% energy savings, especially when the research workstations get restrictions also. It should be noted that
the idle time is handled by the computer client, which puts the computer into sleep mode, and thus the
corresponding monetary savings do not change anything about the cost of the Plugwise device being too high.
Although the workstations on their own do not reach the goal of saving 25% of the energy consumption on
devices, the savings of the workstations combined with those of the kitchen reaches the goal. From the
workstations, nine could be classified as regular workstations. This would mean a total annual energy
consumption of 2022.57 kWh (9 * 224.73 kWh) with a total estimated potential annual saving of 457.47 kWh.
Combined with the measurements from the kitchen this would add up to 3381.7 kWh (1359.13 kWh for the
kitchen, see Subsection 5.3.4) and an estimated potential energy saving of 932.34 kWh, totaling 27.5% on
energy savings for all the devices combined.
When the research computers are also taken into account (with a total of 2848.58 kWh annually) then the
potential energy savings drastically change for the worse. With a total energy consumption of 6230.28 kWh
annually, the estimated potential savings for devices will only amount to 15% and thus miss the initial goal of
25%. On the whole building, the research to regular workstation ratio is lower and for the fifth wing of the
Bernoulliborg it should definitely be encouraged to simply not run each research workstation 24 hours a day
and 7 days a week just out of convenience.
56|73
5.3.4 Appliances
The measured appliances in the kitchen area can be divided into two categories, first there are the microwave
(7% estimated potential energy savings) and the fridge (9% estimated potential energy savings). Both
combined will save up to €2.12 annually, which gives a return on investment of 31 years for both their
Plugwise devices. The potential savings do not justify the costs of two individual Plugwise devices for the fridge
and the microwave. These potential savings are also hard to increase through further automation because the
fridge simply needs to cool its contents and the microwave only has an idle consumption of 2.6 watt. The
annual consumption of the microwave is not extremely high when compared to the other measurements,
despite the high consumption of a microwave when active, because of the short time span necessary to heat
its contents. In the case of the microwave a possible solution would be to use a single Plugwise device for both
the microwave and the coffee machine because they have a similar usage pattern.
This leaves the second category with the coffee machine and the electric water boiler, which have estimated
potential energy savings of 56% and 28% respectively. The monetary savings of the coffee machine will be €23
annually, and €161 within the goal of seven years. For the water boiler the annual monetary savings are
estimated to be €7.95, adding up to around €55 within the seven year goal.
The solution of combining the coffee machine and microwave would mean that the microwave adheres to the
powering schedule of the coffee machine, because the coffee machine needs to be active the longest per day.
For the water boiler, the envisioned schedule is the same as the coffee machines so the boiler can also be
added to the same Plugwise device to save costs.
Combined the appliances in the kitchen consume 1359.13 kWh annually, and have an estimated energy saving
potential of 474.87 kWh. This means an estimated potential energy saving of 35% combined for all the devices
in the kitchen, 34% when the savings of the fridge are left out of the equation, or 32% when both the fridge
and the microwave are left out. Either way, the microwave is best included with the coffee machine and water
boiler to at least also save some energy.
57|73
Chapter 6
Conclusion
The Green Mind system, that was designed and partially implemented for this thesis, showed that previous
research conducted by the Distributed Systems group at the University of Groningen also scales to a larger
uncontrolled office environment. The scale was not expected to be an issue but so was the cost of the system.
As it turned out there is a lot of potential energy to be saved but tracking consumption of every single device is
too expensive when using Plugwise devices. Each device is unique, but continuous monitoring is not always
necessary. It is best to group devices together where possible. An automated building management system,
such as the proposed Green Mind system, should be able to handle the repositioning of sensors and actuators
and be installed in phases to optimize the cost-benefit ratio.
The first goal of lowering the energy consumption of lighting by 25% can be reached by measuring the
available daylight and controlling the lights accordingly. The current use of motion sensors in offices to control
the lighting is insufficient and leaves much room for improvement. The estimated energy savings range from
36% for corridor lighting to 56% for office lighting.
The second goal of lowering the energy consumption of electronic devices by at least 25% can only be partially
satisfied due to the presence of research workstations that cannot save energy through simple automation. In
the category of electronic devices the potential energy savings with the Green Mind system were 56% for the
coffee machine, 28% for the water boiler, 22% for a regular workstation, 9% for the fridge, and 7% for the
microwave. Most of the potential energy savings are below the said goal of 25%, but combined they average a
potential energy saving of 27.5%. However, when the excesses of the research workstations, that are operated
24 hours a day and 7 days a week, are taken into account the potential energy savings are only 15%. In the
specific cases of specialized research workstations, tailor made rules have to be designed in consultation with
the responsible researchers in order to fully optimize the energy saving potential.
Costs of the implementation are limited to that of the hardware, such as new sensors and actuators. For this
thesis the costs are created by the purchase of the Plugwise devices. The third goal of costs being returned
within at most seven years is reached, mainly because of the annual energy savings per light fixture of an
estimated €5.38. The cost of equipping every workstation with a Plugwise sensor is not justified in every case,
but one has to take into account that the installation of multiple sensors does allow the localization of
excessive energy use. By experimenting with (temporary) sensor and actuator placement, and creating
different groupings according to the readings, the cost efficiency can be further improved.
The fruits of the thesis have provided the University of Groningen with numerous new possibilities for new
research projects through accessibility to a live testing environment of actively used offices. A new modular
system design has been introduced that allows for future incremental enhancements but is also able to
operate outside a controlled experimental environment. The currently designed functionality, limited as it may
be, is already capable of saving energy within the set goals. Through its loosely coupled component the energy
saving potential of the Green Mind system is only expected to increase over time when old components are
replaced with newer, more sophisticated components. By providing a framework that can be built upon, more
time can be put in working out the details of individual components and less time worrying about the system
architecture itself.
58|73
The estimates show that the following starting hypothesis is certainly true:
'Installing a building automation system that controls multiple occupied offices has the potential to save
energy.'
A lot of interesting research is still to be done in the field of building automation and by having a platform such
as the Green Mind system the University of Groningen is able to advance into the next stages of saving energy
through automation.
59|73
Chapter 7
Future work
Although the results presented have shown energy saving potential by using component based automation, it
could be further developed in a number of ways.
7.1 Extending and improving the sensors and actuators
In principle, the proposed sensors and actuators are able to provide the energy saving potential for the
system. However, limitations on the proposed sensors and actuators have been discussed in Chapter 3.
Perhaps by incorporating other types of sensors and actuators, such as RFID, NFC or WiFi tags to detect
occupancy and user location, it is possible to obtain more accurate results and enhance the functionalities of
the system. WiFi, RFID and NFC are all standards to establish communication between devices. It was also
shown in Chapter 3 that custom built sensors and actuators are often cheaper than their retail alternatives. By
exploring and selecting the correct sensors and actuators for a whole building the benefit-cost ratio of the
system can be maximized.
Due to time constraints the subject of optimizing the type, location and number of sensors and actuators was
only briefly examined. One of the questions that arose was the need for a light sensor in order to control the
lighting better. But such light sensors are expensive. Are light sensors best placed at a window, per desk, per
light fixture, or simply at the center of the room? Another good extension would be to make corridor lighting
motion activated, but how many sensors would be needed, with which range and where should the sensors be
placed? Questions about cost-benefit ratio and placement arise for most of the sensors and actuators, which
justifies extensive research into this part of the system specifically. Closely related to the choice of sensors is
research into the range and network latency of larger indoor wireless sensor or actuator networks.
The area of sensors and actuators clearly provides room for a lot of research into the combinations and
placement of different sensors and actuators and their overall usefulness. Perhaps the most direct extension
of this thesis is by the means of the sensors and actuators.
7.2 Comfort enhancement
In terms of functionality the system focuses on monitoring and reducing the energy consumption. As a result,
it also affects the comfort of the user, both positively (e.g., no need to manually turn off the computer after
working hours) and negatively (e.g., after a short break the computer is put to sleep).
A possible reason for the negative impact on the comfort is due to limited means of the system to accurately
detect occupancy and location. Perhaps it is possible to limit the discomfort, or even increase the overall
comfort, through the use of more or more precise sensors and actuators (e.g., automatically turning on the
computer when the user enters the office). This could lead to a better user acceptance rate of the system.
Potential pitfalls are the impact of the implementation on the user's everyday routine. For example, making
users carry along an tag (as described in Section 7.1) might solve the localization and occupancy sensing but
might provide additional discomfort because the user might have to swipe the tag against a control surface
every time when entering or leaving a room. A perk of the Green Mind system is that it does not require the
user to do anything differently than without the system. The Plugwise devices and computer client do not
60|73
require user interaction (no learning curve) and the system does not drastically influence the everyday flow
when it is operational.
7.3 Testing the system, sensors and actuators
Although the system components were independently tested, testing the system components together
uncovered several problems with the system, namely the unfinished SAGW and context components. Due to
these unfinished components the remaining part of the system could only be tested for communication and
basic functionality.
By finishing the SAGW and context components the system as a whole could be tested, not only for
communication and functionality, but also for other aspects such as the stability and latency (e.g., between
input from the SAGW and output from the orchestrator, or between other components). This advanced testing
helps to obtain a better understanding of the possibilities and limitations of each component and the system
as a whole. In this case, it would be important to investigate the factors that affect the working of the system.
Currently the system used for testing is used in production. In an environment specifically designed for the
purpose of testing, one could make and test all necessary changes to the system without affecting the
production environment.
7.4 Security
It becomes necessary in networked environments to secure the system from unauthorized access as an
unwanted visitor can disrupt the activities of the system. Even read-only access may be dangerous as sensitive
information about the internal structure can be derived from the exchanged messages. In these cases, it is
often desirable to encrypt the messages that are sent between the components to avoid eavesdropping.
Perhaps message encryption at application level can be used for the messages that are sent using the message
queue (e.g., using public-key cryptography, where the Kafka producer can use the public key to encrypt the
messages, whereas the Kafka consumer can decrypt the messages using the private key).
The current implementation of the Green Mind system allows all messages to be sent from all components. As
future work, it would also be important to implement a more sophisticated access system (e.g., ACL) that does
not only limit which messages can be sent by each component, but also features multiple users with
manageable permissions that specify what operations are allowed to provide the system with an additional
level of security against unwanted visitors.
7.5 Administrator panel
The independent configuration and maintenance of the components, sensors and actuators is possible.
Administrators have to manually monitor the state of the components and configuration of these components
is done locally through settings files. Although maintenance does not require recompiling it is by no means as
easy as it could be.
As a first step it would be of help to have statistics for each component, sensor and actuator (e.g, uptime,
downtime, or cpu usage for components) to determine their current status. As log files have proven useful in
helping to maintain the components and to investigate problems, one area of future work is to combine their
information with the statistics to provide easier means of access. However, only a small subset of all possible
behaviors is currently represented in the log files. Extending the log files to include more behaviors will provide
a wider variety of information for administrators to investigate.
61|73
A next step would be to add notifications, which requires monitoring and acting upon the reported statistics.
For example, if a component, sensor or actuator is down an administrator is able to receive a notification to
investigate the cause. In case of the components is perhaps also possible to remotely start, stop or restart
each individual component. In the end the panel should be automated to the point that it is not always
required to have physical access to the system and that downtime of a component, sensor or actuator is kept
to a minimum.
Another area of interest is the more sophisticated access system that was described in the Section 7.4. The
nature of such an access system would require a panel to manage users with manageable permissions as well.
As such, combining the access system panel with the administrator panel may help the user by providing a
single point of entry to all administrative tasks.
By using a web interface to access the administrator panel, it could provide access to nearly all users. In
addition, a mobile client for platforms such as Android, iOS and Windows Phone could be of assistance too
(e.g., for instant notifications to the administrators).
7.6 Extending rule support for controller
The rules for the controller provide the ability to control the connected sensors and actuators. Even though
rules can be specified for a whole range of similar devices (e.g., lights, computers), it is possible that there are
multiple similar rules due to personal preferences. Perhaps the rules should be designed in such a way that
users can specify their own preferences for each rule. For example, by adding a generic rule for lights where
each user or room can specify the minimum amount of light intensity before the associated lights are switched
off. Another area for further exploration is the possibility of overriding a rule or device by the user (e.g., to
keep a computer turned on during the weekend). Both the personal preferences for rules and the ability to
override the rules can prove to be useful for the user acceptance rate of the system.
62|73
References
[1]
[2]
[3]
[4]
[5]
[6]
[7]
[8]
[9]
[10]
[11]
[12]
[13]
[14]
[15]
[16]
[17]
[18]
T. A. NGUYEN, F. NIZAMIC, Bernoulliborg - The building of sustainability, November 2012
RUG, ‘Thinking about sustainability’ < University of Groningen, visited 25-06-2013,
http://www.rug.nl/about-us/who-are-we/sustainability/green-mind-award/.
RUG, Energy < Rijksuniversiteit Groningen, visited 02-08-2013, http://www.rug.nl/research/energy/.
Georgievski, Ilce and Degeler, Viktoriya and Pagani, Giuliano Andrea and Nguyen, Tuan Anh and
Lazovik, Alexander and Aiello, Marco. Optimizing Energy Costs for Offices Connected to the Smart
Grid. In IEEE Trans. Smart Grid, (3) 4: 2273-2285, Year 2012.
RUG, University of Groningen awards Green Mind Award 2012 for the most sustainable idea,
University of Groningen, visited 17-07-2013, http://www.rug.nl/news-andevents/news/news2012/object974926682?lang=en.
D. Kolokotsa, K. Niachou, V. Geros, K. Kalaitzakis, G.S. Stavrakakis, M. Santamouris, Implementation
of an integrated indoor environment and energy management system, Energy and Buildings,
Volume 37, Issue 1, January 2005, Pages 93-99.
A Guillemin, N Morel, Experimental results of a self-adaptive integrated control system in buildings:
a pilot study, Solar Energy, Volume 72, Issue 5, May 2002, Pages 397-403.
Kaoru Kawamoto, Yoshiyuki Shimoda, Minoru Mizuno, Energy saving potential of office equipment
power management, Energy and Buildings, Volume 36, Issue 9, September 2004, Pages 915-923,
ISSN 0378-7788.
Carrie A. Webber, Judy A. Roberson, Marla C. McWhinney, Richard E. Brown, Margaret J. Pinckard,
John F. Busch, After-hours power status of office equipment in the USA, Energy, Volume 31, Issue
14, November 2006, Pages 2823-2838, ISSN 0360-5442
Marie-Claude Dubois, Åke Blomsterberg, Energy saving potential and strategies for electric lighting
in future North European, low energy office buildings: A literature review, Energy and Buildings,
Volume 43, Issue 10, October 2011, Pages 2572-2582.
H. Bülow-Hübe, Daylight in glazed office buildings: a comparative study of daylight availability,
luminance and illuminance distribution for an office room with three different glass areas, Report
EBD-R—08/17, Lund University, Department of Architecture and Built Environment, Division of
Energy and Building Design, Lund (Sweden), 2008.
N. Borg, Guidelines for integrating sustainable summer comfort into public procurement schemes
for office equipment and lighting, Keep cool program, Deliverable 3.2, Swedish Energy Agency,
October 2009.
D. Loe, Energy efficiency in lighting – an overview, Action Energy GIR092, Society of Light and
Lighting, London, 2003.
M. Santamouris, A. Argiriou, E. Dascalaki, C. Balaras, A. Gaglia, Energy characteristics and savings
potential in office buildings, Solar Energy, Volume 52, Issue 1, January 1994, Pages 59-66.
A. Boyano, P. Hernandez, O. Wolf, Energy demands and potential savings in European office
buildings: Case studies based on EnergyPlus simulations, Energy and Buildings, Volume 65, October
2013, Pages 19-28.
Yuvraj Agarwal, Bharathan Balaji, Rajesh Gupta, Jacob Lyles, Michael Wei, and Thomas Weng. 2010.
Occupancy-driven energy management for smart building automation. In Proceedings of the 2nd
ACM Workshop on Embedded Sensing Systems for Energy-Efficiency in Building (BuildSys '10).
Haris Doukas, Konstantinos D. Patlitzianas, Konstantinos Iatropoulos, John Psarras, Intelligent
building energy management system using rule sets, Building and Environment, Volume 42, Issue
10, October 2007, Pages 3562-3569.
J.K.W. Wong, H. Li, S.W. Wang, Intelligent building research: a review, Automation in Construction,
Volume 14, Issue 1, January 2005, Pages 143-159.
63|73
[19]
[20]
[21]
[22]
[23]
[24]
[25]
[26]
[27]
[28]
[29]
[30]
[31]
[32]
[33]
[34]
[35]
[36]
[37]
[38]
Omar M Al-Rabghi, Mohammed M Akyurt, A survey of energy efficient strategies for effective air
conditioning, Energy Conversion and Management, Volume 45, Issues 11–12, July 2004, Pages 16431654.
H.W. Kua, S.E. Lee, Demonstration intelligent building—a methodology for the promotion of total
sustainability in the built environment, Building and Environment, Volume 37, Issue 3, March 2002,
Pages 231-240.
J. Han, Y. Jeong, and I. Lee, Efficient building energy management system based on Ontology,
inference rules, and simulation, in International Conference on Intelligent Building and
Management, vol. 5, 2011, Pages 295-299.
Georgievski, Ilche and Degeler, Viktoriya and Pagani, Giuliano Andrea and Nguyen, Tuan Anh and
Lazovik, Alexander and Aiello, Marco. Optimizing Energy Costs for Offices Connected to the Smart
Grid. In IEEE Trans. Smart Grid, (3) 4: 2273-2285, Year 2012.
GREENERBUILDINGS, Approach | GreenerBuildings project website, visited 25-08-2013,
http://www.greenerbuildings.eu/approach.
Tuan Anh Nguyen, Marco Aiello, Energy intelligent buildings based on user activity: A survey, Energy
and Buildings, Volume 56, January 2013, Pages 244-257.
AC, iDorm, visited 25-08-2013, http://cswww.essex.ac.uk/iieg/idorm.htm.
Paul Davidsson and Magnus Boman, Distributed Monitoring and Control of Office Buildings by
Embedded Agents, Information Sciences, Vol. 171(4), Elsevier, 2005.
COLORADO, Michael C. Mozer, visited 25-08-2013,
http://www.cs.colorado.edu/~mozer/index.php?dir=/Research/Projects/Adaptive%20house/.
L. Hawarah, S. Ploix, M. Jacomino, User behavior prediction in energy consumption in housing using
Bayesian networks, Proceedings of the 10th international conference on Artificial intelligence and
soft computing: Part I, ICAISC'10, Springer-Verlag, Berlin, Heidelberg (2010), pp. 372–379.
ARDUINO, Shield - Xbee w/o RF module [A000021] - €15.00 : Arduino Store - community and
electronics, visited 25-06-2013,
http://store.arduino.cc/eu/index.php?main_page=product_info&cPath=11_5&products_id=5.
ARDUINO, Arduino Uno Rev3 [A000066] - €20.00 : Arduino Store - community and electronics,
visited 25-06-2013,
http://store.arduino.cc/eu/index.php?main_page=product_info&cPath=11_12&products_id=195.
SPARKFUN, Flexiforce Pressure Sensor - 100lbs. - SparkFun Electronics, visited 25-06-2013,
https://www.sparkfun.com/products/8685.
MONNIT, Wireless Seat Occupancy Sensor | Monnit WIT™ Wireless Sensors | Monnit Corp., visited
25-06-2013, http://www.monnit.com/products/wireless-sensors/seat-occupancy.php.
ARPCI, Wireless Industrial Seat Occupancy Sensor AA Powered, visited 25-06-2013,
http://www.arpci.com/industrial-sensors/723-ind091a-0so.html.
PLUGWISE, Circle | Plugwise, visited 25-06-2013, http://www.plugwise.com/nl/idplugtypef/node/113.
ENOCEAN-ALLIANCE, EnOcean Alliance - Products "Enabled by EnOcean", visited 25-06-2013,
http://www.enocean-alliance.org/en/products/eltako_fsr61-va/.
PREISSUCHMASCHINE, ELTAKO ELTAKO FBH63AP-rw Funk-Bewegungs-Helligkeitssensorreinweiss
30000852 Preisvergleich - Günstig kaufen bei Preissuchmaschine.de, visited 25-06-2013,
http://www.preissuchmaschine.de/in-Diverses/Diverse-E/ELTAKO-ELTAKO-FBH63AP-rw-FunkBewegungs-Helligkeitssensorreinweiss-30000852.html.
ENOLUZ, Motion Sensors - Thermokon - SR-MDS BAT Wireless Ceiling MultiSensor 360º -, visited 2506-2013, http://www.enoluz.com/thermokon-wireless-ceiling-multisensor-360ordm-p-455.html.
DIGIKEY, EKMB1101112 Panasonic Electric Works | 255-3066-ND | DigiKey, visited 25-06-2013,
http://www.digikey.com/product-detail/en/EKMB1101112/255-3066-ND/2601860.
64|73
[39]
[40]
[41]
[42]
[43]
[44]
[45]
[46]
[47]
[48]
[49]
[50]
[51]
[52]
[53]
[54]
[55]
[56]
[57]
[58]
[59]
[60]
[61]
[62]
[63]
[64]
MY-KNX-SHOP, Eltako Funk-Helligkeitssensor anthr., f. Innen FIH63AP-an, 65,12 &eur, visited 25-062013, http://www.my-knx-shop.net/Eltako-Funk-Helligkeitssensor-anthr-f-Innen-FIH63AP-an.
ADAFRUIT, Flora Lux Sensor - TSL2561 Light Sensor [v1.0] ID: 1246 - $7.95 : Adafruit Industries,
Unique & fun DIY electronics and kits, visited 25-06-2013, http://www.adafruit.com/products/1246.
NODNA, Devantech SRF08 Ultrasonic Range Finder, noDNA Robotshop, visited 26-06-2013,
http://nodna.de/Devantech-SRF08-Ultrasonic-Range-Finder.
NODNA, Devantech USB to I2C Interface module V2, noDNA Robotshop, visited 26-06-2013,
http://nodna.de/USB-to-I2C-Interface-module.
ELECTROSHOP, Eltako FTK raam/deurcontact, visited 26-06-2013,
http://www.electroshop.nl/products/Eltako-FTK-raam%7B47%7Ddeurcontact.html.
AKKTOR, STM 250: Magnetkontakt-Funkmodul - Akktor Shop für Haus- und Gebäudeautomation,
visited 26-06-2013, http://shop.akktor.de/STM-250-Magnetkontakt-Funkmodul.
LBL, Standby Power Summary Table, visited 28-06-2013, http://standby.lbl.gov/summary-table.html
ENECO, Stroomprijzen: bekijk de prijs per kWh - Eneco, visited 15-07-2013,
http://thuis.eneco.nl/groene-energie/energieprijzen/stroomprijzen/.
W3, SPARQL Query Language for RDF, visited 30-04-2013, http://www.w3.org/TR/rdf-sparql-query/.
NEOTECHNOLOGY, Neo Technology - Neo4j World's Leading Graph Database | Graph Database
News, visited 30-04-2013, http://www.neotechnology.com/.
NEOTECHNOLOGY, Price List - - Neo Technology: Neo4j Graph Database, visited 30-04-2013,
http://www.neotechnology.com/price-list/.
NEO4J, Neo4j, the Graph Database - Language Drivers, visited 30-04-2013,
http://www.neo4j.org/develop/drivers.
NEO4J, Neo4j, the Graph Database - Ask Questions and Share Answers, visited 30-04-2013,
http://www.neo4j.org/participate/q_and_a#stack_overflow.
NEOTECHNOLOGY, Customers - Neo Technology: Neo4j Graph Database, visited 30-04-2013,
http://www.neotechnology.com/customers/.
NEO4J, Neo4j, the Graph Database - Learn Cypher - the Neo4j query language, visited 30-04-2013,
http://www.neo4j.org/learn/cypher.
NEO4J, Appendix B. Questions & Answers, visited 30-04-2013,
http://docs.neo4j.org/chunked/stable/questions.html.
NEO4J, Neo4j Blog: 2013: What's Coming Next in Neo4j!, visited 30-04-2013,
http://blog.neo4j.org/2013/01/2013-whats-coming-next-in-neo4j.html.
NEO4J, 25.2. Performance Guide, visited 30-04-2013,
http://docs.neo4j.org/chunked/milestone/performance-guide.html.
NEO4J, Chapter 22. High Availability, visited 30-04-2013,
http://docs.neo4j.org/chunked/stable/ha.html.
WEBBER, Scaling Neo4j with Cache Sharding and Neo4j HA | World Wide Webber, visited 30-042013, http://jim.webber.name/2011/02/scaling-neo4j-with-cache-sharding-and-neo4j-ha/.
NEO4J, Neo4j, the Graph Database - Other Neo4j Versions, visited 30-04-2013,
http://www.neo4j.org/download/other_versions.
NEO4J, Neo4j, the Graph Database - Learn, visited 30-04-2013, http://www.neo4j.org/learn.
ODINO, Graph databases: OrientDB to the rescue - Alessandro Nadalin, visited 01-05-2013,
http://odino.org/graph-databases-orientdb-to-the-rescue/.
ORIENTECHNOLOGIES, Orient Technologies the company behind OrientDB, visited 01-05-2013,
http://www.orientechnologies.com/.
ORIENTECHNOLOGIES, Orient Technologies the company behind OrientDB, visited 01-05-2013,
http://orientechnologies.com/enterprise.htm.
ORIENTECHNOLOGIES, Orient Technologies the company behind OrientDB, visited 01-05-2013,
http://orientechnologies.com/support.htm.
65|73
[65]
[66]
[67]
[68]
[69]
[70]
[71]
[72]
[73]
[74]
[75]
[76]
[77]
[78]
[79]
[80]
[81]
[82]
[83]
[84]
[85]
[86]
[87]
[88]
TINKERPOP, TinkerPop, visited 01-05-2013, http://www.tinkerpop.com/.
GITHUB, Programming Language Bindings · nuvolabase/orientdb Wiki · GitHub, visited 01-05-2013,
https://github.com/nuvolabase/orientdb/wiki/Programming-Language-Bindings.
GITHUB, Production Deployments · nuvolabase/orientdb Wiki · GitHub, visited 01-05-2013,
https://github.com/nuvolabase/orientdb/wiki/Production-Deployments.
GITHUB, Tutorial: Document and graph model · nuvolabase/orientdb Wiki · GitHub, visited 01-052013, https://github.com/nuvolabase/orientdb/wiki/Tutorial:-Document-and-graph-model.
GITHUB, Replication · nuvolabase/orientdb Wiki · GitHub, visited 01-05-2013,
https://github.com/nuvolabase/orientdb/wiki/Replication.
GITHUB, Binary Data · nuvolabase/orientdb Wiki · GitHub, visited 01-05-2013,
https://github.com/nuvolabase/orientdb/wiki/Binary-Data.
GITHUB, Distributed Configuration · nuvolabase/orientdb Wiki · GitHub, visited 01-05-2013,
https://github.com/nuvolabase/orientdb/wiki/Distributed-Configuration.
GOOGLE, Scalability and performance - Google Groups, visited 01-05-2013,
https://groups.google.com/forum/#!msg/orient-database/crIFYreBTdo/0RftK5AHFq4J.
GOOGLE, Google Groups, visited 01-05-2013, https://groups.google.com/forum/#!forum/orientdatabase.
GOOGLE, Performance of find references - Google Groups, visited 01-05-2013,
https://groups.google.com/forum/#!topic/orient-database/7VoiDE_5hLY.
GOOGLE, OrientDB and neo4J - Google Groups, visited 01-05-2013,
https://groups.google.com/forum/?fromgroups=#!topic/orient-database/Cbeokg6mFYw.
GITHUB, GraphDB Comparison · nuvolabase/orientdb Wiki · GitHub, visited 01-05-2013,
https://github.com/nuvolabase/orientdb/wiki/GraphDB-Comparison.
GOOGLE, DatabaseBenchmarks - orient - Orient Database Benchmarks - NoSQL document database
light, portable and fast. Supports ACID Tx, Indexes, asynch queries, SQL layer, clustering, etc - Google
Project Hosting, visited 01-05-2013, http://code.google.com/p/orient/wiki/DatabaseBenchmarks.
SOFTPEDIA, OrientDB 1.3.0 - Changelog, visited 01-05-2013,
http://mac.softpedia.com/progChangelog/Orient-Changelog-75279.html.
GITHUB, Distributed transactions · Issue #1418 · nuvolabase/orientdb · GitHub, visited 01-05-2013,
https://github.com/nuvolabase/orientdb/issues/1418.
SPARSITY-TECHNOLOGIES, Sparsity-technologies: DEX high-performance graph database, visited 0205-2013, http://www.sparsity-technologies.com/dex_licenses.
SPARSITY-TECHNOLOGIES, Sparsity-technologies: DEX high-performance graph database, visited 0205-2013, http://www.sparsity-technologies.com/dex_pricelist.
SPARSITY-TECHNOLOGIES, DEX Analytical Use Case Benchmark: Wikipedia |, visited 02-05-2013,
http://sparsity-technologies.com/blog/?p=228.
SPARSITY-TECHNOLOGIES, Sparsity-technologies: DEX high-performance graph database, visited 0205-2013, http://www.sparsity-technologies.com/dex.
SPARSITY-TECHNOLOGIES, Sparsity-technologies: DEX high-performance graph database, visited 0205-2013, http://www.sparsity-technologies.com/dex_tutorials5?name=Index.
SPARSITY-TECHNOLOGIES, Sparsity-technologies: DEX high-performance graph database, visited 0205-2013, http://www.sparsity-technologies.com/dex_releases.
FACEBOOK, Sparsity Technologies, visited 02-05-2013, http://www.facebook.com/pages/SparsityTechnologies/158957260788675.
GOOGLE, (17) DEXgdb - Google Groups, visited 02-05-2013,
https://groups.google.com/forum/?fromgroups#!forum/dexgdb.
SPARSITY-TECHNOLOGIES, Sparsity-technologies: DEX high-performance graph database, visited 0205-2013, http://www.sparsity-technologies.com/partners_clients.
66|73
[89]
[90]
[91]
[92]
[93]
[94]
[95]
[96]
[97]
[98]
[99]
[100]
[101]
[102]
[103]
[104]
[105]
[106]
[107]
[108]
[109]
[110]
[111]
SPARSITY-TECHNOLOGIES, Sparsity-technologies: DEX high-performance graph database, visited 0205-2013, http://www.sparsity-technologies.com/dex_tutorials4?name=Architecture.
SPARSITY-TECHNOLOGIES, Sparsity-technologies: DEX high-performance graph database, visited 0205-2013, http://www.sparsity-technologies.com/events.
BLOGSPOT, NuvolaBase's Blog: XDGBench: 3rd party benchmark results against graph databases,
visited 18-07-2013, http://nuvolabase.blogspot.sg/2013/04/xdgbench-3rd-party-benchmarkresults.html.
JAKUT, Graph Databases - Vytautas Jakutis, visited 18-07-2013, https://jakut.is/2013/05/12/graphdatabases/.
BULBFLOW, The Bulbs Community, a Python Framework for Graph Databases | Bulbflow, visited 1807-2013, http://bulbflow.com/community/.
GOOGLE, Google Groups, visited 18-07-2013,
https://groups.google.com/forum/#!forum/aureliusgraphs.
GOOGLE, (99+) HyperGraphDB - Google Groups, visited 18-07-2013,
https://groups.google.com/forum/#!forum/hypergraphdb.
GOOGLE, Status of Replication? - Google Groups, visited 18-07-2013,
https://groups.google.com/forum/#!topic/hypergraphdb/fBBVD_Rh_eA.
HYPERGRAPHDB, HypergraphDB - A Graph Database, visited 18-07-2013,
http://www.hypergraphdb.org/blog?entry=http://www.blogger.com/feeds/1980461574999551012
/posts/default/8662850803828497527.
HYPERGRAPHDB, HypergraphDB - A Graph Database, visited 18-07-2013,
http://www.hypergraphdb.org/blog?entry=http://www.blogger.com/feeds/1980461574999551012
/posts/default/173304913295485825.
FRANZ, AllegroGraph Editions, visited 18-07-2013,
http://www.franz.com/agraph/allegrograph/ag_commercial_edition.lhtml.
FRANZ, Franz Inc. Technical Support, visited 18-07-2013, http://www.franz.com/support.lhtml.
STACKOVERFLOW, Questions containing 'allegrograph' - Stack Overflow, visited 18-07-2013,
http://stackoverflow.com/search?q=allegrograph.
FRANZ, AllegroGraph RDFStore Web 3.0's Database, visited 18-07-2013,
http://www.franz.com/agraph/allegrograph/.
OBJECTIVITY, Objectivity – InfiniteGraph, visited 18-07-2013,
http://www.objectivity.com/infinitegraph.
GOOGLE, (60) InfiniteGraph Developer Forum - Google Groups, visited 18-07-2013,
https://groups.google.com/forum/#!forum/infinitegraph.
GOOGLE, regarding data replication and failover in IG 3.0 - Google Groups, visited 22-07-2013,
https://groups.google.com/forum/#!topic/infinitegraph/yfdUdLkK6eA.
SLIDESHARE, OrientDB distributed architecture 1.1, visited 22-07-2013,
http://www.slideshare.net/lvca/orientdb-distributed-architecture-11.
GOOGLE, Horizontal scalability in orientdb? - Google Groups, visited 22-07-2013,
https://groups.google.com/forum/#!topic/orient-database/tFW1KdDTOMA.
GITHUB, Home · orientechnologies/orientdb Wiki · GitHub, visited 22-07-2013,
https://github.com/orientechnologies/orientdb/wiki.
SPARSITY-TECHNOLOGIES, Sparsity-technologies: DEX high-performance graph database, visited 2207-2013, http://sparsity-technologies.com/dex_tutorials.
GOOGLE, Downloads - orient - NoSQL document database light, portable and fast. Supports ACID Tx,
Indexes, asynch queries, SQL layer, clustering, etc - Google Project Hosting, visited 22-07-2013,
http://code.google.com/p/orient/downloads/list.
GITHUB, Releases · orientechnologies/orientdb · GitHub, visited 22-07-2013,
https://github.com/orientechnologies/orientdb/releases.
67|73
[112]
[113]
[114]
[115]
[116]
[117]
[118]
[119]
[120]
[121]
[122]
[123]
[124]
[125]
[126]
[127]
[128]
[129]
[130]
[131]
[132]
[133]
[134]
[135]
[136]
[137]
TWITTER, SparsityTechnologies (SparsityTech) on Twitter, visited 22-07-2013,
https://twitter.com/sparsitytech.
GOOGLE, Licenses - Google Groups, visited 22-07-2013,
https://groups.google.com/forum/#!searchin/aureliusgraphs/license/aureliusgraphs/6fG6BaGDFE0.
GOOGLE, performance (in Aurelius) - Google Groups Search, visited 22-07-2013,
https://groups.google.com/forum/#!searchin/aureliusgraphs/performance.
TOYOTARO SUZUMURA AND MIYURU DAYARATHNA. 2012. XGDBench: A benchmarking platform for
graph stores in exascale clouds. In Proceedings of the 2012 IEEE 4th International Conference on
Cloud Computing Technology and Science (CloudCom) (CLOUDCOM '12). IEEE Computer Society,
Washington, DC, USA, 363-370.
SPARSITY-TECHNOLOGIES, Sparsity-technologies: DEX high-performance graph database, visited 2207-2013, http://www.sparsity-technologies.com/dex_tutorials5?name=HighAvailability.
NEO4J, Neo4j, the Graph Database - Learn, Develop, Participate, visited 23-07-2013,
http://www.neo4j.org/.
GITHUB, Titan: Distributed Graph Database, visited 23-07-2013,
http://thinkaurelius.github.io/titan/.
HYPERGRAPHDB, HypergraphDB - A Graph Database, visited 23-07-2013,
http://www.hypergraphdb.org/index.
FRANZ, AllegroGraph RDFStore Web 3.0's Database, visited 23-07-2013,
http://www.franz.com/agraph/allegrograph/.
SPARSITY-TECHNOLOGIES, Sparsity-technologies: DEX high-performance graph database, visited 2307-2013, http://www.sparsity-technologies.com/dex.php.
OBJECTIVITY, Objectivity – InfiniteGraph, visited 23-07-2013,
http://www.objectivity.com/infinitegraph.
ORIENTDB, OrientDB Graph-Document NoSQL dbms, visited 23-07-2013, http://www.orientdb.org/.
APACHE, Apache ActiveMQ ™ -- Index, visited 25-07-2013, http://activemq.apache.org/.
ZEROMQ, The Intelligent Transport Layer - zeromq, visited 25-07-2013, http://www.zeromq.org/.
APACHE, Apache Kafka, visited 25-07-2013, http://kafka.apache.org/.
RABBITMQ, RabbitMQ - Messaging that just works, visited 25-07-2013, http://www.rabbitmq.com/.
APACHE, Apache Qpid™, visited 25-07-2013, http://qpid.apache.org/.
AMAZON, AWS | Amazon Simple Queue Service (SQS) - Queue Messaging Service, visited 25-072013, http://aws.amazon.com/sqs/.
JBOSS, HornetQ - putting the buzz in messaging - JBoss Community, visited 25-07-2013,
http://www.jboss.org/hornetq.
APACHE, Apollo, visited 25-07-2013, http://activemq.apache.org/apollo/.
STACKOVERFLOW, message queue - ActiveMQ or RabbitMQ or ZeroMQ or - Stack Overflow, visited
25-07-2013, http://stackoverflow.com/questions/731233/activemq-or-rabbitmq-or-zeromq-or.
SECONDLIFE, Message Queue Evaluation Notes - Second Life Wiki, visited 25-07-2013,
http://wiki.secondlife.com/wiki/Message_Queue_Evaluation_Notes.
PREDIC8, ActiveMQ, Qpid, HornetQ and RabbitMQ in Comparison, visited 25-07-2013,
http://www.predic8.com/activemq-hornetq-rabbitmq-apollo-qpid-comparison.htm.
JAVAPLEX, High Performance Message Queues get Reviewed | Java Plex -> Exploring Java
Technologies, visited 25-07-2013, http://www.javaplex.com/blog/high-performance-messagequeues-get-reviewed/.
X-AEON, A quick message queue benchmark: ActiveMQ, RabbitMQ, HornetQ, QPID, Apollo... Muriel's Tech Blog, visited 25-07-2013, http://x-aeon.com/wp/2013/04/10/a-quick-message-queuebenchmark-activemq-rabbitmq-hornetq-qpid-apollo/.
ZEROMQ, [zeromq-dev] is 0MQ guaranteed, in-order delivery?, visited 25-07-2013,
http://lists.zeromq.org/pipermail/zeromq-dev/2009-May/000808.html.
68|73
[138]
[139]
[140]
[141]
[142]
[143]
[144]
[145]
[146]
[147]
[148]
[149]
[150]
[151]
[152]
[153]
[154]
[155]
[156]
[157]
[158]
ZEROMQ, ØMQ - The Guide - ØMQ - The Guide, visited 25-07-2013,
http://zguide.zeromq.org/page%3aall.
AMAZON, AWS | Amazon Simple Queue Service (SQS) - Queue Messaging Service, visited 25-072013, http://aws.amazon.com/sqs/#highlights.
AMAZON, AWS | Amazon Simple Queue Service (SQS) - Queue Messaging Service, visited 25-072013, http://aws.amazon.com/sqs/#pricing.
APACHE, Issue Navigator - ASF JIRA, visited 25-07-2013,
https://issues.apache.org/jira/issues/?jql=project%20in%20(QPID%2C%20PROTON)%20AND%20issu
etype%20%3D%20Bug%20AND%20status%20%3D%20Open%20order%20by%20updatedDate%20d
esc.
STACKOVERFLOW, Questions containing 'qpid' - Stack Overflow, visited 25-07-2013,
http://stackoverflow.com/search?q=qpid.
X-AEON, A quick message queue benchmark: ActiveMQ, RabbitMQ, HornetQ, QPID, Apollo... Muriel's Tech Blog, visited 25-07-2013, http://x-aeon.com/wp/2013/04/10/a-quick-message-queuebenchmark-activemq-rabbitmq-hornetq-qpid-apollo/.
HIRAMCHIRINO, visited 25-07-2013, http://hiramchirino.com/stomp-benchmark/ec2c1.xlarge/index.html#throughput_to_topic.
YCOMBINATOR, ActiveMQ: Not ready for prime time | Hacker News, visited 25-07-2013,
https://news.ycombinator.com/item?id=2588072.
SECONDLIFE, Message Queue Evaluation Notes - Second Life Wiki, visited 25-07-2013,
http://wiki.secondlife.com/wiki/Message_Queue_Evaluation_Notes#Apache_QPID.2FRed_Hat_MR
G.
STACKOVERFLOW, Feedback about ActiveMQ. How about it? Is it worth? - Stack Overflow, visited
25-07-2013, http://stackoverflow.com/questions/1809554/feedback-about-activemq-how-about-itis-it-worth/6561777#6561777.
NABBLE, Qpid - Apache Qpid users | Mailing List Archive, visited 25-07-2013,
http://qpid.2158936.n2.nabble.com/Apache-Qpid-users-f2158936.html.
NABBLE, ActiveMQ - Search for 'message:apollo NOT subject:(svn OR commit OR jira OR build)',
visited 25-07-2013,
http://activemq.2283324.n4.nabble.com/template/NamlServlet.jtp?macro=search_page&node=234
1804&query=message%3Aapollo+NOT+subject%3A%28svn+OR+commit+OR+jira+OR+build%29&da
ys=30.
STACKOVERFLOW, Questions containing 'apollo apache' - Stack Overflow, visited 25-07-2013,
http://stackoverflow.com/search?q=apollo+apache.
RABBITMQ, RabbitMQ - Commercial Services, visited 26-07-2013,
http://www.rabbitmq.com/services.html.
LINKEDIN, Open-sourcing Kafka, LinkedIn’s distributed message queue | Official LinkedIn Blog,
visited 26-07-2013, http://blog.linkedin.com/2011/01/11/open-source-linkedin-kafka/.
LINKEDIN, Intra-cluster Replication in Apache Kafka | LinkedIn Engineering, visited 26-07-2013,
http://engineering.linkedin.com/kafka/intra-cluster-replication-apache-kafka.
JBOSS, HornetQ General FAQs | HornetQ | JBoss Community, visited 29-07-2013,
https://community.jboss.org/wiki/HornetQGeneralFAQs.
REDHAT, Red Hat | Subscription model, visited 29-07-2013,
http://www.redhat.com/about/subscription/#tab1.
RABBITMQ, RabbitMQ - Highly Available Queues, visited 29-07-2013,
http://www.rabbitmq.com/ha.html.
APACHE, Apache Kafka, visited 29-07-2013, http://kafka.apache.org/08/quickstart.html.
JBOSS, Chapter 38. Clusters, visited 29-07-2013, http://docs.jboss.org/hornetq/2.2.5.Final/usermanual/en/html/clusters.html.
69|73
[159]
[160]
[161]
[162]
[163]
[164]
[165]
[166]
[167]
[168]
[169]
[170]
[171]
[172]
[173]
[174]
[175]
[176]
[177]
[178]
[179]
[180]
[181]
[182]
[183]
[184]
APACHE, Apache Kafka, visited 29-07-2013, http://kafka.apache.org/design.html.
JBOSS, HornetQ User Manual, visited 29-07-2013,
http://docs.jboss.org/hornetq/2.3.0.Final/docs/user-manual/html_single/index.html.
APACHE, Index - Apache Kafka - Apache Software Foundation, visited 29-07-2013,
https://cwiki.apache.org/confluence/display/KAFKA/Index.
APACHE, Apache Kafka, visited 29-07-2013, http://kafka.apache.org/index.html.
APACHE, Apache Kafka, visited 29-07-2013, http://kafka.apache.org/07/quickstart.html.
JBOSS, HornetQ QuickStart Guide, visited 29-07-2013,
http://docs.jboss.org/hornetq/2.3.0.Final/docs/quickstart-guide/html_single/index.html.
RABBITMQ, RabbitMQ - Getting started with RabbitMQ, visited 29-07-2013,
http://www.rabbitmq.com/getstarted.html.
APACHE, Powered By - Apache Kafka - Apache Software Foundation, visited 29-07-2013,
https://cwiki.apache.org/confluence/display/KAFKA/Powered+By.
NABBLE, RabbitMQ | Mailing List Archive, visited 29-07-2013,
http://rabbitmq.1065348.n5.nabble.com/.
STACKOVERFLOW, Questions containing 'rabbitmq' - Stack Overflow, visited 29-07-2013,
http://stackoverflow.com/search?q=rabbitmq.
STACKOVERFLOW, Questions containing 'hornetq' - Stack Overflow, visited 29-07-2013,
http://stackoverflow.com/search?q=hornetq.
JBOSS, HornetQ | JBoss Community, visited 29-07-2013,
https://community.jboss.org/en/hornetq?view=discussions.
STACKOVERFLOW, Questions containing 'kafka' - Stack Overflow, visited 29-07-2013,
http://stackoverflow.com/search?q=kafka.
APACHE, kafka-users mailing list archives, visited 29-07-2013, http://mailarchives.apache.org/mod_mbox/kafka-users/201307.mbox/browser.
RABBITMQ, RabbitMQ - Documentation, visited 29-07-2013,
http://www.rabbitmq.com/documentation.html.
RABBITMQ, RabbitMQ - Java Client API Guide, visited 29-07-2013, http://www.rabbitmq.com/apiguide.html.
JAY KREPS, NEHA NARKHEDE AND JUN RAO, Kafka: A distributed messaging system for log
processing. In Proceedings of 6th International Workshop on Networking Meets Databases (NetDB),
Athens, Greece, 2011.
GOPIVOTAL, 800,000 Messages/Minute: How Nokia’s HERE Uses RabbitMQ to Make Real-time
Traffic Maps | Pivotal P.O.V., visited 01-08-2013, http://blog.gopivotal.com/case-studies-2/800000messagesminute-how-nokias-here-uses-rabbitmq-to-make-real-time-traffic-maps.
VMWARE, RabbitMQ | VMware vFabric Blog - VMware Blogs, visited 01-08-2013,
http://blogs.vmware.com/vfabric/rabbitmq.
RABBITMQ, RabbitMQ - How To, visited 01-08-2013, http://www.rabbitmq.com/how.html#specificexamples.
BLOGSPOT, The HornetQ Team Blog, visited 01-08-2013, http://hornetq.blogspot.nl/.
RABBITMQ, RabbitMQ - Highly Available Queues, visited 01-08-2013,
http://www.rabbitmq.com/ha.html.
SOURCEFORGE, Chapter 39. High Availability and Failover, visited 01-08-2013,
http://hornetq.sourceforge.net/docs/hornetq-2.0.0.GA/user-manual/en/html/ha.html.
DIRECTI, RabbitMQ vs Apache ActiveMQ vs Apache qpid, visited 02-08-2013,
http://bhavin.directi.com/rabbitmq-vs-apache-activemq-vs-apache-qpid/.
AMQP, Home | AMQP, visited 25-08-2013, http://www.amqp.org/.
STACKOVERFLOW, Message Queue vs. Web Services? - Stack Overflow, visited 07-08-2013,
http://stackoverflow.com/questions/2383912/message-queue-vs-web-services.
70|73
[185]
[186]
[187]
[188]
[189]
[190]
[191]
[192]
[193]
[194]
[195]
[196]
[197]
[198]
[199]
[200]
[201]
[202]
[203]
[204]
[205]
[206]
[207]
[208]
GITHUB, device-plugwise-perl/lib/Device/Plugwise.pm at releases · hollie/device-plugwise-perl ·
GitHub, visited 07-08-2013, https://github.com/hollie/device-plugwiseperl/blob/releases/lib/Device/Plugwise.pm.
Maarten Damen, Plugwise Unleashed (0.1) - A document explaining the protocol used by Plugwise
products, 2010.
DIRKENGELS, PlugWeb: Creating the driver | Dirk Engels, visited 07-08-2013,
http://wordpress.dirkengels.com/2011/04/24/plugweb-creating-the-driver/.
I. Georgievski, D. Degeler, G. A. Pagani, T. A. Nguyen, A. Lazovik, and M. Aiello, Optimizing Offices for
the Smart Grid, University of Groningen, JBI 2011-12-01, 2011.
ANTLR, ANTLR, visited 15-08-2013, http://antlr.org/.
SINGULARSYS, Jep Java - Math Expression Parser - Singular Systems, visited 15-08-2013,
http://www.singularsys.com/jep/.
APACHE, OGNL - Apache Commons OGNL - Object Graph Navigation Library, visited 15-08-2013,
http://commons.apache.org/proper/commons-ognl/.
CODEHAUS, MVEL - Performance of MVEL 2.0, visited 15-08-2013,
http://mvel.codehaus.org/Performance+of+MVEL+2.0.
APACHE, Commons JEXL Overview, visited 15-08-2013,
http://commons.apache.org/proper/commons-jexl/.
ANTLR, Getting Started with ANTLR v4 - ANTLR 4 - ANTLR Project, visited 15-08-2013,
http://www.antlr.org/wiki/display/ANTLR4/Getting+Started+with+ANTLR+v4.
SINGULARSYS, Trial Download - Singular Systems, visited 15-08-2013,
http://www.singularsys.com/jep/download-trial.php.
SOURCEFORGE, Java Unified Expression Language, visited 15-08-2013, http://juel.sourceforge.net/.
GITHUB, Commits · beckchr/juel · GitHub, visited 15-08-2013,
https://github.com/beckchr/juel/commits/master.
APACHE, [Apache-SVN] Index of /commons/proper/jexl/tags, visited 15-08-2013,
http://svn.apache.org/viewvc/commons/proper/jexl/tags/.
CODEHAUS, MVEL - Home, visited 15-08-2013, http://mvel.codehaus.org/.
CODEHAUS, MVEL - Language Guide for 2.0, visited 15-08-2013,
http://mvel.codehaus.org/Language+Guide+for+2.0.
CBS, CBS StatLine - Aardgas en elektriciteit, gemiddelde prijzen van eindverbruikers, visited 25-082013, http://statline.cbs.nl/StatWeb/publication/?DM=SLNL&PA=81309NED&D1=0-1,5,8,1315&D2=0&D3=1&D4=19,24,29&HDR=T&STB=G2,G3,G1&VW=T.
PLUGWISE, Home Extension | Plugwise, visited 25-08-2013, http://www.plugwise.com/idplugtypef/home/home-extension.
KNMI, KNMI Klimaatdata en -advies - Informatie over verleden weer, visited 25-08-2013,
http://www.knmi.nl/klimatologie/maand_en_seizoensoverzichten/jaar/jaar12.html.
GEMIDDELDGEZIEN, Gemiddelde aantal werkdagen - Gemiddeldgezien.nl, visited 25-08-2013,
http://gemiddeldgezien.nl/meer-gemiddelden/106-gemiddelde-aantal-werkdagen.
Eric Bush, Jürg Nipkow, Barbara Josephy, Susanne Heutling, and Rainer Griesshammer. "Strategies
to enhance energy efficiency of coffee machines." In EEDAL Conference paper ID, vol. 75. 2009.
A.D. Galasiu, G.R. Newsham, C. Suvagau, D.M. Sander, Energy saving lighting control systems for
open-plan offices: a field study, Leukos, v. 4, no. 1, July 2007, pp. 7-29.
Sheng-Yuan Yang, A novel cloud information agent system with Web service techniques: Example of
an energy-saving multi-agent system, Expert Systems with Applications, Volume 40, Issue 5, April
2013, Pages 1758-1785, ISSN 0957-4174.
Sunghoi Park, Myeong-in Choi, Byeongkwan Kang, Sehyun Park, Design and Implementation of
Smart Energy Management System for Reducing Power Consumption Using ZigBee Wireless
71|73
Communication Module, Procedia Computer Science, Volume 19, 2013, Pages 662-668, ISSN 18770509.
72|73
Glossary
AcronymExplanation
ACL
Access Control List
AMQP
Advanced Message Queuing Protocol
API
Application Programming Interface
BMS
Building Management System
GUID
Globally Unique Identifier
HVAC
Heating, Ventilation, and Air Conditioning
JSON
JavaScript Object Notation
NFC
Near Field Communication
PIR
Passive InfraRed
RDF
Resource Description Framework
REST
Representational State Transfer
RFID
Radio Frequency Identification
SaaS
Software as a Service
SAGW
Sensor and Actuator GateWay
SMS
Sleep Management Server
73|73