1
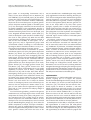
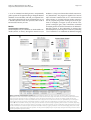
Seitzer et al. BMC Bioinformatics 2013, 14:18
http://www.biomedcentral.com/1471-2105/14/18
SOFTWARE
Open Access
JContextExplorer: a tree-based approach to
facilitate cross-species genomic context
comparison
Phillip Seitzer1,2, Tu Anh Huynh3 and Marc T Facciotti1,2*
Abstract
Background: Cross-species comparisons of gene neighborhoods (also called genomic contexts) in microbes may
provide insight into determining functionally related or co-regulated sets of genes, suggest annotations of
previously un-annotated genes, and help to identify horizontal gene transfer events across microbial species.
Existing tools to investigate genomic contexts, however, lack features for dynamically comparing and exploring
genomic regions from multiple species. As DNA sequencing technologies improve and the number of whole
sequenced microbial genomes increases, a user-friendly genome context comparison platform designed for use by
a broad range of users promises to satisfy a growing need in the biological community.
Results: Here we present JContextExplorer: a tool that organizes genomic contexts into branching diagrams. We
implement several alternative context-comparison and tree rendering algorithms, and allow for easy transitioning
between different clustering algorithms. To facilitate genomic context analysis, our tool implements GUI features,
such as text search filtering, point-and-click interrogation of individual contexts, and genomic visualization via a
multi-genome browser. We demonstrate a use case of our tool by attempting to resolve annotation ambiguities
between two highly homologous yet functionally distinct genes in a set of 22 alpha and gamma proteobacteria.
Conclusions: JContextExplorer should enable a broad range of users to analyze and explore genomic contexts. The
program has been tested on Windows, Mac, and Linux operating systems, and is implemented both as an
executable JAR file and java WebStart. Program executables, source code, and documentation is available at
http://www.bme.ucdavis.edu/facciotti/resources_data/software/.
Keywords: Genomic context, Genomic neighborhood, Comparative genomics, Java, GUI
Background
As genomic sequencing becomes increasingly accurate,
cheaper, and widespread, the need for tools to meaningfully
interpret whole-organism genomic sequence data has
increased. While a large collection of tools are devoted to
sequence homology and phylogenetic analyses [1,2], far less
attention has been paid to tools designed to meaningfully
compare gene neighborhoods, or genomic contexts, across
species. Differences among genomic contexts across species may indicate changes in the organization of functional
* Correspondence: [email protected]
1
Department of Biomedical Engineering, One Shields Ave, University of
California, Davis, CA 95616, USA
2
Genome Center, One Shields Ave, University of California, Davis, CA 95616,
USA
Full list of author information is available at the end of the article
transcription units [3,4], which ultimately result in differences among gene regulatory networks [5]. Genomic context may also be helpful in elucidating details of horizontal
gene transfer and duplication events [6-8], and has been
used to improve upon sequence-based gene annotation
algorithms [9-11] and aid in the construction of proteinprotein association networks [12]. In each of these investigations, a new method was created to meaningfully define
and compare genomic contexts. The existence of a fast, accurate, user-friendly context comparison tool could have
aided these investigations, and could encourage future
researchers to incorporate genomic context analyses into
their investigations.
In plant and animal species, a number of tools interrogating synteny (the degree that genes remain on corresponding chromosomes) and collinearity (the degree that
© 2013 Seitzer et al.; licensee BioMed Central Ltd. This is an Open Access article distributed under the terms of the Creative
Commons Attribution License (http://creativecommons.org/licenses/by/2.0), which permits unrestricted use, distribution, and
reproduction in any medium, provided the original work is properly cited.
Seitzer et al. BMC Bioinformatics 2013, 14:18
http://www.biomedcentral.com/1471-2105/14/18
genes remain on corresponding chromosomes and in
order) [13] have been developed, such as MCScanX [14]
and i-ADHoRe [15]). The Ensembl project [16] also utilizes
syntenic data. These tools have many useful features, however lack a powerful visualization methods. Additionally,
they do not focus on microbial species. In general, genomic
context comparison methods applied to microbial species
[3-11] have been highly customized, non-GUI based, and
not readily extendable to other investigations. However, a
number of rudimentary GUI platforms for exploration of
annotated microbial genomes have been developed, such
as the Integrated Microbial Genome system (IMG) [17],
which has developed a system that allows clickable navigation of one or more genomes [18]. While the tool offers
several alternative homology-based clustering methods, it
does not have much flexibility in other aspects - for example, genes may only be organized into groups called
“chromosomal cassettes” according to a hard-coded 300bp intergenic distance threshold, and there is no way to export graphical representations of genome contexts.
Several tools have focused on visualization of syntenic
and collinear regions, such as the plant genome duplication
database [12], PLAZA [19], and Genomicus [20]. These
tools are most appropriate when investigating plant and
animal species, however, and could benefit from additional
user flexibility and control in their visualization and interrogation of genomic segments. A number of genome navigable interfaces have been developed (such as the UCSC
genome browser [21], the Gaggle genome browser [22],
and JBrowse [23]). Many genome browsers have been
developed with a focus of interrogating one or a few model
organism(s) of interest, such as EcoCyc, (interrogating
Escherichia coli [24]) and the Yeast Gene Order Browser
(interrogating various species of yeast [25]). While these
tools are sophisticated in their visualization schemes, they
are limited in the species available for cross-species comparisons. MicrobesOnline [26] has developed a “domain
browser” tool, which allows one to analyze the domain
content of homologous proteins across microbial species.
However, this tool compares the domain content of one
gene at a time (rather than the organization of groups of
genes) and so is not appropriate for studying changes in
genomic context.
A tool with broad applicability, powerful multi-genome
visualization tools, and a high degree of user control could
complement the existing set of synteny and genomic context comparison tools well. To bridge the gap in genomic
context comparison and visualization software, we have
developed a new tool: JContextExplorer. Our tool extends
the Java Multidendrograms package [27], which allows for
flexible computation, re-analysis, and export of multidendrograms. We apply the multidendrogram approach to a
set of user-supplied annotated genomes to create “context
trees”: genomic contexts (which form the leaves of the
Page 2 of 8
tree) are assembled into a multidendrogram using variable
group agglomerative hierarchical clustering. Previous genomic context investigations often determined the genomic
contexts of interest in a set of species, and compared the
observable differences in genomic contexts to a phylogenetic tree of the organisms [28-30]. However, genomic contexts do not always differ in ways that match species
phylogeny, especially when a number of horizontal gene
transfer events have taken place [30]. Our context tree approach offers an alternative to whole-species or even single
gene phylogenetic trees that emphasizes the arrangement,
size, and spacing of individual genetic elements within a
contextual region of DNA instead of nucleotide-specific
differences in the DNA.
The genomic contexts used to assemble context trees
may be interrogated in an intuitive context viewer window, and information associated with individual genes
may be retrieved by button clicks. Our software facilitates
easy modification of parameters, and enables interrogation
of several alternative genomic contexts of interest simultaneously. A balance of automation and manual control is
essential for any software tool; we have attempted to automate only essential processes (such as tree computation
and tree rendering), and leave a great deal of control to the
user. Our motivation was to develop a novel, generalpurpose genomic context comparison platform to both (1)
generate context trees, and (2) facilitate genomic exploration through our multi-genome browser interface. We
demonstrate a use case for our tool by resolving annotation
ambiguities between ggt and hpxW genes among 22 species
of alpha and gamma proteobacteria. Though in the use case
provided here we focus on microbial species, we emphasize
that analyses are not limited to microbial species.
Implementation
JContextExplorer is a platform-independent pure Java application, requiring Java 1.6 or higher. The software
extends the MultiDendrograms software package [27], and
also uses BioJava [31] and the Java EPS Graphics2D API
(version 0.1) [32]. The software has been tested to functionally equally on MacOS X, Windows 7, and Linux
Ubuntu environments. Input data is read in via a series of
tab-delimited text files. We provide instructions and examples in the user manual (Additional file 1) to help familiarize new users to the tool. The look and feel of all GUI
components has been set to match the default look and
feel of the operating system running the program. Program
development was undertaken over several platforms to ensure an intuitive look and feel on all major platforms.
JContextExplorer has the ability to output JPG, PNG, and
EPS representations of context tress and multi-genome
browsable contexts. EPS representations of genomic contexts
were achieved using the Java EPS Graphics2D API [32]. It
took approximately 35 seconds to launch the program with
Seitzer et al. BMC Bioinformatics 2013, 14:18
http://www.biomedcentral.com/1471-2105/14/18
a set of 22 annotated microbial genomes, computationally
predict operons in all organisms using an intergenic distance
threshold of 20 nucleotides, and load pre-computed homology cluster information for 81,102 annotated genes on a 2
x 2.8 GHz Quad-Core Intel Xeon processor, with 16 GB of
RAM and total memory of 2 TB.
Results
JContextExplorer software usage
JContextExplorer may be launched via downloadable executable JAR file, or directly through the Internet via Java
Page 3 of 8
WebStart at http://www.bme.ucdavis.edu/facciotti/resources_data/software/. The program is organized as a series of
major and minor windows laid out in a semi-hierarchical
manner (Figure 1). An initial welcome window invites the
user to (1) specify the genomic working set (the set of genomes to investigate, see Figure 2) and (2) include crossspecies homologous gene cluster information. Individual
annotated genomes should be formatted as tab-delimited .
GFF files (version 2). This information is imported into
JContextExplorer by selecting either a directory containing
a set of .GFF files or an additional tab-delimited mapping
Figure 1 Layout of JContextExplorer windows. (A) JContextExplorer operates via usage of an initial data-loading frame, followed by
coordination of a main window and multi-genome browser context viewer window (top). These frames have several associated child windows
(second row): from the main window, a scrollable list of gene annotations (Annotations) and a window to facilitate multiple loading and
switching between alternative context sets (Add/Remove Context Sets); from the context viewer window, an alphabetized gene color legend
(Color Legend), and pop-up window of information relating to a specific gene (Gene Information). An enlarged view of the context viewer
window (B) reveals a scrollable viewing area, where genes are rendered as colors rectangles appearing above or below a centerline, depending
on their strandedness. Genes are colored according to homology or associated annotation. The Gene Information panel (lower left-hand corner)
describes information to be delivered upon click (Gene Information window). Toggling checkboxes in the Genome Display panel (lower center)
modifies the display of all rendered genomic segments. The range of the displayed region may be easily changed in the Range Around Context
Segment panel (lower right-hand corner).
Seitzer et al. BMC Bioinformatics 2013, 14:18
http://www.biomedcentral.com/1471-2105/14/18
Page 4 of 8
Figure 2 JContextExplorer technical terminology. Technical terms relevant to the JContextExplorer program (column 1) are defined
(column 2) and demonstrated via graphical representation (column 3).
file listing the system locations of all individual annotated
genomes files and corresponding species names. The user
may also include tab-delimited cross-species gene clustering information, which could be computed using a combination of BLAST [33] and MCL [34], for example, or
one of a number of various other gene clustering pipelines
[35,36]. Homology cluster information may be entered in 5
alternative tab-delimited file formats (please see the user
manual for a more detailed description). Once these files
have been loaded, the user pushes a “submit” button to
close the starting window and open the main window.
Once in the main window of the system, the user may
search all loaded genomes by (1) gene annotation or (2)
common homology group ID number. All computed
genomic groupings in all organisms that contain one or
more genes that match the search query are retrieved
and organized in to a multidendrogram, according to a
dissimilarity measure and linkage function. As a default,
the starting context set defines genomic groupings only as
the annotated features that match a search query (called
the “SingleGene” context set), however 6 additional context sets are available, and may be accessed by clicking the
“Add/Remove” button in the starting frame. Available genomic grouping schemes include organizing genes into
operons, taking a range of nucleotides or genes around a
query match, and loading a customized set of genomic
groupings from file (for a complete description, please see
the user manual). In this program, we have implemented 4
genomic grouping comparison metrics (or dissimilarity
measures), each of which are appropriate for different use
cases. If the genomic groupings that comprise a given context set are large, we suggest using either “Common Genes
– Dice” or “Common Genes – Jaccard” metrics, which implement the set-based Dice and Jaccard dissimilarity
approaches [37], with the individual annotated features
within each grouping acting as elements and the whole
genomic grouping acting as the set. If genomic groupings
contain the same annotated features, however vary in the
intergenic spacing between features, we recommend using
the “Moving Distances” approach, which uses gene order
and intergenic spacing to describe differences between
contexts. Changes in intergenic spacing between genes
within an operon has been experimentally shown to be
related to gene co-expression in E. coli and B. subilits) [4],
and may be a reflection of microbial gene regulatory networks changing over evolutionary time [3,4]. Finally, if the
context set under investigation does not appear to change
significantly except in the size of one or more genes, the
“Total Length” dissimilarity metric may be effective (this is
especially useful in for genomic groupings that consist of
only one or a few genes). A more detailed description of
these dissimilarity metrics is available in the user manual.
Linkage methods and display options available in the original multidendrograms package [27] are re-implemented
here, which allows for easy re-computation of the context
tree. All generated trees appear as individual internal
frames; the user may therefore work on several alternative
contexts at once (changes in tree computation and rendering will affect only the tree in focus). Individual leaves on
the tree (which each represent a single context set grouping) are named by concatenating the name of the organism
from which they derive to a serial number of the instance
that a query match was found within that organism. Individual leaves on the tree may be selected by clicking on
their name, clicking the “select all” button, or entering a
leaf name search filter in the genomic context viewer tool
search bar (located below the tree). Subsequent mouse
clicks may bring up child windows either for (1) annotations of the query matches for selected, or (2) a multigenome browser window (context viewer window). As
depicted in (Figure 1A), the start window, main window,
and context viewer window are the central components of
Seitzer et al. BMC Bioinformatics 2013, 14:18
http://www.biomedcentral.com/1471-2105/14/18
the tool, and various child windows are available within the
main window and context viewer windows.
The context viewer window (Figure 1B) is a multigenome browser specifically designed to interrogate analogous gene groupings across many species (or multiple
genomic regions within a single species), rather than explore the genome of a single species. Individual genes are
rendered as colored rectangles, oriented above or below a
centerline to represent their placement on the forward
(above centerline) or reverse (below centerline) strand.
Each segment is centered about the center of each gene
grouping. Below all rendered contexts, a “genomic display”
sub-panel contains check box options to (1) show/hide
genomic coordinates, (2) normalize displayed contexts
according to strand (which may allow for easier visual inspection of analogous contexts), (3) display genes surrounding each context that are not a part of the context,
and (4) color the genes surrounding the context (if this is
unchecked, surrounding genes are displayed as gray).
Genes are colored according to homology or common annotation, depending on the method used to generate the
context tree. Left clicking on individual genes within a
rendered context brings up a pop-up window displaying
biological information related to each gene (this information may be modified in a “gene information sub-panel”).
Right clicking enables exporting rendered contexts as an
image and offers the option to display a gene color legend.
Middle clicking selects the clicked gene as well as all homologous genes or genes that with the same annotation
(depending on the initial search type) displayed in the
frame. Finally, the rendered range of each context may be
easily changed using the “range around context segment”
sub-panel, and clicking an “update contexts” button. The
context viewer window and main window are actively
linked; modifying selected leaves in the tree, for example,
will add or remove these leaves in the context viewer window after clicking the “update contexts” button. The tool
is designed to facilitate coordination of the context tree
and the context viewer window – such coordination may
inspire re-investigation of the same gene of interest using
alternative context groupings, or re-computation of the
context tree using a different clustering algorithm.
Page 5 of 8
misannotate hpxW as ggt. Fortunately, the ggt enzyme
has been characterized in several microbial organisms,
[39] and has a genomic context very different from the
hpxW context (ggt occurs as a single gene, hpxW in an
operon with at least 3 other genes). Therefore, by taking
into account context as well as homology, it is possible
to accurately separate ggt genes from hpxW genes.
We used JContextExplorer to attempt to separate ggt
genes from hpxW genes in 22 alpha and gamma proteobacterial species based on differences between ggt and
hpxW contexts. We found that ggt and hpxW grouped
into two major out-branches (Figure 3). Interestingly, we
discovered a third group, where manual investigation
revealed that it was unclear if these genes were ggt or
hpxW (data not shown). Visualization of the contexts in
the hpxW group revealed agreement with previously
described hpxWXYZ structures, and a comparison of a
whole-genome phylogenetic tree with the ggt / hpxW context tree (Additional file 2) revealed good agreement
among closely related organisms. Details relating to the
methods associated with the above analyses are also available (Additional file 3). This investigation highlights the
utility of combining automation (generating the ggt/hpxW
context tree) with manual interrogation (investigation
using the multi-genome browser context viewer tool).
Analysis of the hpxW and ggt genes in 22 alpha and
gamma proteobacteria
Conclusion
Comparing genomic contexts across organisms is an effective but underutilized technique. While a handful of
custom approaches have been developed, no universal platform for cross-species genomic context analyses has yet
been produced. We have developed JContextExplorer to
address this need. We have attempted to make JContextExplorer easy to install and use by offering our program
as a GUI WebStart application (launching is as simple as
navigating to a website, and clicking on the appropriate
button). Additionally, our program is organized in a way
that does not require a steep learning curve among prospective users. To help new users, we provide an extensive
user manual and a series of video tutorials (Additional file
1) along with the program executable (Additional file 4).
We hope that JContextExplorer may find use in the bioinformatics community with its emphases of producing a
positive user experience and simultaneously offering a navigable tool of high quality and portability.
In the gamma-proteobacterial species Klebsiella oxytoca
M5a1, the hpxW gene is known to form an operon with
hpxW, hpxY, and hpxZ [38]. The hpxW gene, however, is
highly homologous to another gene encoding gammaglutamyl transpeptidase (ggt). A sequence alignment of
K. oxytoca hpxW and Escherichia coli ggt revealed that
their amino acid sequences are almost co-linear and
share 30% identity. This high degree of homology confuses automated annotation programs, which often
Availability and requirements
Project Name: JContextExplorer
Operating System: Platform independent
Programming language: Java
Other requirements: None.
License: Source code and binary executable are available
under terms of the GPL free software license (version 2 or later) at http://www.bme.ucdavis.edu/facciotti/
Seitzer et al. BMC Bioinformatics 2013, 14:18
http://www.biomedcentral.com/1471-2105/14/18
Page 6 of 8
Figure 3 hpxW and ggt context tree. Clusters of all homologous gene clusters in 22 alpha and gamma proteobacterial species were
constructed using BLAST [33] and tribe-MCL [34]. All ggt and hpxW genes naturally grouped into the same homology cluster. Using
JContextExplorer, we defined a context set, which we named “D75”, that placed all genes on the same strand within 75 nucleotides of each
other into common gene groupings. We constructed a context tree of the ggt/hpxW homology cluster using the “Common Genes – Dice”
dissimilarity metric and “Joint Between-Within” linkage function (above). The data segmented into two branches, one of which corresponded to
the previously described hpxW context (green box), and the other into a combination of the ggt context (blue box) and an undetermined third
group. Manual inspection of individual contexts in the third group might reveal that some members of this group belong with the ggt group,
and some with the hpxW group. Additionally, some members in this third unknown group could represent “transitional” cases between the
hpxW and ggt gene (a gene that performs the functions of both hpxW and ggt, for example). JContextExplorer’s context viewer tool proved
helpful in manually interrogating this third group.
Seitzer et al. BMC Bioinformatics 2013, 14:18
http://www.biomedcentral.com/1471-2105/14/18
resources_data/software/. Incorporation into commercial
software under non-GPL terms is possible by obtaining a
custom license from the University of California.
URL: http://www.bme.ucdavis.edu/facciotti/resources_data/software/.
Additional files
Additional file 1: ContextExplorer User Manual. Comprehensive
user manual, including installation / use instructions, examples,
diagrams, contact information, and links to website, tutorial videos,
source code, and other resources.
Additional file 2: Supplementary Figures and Methods related to
separating hpxW from ggt in 22 alpha and gamma proteobacteria.
Visualization of hpxW contexts, comparison of whole-species phylogeny
to hpxW sub-portion of JContextExplorer-generated context tree, and
detailed description of methods associated with hpxW/ggt analysis.
Additional file 3: Alpha and Gamma proteobacteria biological
information. Annotated genomes of 22 alpha and gamma
proteobacterial species, whole-species phylogenetic tree for 22 alpha and
gamma proteobacterial species, and MCL-tribe determined homology
clusters for 22 alpha and gamma proteobacterial species.
Additional file 4: JContextExplorer version 1.07. Executable JAR file
of the latest version of the JContextExplorer program. Program may
be launched on any computer with the Java runtime environment (JRE)
installed. The program may be launched either from a command line or
by double-clicking on the program icon.
Competing interests
The authors declare they have no competing interests.
Authors’ contributions
PS wrote the source code and drafted the manuscript. PS and TH analyzed
the hpxWXYZ operon in alpha and gamma proteobasterial species with TH,
which was instrumental in the development of JContextExplorer. TH also
helped write the background information regarding purine catabolism and
the hpxW gene in alpha and gamma proteobacteria, in the supplemental
information. MF provided essential feedback for software development and
oversaw the project, and helped to interpret results related to the hpxWXYZ
genomic contexts. All authors contributed to the preparation of the
manuscript, and have read and approved the final manuscript.
Page 7 of 8
3.
4.
5.
6.
7.
8.
9.
10.
11.
12.
13.
14.
15.
16.
17.
18.
19.
Acknowledgements
Erin Lynch provided instrumental feedback for the development of the
program, especially from the point of view of essential, biologically
meaningful features. Aaron Darling provided helpful advice for the Java
implementation, and aid in running the PhyloSift program. Dr. Valley Stewart
provided expert knowledge of the hpxWXYZ operon in alpha and gamma
proteobacterial species, and aided in discussions of the project. Support for
PS and MTF came from NSF EF-094953 and startup funds to MTF.
Author details
1
Department of Biomedical Engineering, One Shields Ave, University of
California, Davis, CA 95616, USA. 2Genome Center, One Shields Ave,
University of California, Davis, CA 95616, USA. 3Microbiology Graduate Group,
One Shields Ave, University of California, Davis, CA 95616, USA.
20.
21.
22.
23.
24.
Received: 10 October 2012 Accepted: 21 December 2012
Published: 16 January 2013
25.
References
1. Wolf YI, Rogozin IB, Grishin NV, Koonin EV: Genome trees and the tree of
life. Trends in genetics: TIG 2002, 18:472–479.
2. Kuzniar A, van Ham RCHJ, Pongor S, Leunissen JaM: The quest for orthologs:
finding the corresponding gene across genomes. Trends in genetics: TIG
2008, 24:539–551.
26.
27.
Price MN, Huang KH, Arkin AP, Alm EJ: Operon formation is driven by
co-regulation and not by horizontal gene transfer. Genome Res 2005,
15:809–819.
Price MN, Arkin AP, Alm EJ: The life-cycle of operons. PLoS Genet 2006,
2:e96.
Novichkov PS, Rodionov DA, Stavrovskaya ED, Novichkova ES, Kazakov AE,
Gelfand MS, Arkin AP, et al: RegPredict: an integrated system for regulon
inference in prokaryotes by comparative genomics approach. Nucleic
Acids Res 2010, 38:W299–W307.
Zu M, Esteban CD, Deutscher J, Pe G: Horizontal gene transfer in the
molecular evolution of mannose PTS transporters. Mol Biol Evol 2005,
22:1673–1685.
Rogozin IB, Makarova KS, Murvai J, Czabarka E, Wolf YI, Tatusov RL, Szekely L,
Koonin EV: Connected gene neighborhoods in prokaryotic genomes.
Nucleic Acids Res 2002, 30:2212–2223.
Kojima KK, Kanehisa M: Systematic survey for novel types of prokaryotic
retroelements based on gene neighborhood and protein architecture.
Mol Biol Evol 2008, 25:1395–1404.
Overbeek R, Fonstein M, D’Souza M, Pusch GD, Maltsev N: The use of gene
clusters to infer functional coupling. Proc Natl Acad Sci USA 1999,
96:2896–2901.
Itoh T, Takemoto K, Mori H, Gojobori T: Evolutionary instability of operon
structures disclosed by sequence comparisons of complete microbial
genomes. Mol Biol Evol 1999, 16:332–346.
Wolf YI, Rogozin IB, Kondrashov AS, Koonin EV: Genome alignment,
evolution of prokaryotic genome organization, and prediction of gene
function using genomic context. Genome Res 2001, 11:356–372.
Jensen LJ, Kuhn M, Stark M, Chaffron S, Creevey C, Muller J, Doerks T, et al:
STRING 8–a global view on proteins and their functional interactions in
630 organisms. Nucleic Acids Res 2009, 37:D412–D416.
Tang H, Bowers JE, Wang X, Ming R, Alam M, Paterson AH: Synteny and
collinearity in plant genomes. Science (New York, N.Y.) 2008, 320:486–488.
Wang Y, Tang H, Debarry JD, Tan X, Li J, Wang X, Lee T-h, et al: MCScanX:
a toolkit for detection and evolutionary analysis of gene synteny and
collinearity. Nucleic Acids Res 2012, 40:e49.
Proost S, Fostier J, De Witte D, Dhoedt B, Demeester P, Van de Peer Y,
Vandepoele K: i-ADHoRe 3.0–fast and sensitive detection of genomic
homology in extremely large data sets. Nucleic Acids Res 2012, 40:e11.
Flicek P, Amode MR, Barrell D, Beal K, Brent S, Carvalho-Silva D, Clapham P,
et al: Ensembl 2012. Nucleic Acids Res 2012, 40:D84–D90.
Markowitz VM, Korzeniewski F, Palaniappan K, Szeto E, Werner G, Padki A,
Zhao X, et al: The integrated microbial genomes (IMG) system. Nucleic
Acids Res 2006, 34:D344–D348.
Mavromatis K, Chu K, Ivanova N, Hooper SD, Markowitz VM, Kyrpides NC:
Gene context analysis in the Integrated Microbial Genomes (IMG) data
management system. PLoS One 2009, 4:e7979.
Proost S, Van Bel M, Sterck L, Billiau K, Van Parys T, Van de Peer Y,
Vandepoele K: PLAZA: a comparative genomics resource to study gene
and genome evolution in plants. Plant Cell 2009, 21:3718–3731.
Muffato M, Louis A, Poisnel C-E, Roest Crollius H: Genomicus: a database
and a browser to study gene synteny in modern and ancestral
genomes. Bioinformatics (Oxford, England) 2010, 26:1119–1121.
Karolchik D, Baertsch R, Diekhans M, Furey TS, Hinrichs A, Lu YT, Roskin KM, et
al: The UCSC genome browser database. Nucleic Acids Res 2003, 31:51–54.
Bare JC, Koide T, Reiss DJ, Tenenbaum D, Baliga NS: Integration and
visualization of systems biology data in context of the genome.
BMC Bioinforma 2010, 11:382.
Skinner ME, Uzilov AV, Stein LD, Mungall CJ, Holmes IH: JBrowse: a nextgeneration genome browser. Genome Res 2009, 19:1630–1638.
Keseler IM, Bonavides-Martínez C, Collado-Vides J, Gama-Castro S, Gunsalus
RP, Johnson DA, Krummenacker M, et al: EcoCyc: a comprehensive view of
Escherichia coli biology. Nucleic Acids Res 2009, 37:D464–D470.
Byrne KP, Wolfe KH: The yeast gene order browser: combining curated
homology and syntenic context reveals gene fate in polyploid species.
Genome Res 2005, 15:1456–1461.
Dehal PS, Joachimiak MP, Price MN, Bates JT, Baumohl JK, Chivian D,
Friedland GD, et al: MicrobesOnline: an integrated portal for comparative
and functional genomics. Nucleic Acids Res 2010, 38:D396–D400.
Gomez S, Fernandez A, Montiel J, Torres D: Solving Non-uniqueness in
agglomerative hierarchical clustering using multidendrograms. J Classif
2008, 65:43–65.
Seitzer et al. BMC Bioinformatics 2013, 14:18
http://www.biomedcentral.com/1471-2105/14/18
Page 8 of 8
28. Lathe WC III, Snel B, Bork P: Gene context conservation of a higher order
than operons. Mol Biol 2000, 13:25388–25392.
29. Sharma AK, Walsh Da, Bapteste E, Rodriguez-Valera F, Ford Doolittle W,
Papke RT: Evolution of rhodopsin ion pumps in haloarchaea. BMC Evol
Biol 2007, 7:79.
30. Techtmann SM, Lebedinsky AV, Colman AS, Sokolova TG, Woyke T, Goodwin
L, Robb F: Evidence for horizontal gene transfer of anaerobic carbon
monoxide dehydrogenases. Front Microbiol 2012, 3:132.
31. Holland RCG, Down TA, Pocock M, Prlić A, Huen D, James K, Foisy S, et al:
BioJava: an open-source framework for bioinformatics. Bioinformatics
(Oxford, England) 2008, 24:2096–2097.
32. Mutton P, Arnaud B: Java EPS graphics 2D. http://jlibeps.sourceforge.net/.
33. Altschul S, Gish W, Miller W, Myers E: Basic local alignment search tool.
J Mol Biol 1990, 215:403–410.
34. Enright AJ, Van Dongen S, Ouzounis C: An efficient algorithm for largescale detection of protein families. Nucleic Acids Res 2002, 30:1575–1584.
35. Li L, Stoeckert CJ, Roos DS: OrthoMCL: identification of ortholog groups
for eukaryotic genomes. Genome Res 2003, 13:2178–2189.
36. Chen F, Mackey AJ, Stoeckert CJ, Roos DS: OrthoMCL-DB: querying a
comprehensive multi-species collection of ortholog groups. Nucleic Acids
Res 2006, 34:D363–D368.
37. Pandit S, Gupta S: A COMPARATIVE STUDY ON DISTANCE MEASURING.
IEEE Trans Neural Netw 2011, 2:29–31.
38. Pope SD, Chen L-L, Stewart V: Purine utilization by Klebsiella oxytoca
M5al: genes for ring-oxidizing and -opening enzymes. J Bacteriol 2009,
191:1006–1017.
39. Liebert MA, Masip L, Veeravalli K, Georgiou G: The many faces of
glutathione in bacteria. Antioxid Redox Signal 2006, 8:753–763.
doi:10.1186/1471-2105-14-18
Cite this article as: Seitzer et al.: JContextExplorer: a tree-based
approach to facilitate cross-species genomic context comparison. BMC
Bioinformatics 2013 14:18.
Submit your next manuscript to BioMed Central
and take full advantage of:
• Convenient online submission
• Thorough peer review
• No space constraints or color figure charges
• Immediate publication on acceptance
• Inclusion in PubMed, CAS, Scopus and Google Scholar
• Research which is freely available for redistribution
Submit your manuscript at
www.biomedcentral.com/submit