1
User’s Manual
Version 1.6
Douglas B. Craig
Kazi Zakia Sultana
Alan A. Dombkowski
Wayne State University
School of Medicine
Division of Clinical Pharmacology & Toxicology
miR-AT! User’s Manual
v1.6
Table of Contents
1 WHAT IS MIR-AT! ?...................................................................................................................................... 1
2 SEARCHING.................................................................................................................................................... 2
3 RESULTS......................................................................................................................................................... 4
3.1 Gene and Transcript Identifiers....................................................................................................................4
3.2 Binding Sites Detail.....................................................................................................................................5
3.3 Score Distributions......................................................................................................................................6
3.4 Functional Annotation using DAVID........................................................................................................... 7
3.5 Gene Expression Upload.............................................................................................................................. 7
3.6 Results Download........................................................................................................................................ 9
4 CLUSTERING................................................................................................................................................ 10
4.1 Similarity Metrics...................................................................................................................................... 10
4.2 Viewing Clustering Results with Java TreeView......................................................................................... 13
4.3 Saving Clustering Results with Java TreeView...........................................................................................16
5 TROUBLESHOOTING.................................................................................................................................. 19
6 VERSION HISTORY..................................................................................................................................... 20
7 REFERENCES............................................................................................................................................... 22
8 ACKNOWLEGEMENTS & PERMISSIONS................................................................................................ 23
9 APPENDIX A.................................................................................................................................................26
-i-
miR-AT! User’s Manual
v1.6
4 August 2011
©2011 Wayne State University.
Contact:
Alan Dombkowski, Ph.D.
Director, Functional Genomics and Bioinformatics Facility
Division of Clinical Pharmacology and Toxicology
Wayne State University
Room 3N47
Children's Hospital of Michigan
3901 Beaubien
Detroit, MI 48201-2119
USA
domski [at] wayne.edu
- ii -
miR-AT! User’s Manual
v1.6
1 What is miR-AT! ?
microRNAs are short, endogenous oligonucleotides that have been implicated in a wide variety of diseases. The
mature form of microRNAs (miRNAs) are approximately 22 nucleotides in length and anneal to complementary
sites in the 3’ untranslated region (UTR) of target transcripts as part of an RNA-induced silencing complex (RISC)
complex. While microRNAs appear to act through multiple mechanisms, two general modes of action have been
identified: transcript degradation and inhibition of protein translation [1-3]. The former is associated with nearperfect base complementarity between an miRNA and its target sequence, while non-perfect miRNA-target matches
result in inhibition of protein translation and is the dominant mode of miRNA activity reported in eukaryotes.
However, a number of recent reports have shown that non-perfect complementarity can also result in mRNA
degradation through poly(A) deadenylation [4,5]. Therefore, the effect of microRNA activity may be reflected by
changes of either mRNA or protein levels, depending on the microRNA and target transcript involved. There are
currently over 700 known miRNAs in the human genome, and each miRNA may regulate dozens to hundreds of
target transcripts. Many reports have shown numerous miRNAs aberrantly expressed in a variety of diseases,
including cancer, and indicate that hundreds and perhaps thousands of transcript targets could potentially be affected
in neoplastic tissue. The 3’ UTR in a single messenger RNA may contain binding sites for a number of microRNAs,
and a transcript can be concurrently repressed by multiple microRNA species [6]. Thus, the genome-wide
complexity of miRNA-induced regulation presents a formidable challenge, particularly when assessing the impact of
multiple dysregulated miRNAs.
Mounting evidence reveals that microRNAs can exert a cooperative effect on target gene repression. Since a gene
product may be simultaneously repressed by multiple microRNAs, and a number of microRNAs may be
differentially expressed in a given disease condition, it is essential to consider their combinatorial interactions
[1,3,7,8].
miR-AT! (microRNA Combinatorial Analysis of Targets) leverages and integrates several existing, high-quality
databases to enable combinatorial microRNA target characterization and functional analysis. Among the features of
miR-AT! are: the ability to predict combinatorial targets of multiple microRNAs, user specified parameters for
minimum number of sites and number of unique microRNAs required in each target, minimum score criteria, an
integrated link for functional annotation of predicted targets, and the ability to cluster microRNAs and their target
genes based on target site patterns in the transcripts.
-1-
miR-AT! User’s Manual
v1.6
2 Searching
miR-AT! can be found at http://mir-at.org As of Version 1.6 it is no longer necessary to log in using a
username/password (all sessions are anonymous). The miR-AT! application Search screen is displayed (Figure 1).
To initiate a search enter a list of miRNA identifiers into the Enter a list of miRNA textbox. This list can be
either: one ID per line, a comma separated list, or a tab separated list. Use the List separator buttons to match the
list format (the default is one miRNA ID per line). To see an example of a valid miRNA identifier simply click on
the example above the textbox.
Figure 1. miR-AT! Search screen.
-2-
miR-AT! User’s Manual
v1.6
miR-AT! currently supports three organisms from the MicroCosm Targets database: human, rat and mouse. Select
the desired organism for your search using the Select organism radio buttons. Searches can be constrained in
four different ways:
Minimum number of miRNA sites per transcript
Specifies the minimum number of miRNA binding sites on a given transcript. Note that one miRNA may bind
at more than one site. Each unique site is counted. For example, setting the minimum to three will match a
transcript with three different binding sites for a single miRNA as well as a transcript with single binding sites
for three different miRNA. To specify a minimum number of miRNAs use the next parameter.
Minimum number of input miRNAs per transcript
Specifies the minimum number of unique miRNAs (from the input list) that must bind to the transcript. Note
that one miRNA may bind at more than one site. For example, a transcript may have five binding sites, but only
two miRNA where one miRNA binds at two sites, and the other miRNA binds at three. To specify a minimum
number of sites use the previous parameter.
Minimum individual site score
Specifies the minimum MicroCosm score for miRNA binding sites. Analysis of nearly 900,000 target scores in
the MicroCosm database reveals a near-normal distribution with a mean score of 16.398 and a standard
deviation of 0.883. Based on the score distribution, the default minimum score of 15.00 eliminates the lowest
5% of scores from the MicroCosm database.
Maximum individual site p-value
Specifies the maximum MicroCosm miRNA binding site score p-value. Effectively, with a default value of
1.00, miR-AT! does not limit binding sites by p-value. To more tightly constrain your search choose an
appropriate p-value.
Once the search parameters have been set, initiate the search by clicking on the Search button. A new search can be
initiated at any time by clicking Search on the navigation bar at the top of the page to return to this page.
-3-
miR-AT! User’s Manual
v1.6
3 Results
Depending on the number of input miRNAs and search parameters a search may take anywhere from a fraction of a
second to a couple minutes. Once the the search is complete the Results page is displayed (Figure 2).
By default results are sorted by number of sites and cumulative site score. Results can be sorted by any column
(e.g., Gene Name, Ensembl ID) simply by clicking on the column header.
Figure 2. miR-AT! Search results.
3.1 Gene and Transcript Identifiers
To view gene details for a particular match click on the blue Ensembl ID (Figure 3). This opens a new browser
window with search results from the Ensembl database.
Figure 3. Search results gene identifier hyperlink.
-4-
miR-AT! User’s Manual
v1.6
To view gene transcript details for a particular match click on the blue Ensembl Transcript ID (Figure 4). This
opens a new browser window with search results from the Ensembl database.
Figure 4. Search results transcript identifier hyperlink.
3.2 Binding Sites Detail
miRNA binding site details for each match can be viewed by clicking on the blue Number of Sites link (Figure 5).
Figure 5. Search results binding site details hyperlink.
A detailed list of miRNAs, their exact binding site on the transcript, orientation (+/-), p-value and binding site score
is displayed (Figure 6). In addition, a complete list of all miRNAs that target this gene are given as an aid to the
researcher.
Figure 6. Input miRNAs and other miRNAs that target the gene transcript.
To return to the main Results page use the browser back button.
-5-
miR-AT! User’s Manual
v1.6
3.3 Score Distributions
To display distribution statistics across all Results click on the DISTRIBUTION button (Figure 7).
Figure 7. Display target score distribution histograms.
This will calculate the distribution of individual miRNA scores across all results as well as the distribution of
cumulative scores for genes. The browser will automatically reposition viewing to the bottom of the page (i.e.,
below the results) once the distributions have been calculated and displayed (Figure 8).
Figure 8. miRNA target score distribution histograms.
3.4 Functional Annotation using DAVID
To automatically feed the entire results list of genes for the chosen organism to DAVID click on the
FUNCTIONAL ANNOTATION button at the top of the Results page (Figure 9).
Figure 9. Display functional annotations for the resulting list of genes using DAVID.
For more information about using and interpreting DAVID Functional Annotations visit:
http://david.abcc.ncifcrf.gov/
-6-
miR-AT! User’s Manual
v1.6
3.5 Gene Expression Upload
miR-AT! search results can be optionally matched with gene expression data. Click on the EXPRESSION button
to expand the expression upload option (Figure 10).
↓
Figure 10. Expand EXPRESSION upload option and select a file to upload.
Use the BROWSE button to select a gene expression text file to upload. The first column of the file must contain a
list of identifiers. miR-AT! currently accepts either Ensembl Transcript identifiers or Entrez Gene identifiers.
These two types may be mixed in the same file. An optional second column contains the associated expression level
(or may be blank). All columns beyond the first two are simply ignored. Columns may be separated either by
comma or tab. miR-AT! will ignore all spaces in the file. Identifiers are case insensitive. In the event that two
identifiers refer to the same output result the expression level of the last identifier takes precedence.
Once uploaded the Search results are updated (Figure 11) to show any genes with matching expression data. The
first column, EXPRESSED, indicates a match with a checkmark. If expression level data is provided it is displayed
in the second column, EXPRESSION LEVEL. Both columns are sortable. Note that expression data must be
reloaded after each new search.
Figure 11. Search results updated with gene expression data.
-7-
miR-AT! User’s Manual
v1.6
3.6 Results Download
To download results as either a plain text file (tab-separated) or as a CSV file (comma-separated) for use in a
spreadsheet click on the appropriate RESULTS button at the top of the Results page (Figure 12).
Figure 12. Download the results as either plain text or a CSV file.
Depending on your computer operating system, a dialog may open to allow you to either open or save the file
(Figure 13). Some browsers download the file directly (e.g., Chrome) without a dialog.
Figure 13. Open/Save results dialog.
-8-
miR-AT! User’s Manual
v1.6
4 Clustering
miR-AT! employs standard hierarchical clustering techniques in a novel way. Whereas typical clustering would
have gene transcripts on the vertical axis and samples (e.g., expression arrays) on the horizontal with clustering
results representing gene expression profiles, miR-AT! clusters transcripts with respect to the input set of
microRNAs on the horizontal with clustering results predicting transcripts with similar miRNA target sites profiles .
Clustering distance using this method then is simply a function of microRNA-transcript target site scores.
To begin cluster miR-AT! Search results click on the CLUSTERING button to expand clustering options (Figure
14).
↓
Figure 14. Expand CLUSTERING options.
Select the similarity metric to use for clustering from the dropdown menu then click the Run CLUSTERING
button. Similarity metrics are described in the next section.
An animated graphic wheel will display while clustering results are calculated. When the clustering is complete the
graphic will be replaced by the View RESULTS button. A delay of 30 seconds or more is common the first time
clustering is run.
4.1 Similarity Metrics
In order to cluster miRNA transcripts and the genes they interact with the user must select a metric by which
similarity is to be measured. To cluster search results miR-AT! uses the “C Clustering Library” developed by
Michiel de Hoon et al. at the Laboratory of DNA Information Analysis, Human Genome Center, Institute of Medical
Science, University of Tokyo. Eight similarity metrics are available with this library. All are available from the
CLUSTERING dropdown menu. The descriptions given below are taken from the C Clustering Library
documentation [9].
-9-
miR-AT! User’s Manual
v1.6
4.1.1 (Pearson) Correlation, Centered
The Pearson correlation coefficient is defined as:
r=
1 n xi − x y i − y
∑
n i =1 σ x σ y
in which , are the sample mean of x and y respectively, and σx , σy are the sample standard deviation of x and y. The
Pearson correlation coefficient is a measure for how well a straight line can be fitted to a scatterplot of x and y. If all
the points in the scatterplot lie on a straight line, the Pearson correlation coefficient is either +1 or -1, depending on
whether the slope of line is positive or negative. If the Pearson correlation coefficient is equal to zero, there is no
correlation between x and y. The Pearson distance is then defined as:
dP ≡ 1− r
As the Pearson correlation coefficient lies between -1 and 1, the Pearson distance lies between 0 and 2. Note that
the Pearson correlation automatically centers the data by subtracting the mean, and normalizes them by dividing by
the standard deviation. While such normalization may be useful in some situations (e.g., when clustering gene
expression levels directly instead of gene expression ratios), information is being lost in this step. In particular, the
magnitude of changes in gene expression is being ignored. This is in fact the reason that the Pearson distance does
not satisfy the triangle inequality.
4.1.2 (Pearson) Absolute Correlation, Centered
By taking the absolute value of the Pearson correlation, we find a number between zero and one. If the absolute
value is one, all the points in the scatter plot lie on a straight line with either a positive or a negative slope. If the
absolute value is equal to zero, there is no correlation between x and y. The distance is defined as usual as:
dA ≡1− r
where r is the Pearson correlation coefficient. As the absolute value of the Pearson correlation coefficient lies
between 0 and 1, the corresponding distance lies between 0 and 1 as well. In the context of gene expression
experiments, note that the absolute correlation is equal to one if the gene expression data of two genes/microarrays
have a shape that is either exactly the same or exactly opposite. The absolute correlation coefficient should therefore
be used with care.
4.1.3 (Pearson) Correlation, Uncentered
In some cases, it may be preferable to use the uncentered correlation instead of the regular Pearson correlation
coefficient. The uncentered correlation is defined as:
rU =
1 n xi
∑
n i =1 σ x( 0)
y i
( 0)
σ y
where:
σ x(0 ) =
1 n 2
∑ xi
n i =1
- 10 -
miR-AT! User’s Manual
v1.6
σ y(0 ) =
1 n 2
∑ yi
n i =1
This is the same expression as for the regular Pearson correlation coefficient, except that the sample means , are set
equal to zero. The uncentered correlation may be appropriate if there is a zero reference state. For instance, in the
case of gene expression data given in terms of log-ratios, a log-ratio equal to zero corresponds to the green and red
signal being equal, which means that the experimental manipulation did not affect the gene expression. The distance
corresponding to the uncentered correlation coefficient is defined as:
dU ≡ 1 − rU
where rU is the uncentered correlation. As the uncentered correlation coefficient lies between -1 and 1, the
corresponding distance lies between 0 and 2. The uncentered correlation is equal to the cosine of the angle of the
two data vectors in n-dimensional space, and is often referred to as such. (From this viewpoint, it would make
more sense to define the distance as the arc cosine of the uncentered correlation coefficient).
4.1.4 (Pearson) Absolute Correlation, Uncentered
As for the regular Pearson correlation, we can define a distance measure using the absolute value of the uncentered
correlation:
d AU ≡ 1 − rU
where rU is the uncentered correlation coefficient. As the absolute value of the uncentered correlation coefficient lies
between 0 and 1, the corresponding distance lies between 0 and 1 as well. Geometrically, the absolute value of the
uncentered correlation is equal to the cosine between the supporting lines of the two data vectors (i.e., the angle
without taking the direction of the vectors into consideration).
4.1.5 Spearman Rank Correlation
The Spearman rank correlation is an example of a non-parametric similarity measure. It is useful because it is more
robust against outliers than the Pearson correlation. To calculate the Spearman rank correlation, replace each data
value by its rank from ordering each vector by its value. The Pearson correlation is then calculated between the two
rank vectors instead of the data vectors. Weights cannot be suitably applied to the data if the Spearman rank
correlation is used, especially since the weights are not necessarily integers. The calculation of the Spearman rank
correlation in the C Clustering Library therefore does not take any weights into consideration. As in the case of the
Pearson correlation a distance measure can be defined corresponding to the Spearman rank correlation as:
d S ≡ 1 − rS
where rS is the Spearman rank correlation.
4.1.6 Kendall’s tau
Kendall's τ is another example of a non-parametric similarity measure. It is similar to the Spearman rank correlation,
but instead of the ranks themselves only the relative ranks are used to calculate τ [10]. As in the case of the
- 11 -
miR-AT! User’s Manual
v1.6
Spearman rank correlation, the weights are ignored in the calculation. We can define a distance measure
corresponding to Kendall's τ as:
dK ≡ 1−τ
As Kendall's τ is defined such that it will lie between -1 and 1, the corresponding distance will be between 0 and 2.
4.1.7 Euclidean Distance
The Euclidean distance is a true metric, as it satisfies the triangle inequality. The C Clustering Library package
defines the Euclidean distance as:
d=
1 n
2
∑ ( xi − y i )
n i =1
Only those terms are included in the summation for which both xi and yi are present. The denominator n is chosen
accordingly. In this formula, the expression data xi and yi are subtracted directly from each other. Therefore, make
sure that the expression data is properly normalized when using the Euclidean distance, for example by converting
the measured gene expression levels to log-ratios. Unlike the correlation-based distance functions, the Euclidean
distance takes the magnitude of the expression data into account. It therefore preserves more information about the
data and may be preferable. See [11] for an example of the use of the Euclidean distance for k-means clustering.
4.1.8 City-Block Distance
The city-block distance, alternatively known as the Manhattan distance, is related to the Euclidean distance.
Whereas the Euclidean distance corresponds to the length of the shortest path between two points, the city-block
distance is the sum of distances along each dimension. As gene expression data tend to have missing values the cityblock distance is defined as the sum of distances divided by the number of dimensions:
d=
1 n
∑ xi − y i
n i =1
This is equal to the distance one would have to walk between two points in a city, where you have to walk along city
blocks. The city-block distance is a metric, as it satisfies the triangle inequality. As for the Euclidean distance, the
expression data are subtracted directly from each other, and care should be taken that they are properly normalized.
- 12 -
miR-AT! User’s Manual
v1.6
4.2 Viewing Clustering Results with Java TreeView
Once clustering calculations are complete and results are available (i.e., the Run CLUSTERING button has been
clicked and no errors have been detected) the View RESULTS button becomes visible (Figure 15).
Figure 15. "View RESULTS" button.
Click on the View RESULTS button to launch the Java TreeView applet with the current clustering results.
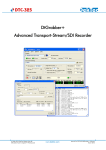
Java TreeView divides the clustering results into three main panels (see Figure 16):
1.
a Heat Diagram of microRNA versus transcripts.
a.
a hierarchical clustering (dendrogram) of microRNAs is displayed to the top
b.
a hierarchical clustering (dendrogram) of genes is displayed to the left
2.
a magnification of a selected region of the Heat Diagram
3.
a list of gene names from the selected region
A region of interest/magnification is selected in panel (1) by dragging the mouse over the heat diagram to created a
bounded rectangle.
- 13 -
miR-AT! User’s Manual
v1.6
1a
1b
1
2
3
Figure 16. Clustering results displayed in Java TreeView application.
- 14 -
miR-AT! User’s Manual
v1.6
4.3 Saving Clustering Results with Java TreeView
** IMPORTANT **
By default miR-AT! cannot save clustering results to a local disk drive. This is
a security feature of the Java language to keep applets running in your browser
from accessing your private information or maliciously writing files to your
computer. To allow the Java TreeView applet to save results to your local
machine see Appendix A.
****
To save Java TreeView clustering results to an image file click on Export | Export to Image…
The Export to Image dialog (Figure 17) will open (if it does not then see Appendix A). By default the applet points
to the miR-AT! server. Files cannot be saved to the server. Instead, enter a valid path to your local disk drive (e.g.,
C:\data\results.png) in the Export To: text box. Select a image file format. Click on the Save button.
Figure 17. Export to Image dialog in Java TreeView.
Depending on how many genes are in the results it may be necessary to disable display of individual gene names.
This can be done by holding the Ctrl key down and clicking on NAME in the Gene Headers list to de-select this
header. Cell/pixel size of individual heat diagram points can be sized using the x scale (miRNA axis) and y scale
(gene axis) values.
- 15 -
miR-AT! User’s Manual
v1.6
To save Java TreeView clustering results to a text data file click on Export | Save Data
The Gene Text Export dialog (Figure 18) will open (if it does not then see Appendix A). By default the applet
points to the miR-AT! server. Files cannot be saved to the server. Instead, enter a valid path to your local disk drive
(e.g., C:\data\results.txt) in the Export To: text box. Choose the fields to save by Ctrl-clicking on the field names
(e.g., GID, TRANSCRIPT, NAME, GWEIGHT). Choose to include expression data and/or header lines by
checking/unchecking the boxes. Click on the Save button. Data is saved in a tab delimited format which can be
easily imported into any spreadsheet programs (e.g., Microsoft Excel).
Figure 18. Gene Text Export dialog in Java TreeView.
For additional information about using Java TreeView consult the complete documentation at:
http://jtreeview.sourceforge.net/
- 16 -
miR-AT! User’s Manual
v1.6
5 Troubleshooting
HTTP Status 500 If your session has timed out you may see an “HTTP Status 500 - type Exception report…” error page.
Simply go to the miR-AT! home page ( http://mir-at.org ).
Clustering Errors
Clustering will give an popup error if clustering is run with only one miRNA. Clustering only makes sense if
there is more than one thing to cluster.
Clustering takes too long
Occasionally the applet will “hang”. This happens most often the first time clustering is used in a session. In
most cases clicking the Run CLUSTERING button again will correct the problem. If the problem persists try
restarting your browser or possibly trying a different browser.
View RESULTS button does not appear
Occasionally the applet will appear to complete clustering and then not display the View RESULTS button.
This problem is similar to the one above. In most cases clicking the Run CLUSTERING button again will
correct the problem. If the problem persists try restarting your browser or possibly trying a different browser.
Distribution does not appear
Clicking the DISTRIBUTION button doesn’t appear to do anything. Especially the first time, it may take a
minute or more to load the Java applet. Be patient. If the distribution histograms do not appear at the bottom of
the page try clicking DISTRIBUTION again. If the problem persists try restarting your browser or possibly
trying a different browser.
Unable to export/save clustering images or results
Clicking on Export or Save from Java Treeview does nothing. See Appendix A.
- 17 -
miR-AT! User’s Manual
v1.6
6 Version History
Version 1.6.0
04 Aug 2011
• removed requirement for login
Version 1.5.3
19 Jul 2010
• added message to results for missing microRNAs
Version 1.5.2
11 Apr 2010
• fixed page timeout recovery
Version 1.5.1
17 Feb 2010
• added miR-AT! publication and citation info
Version 1.5.0
18 Nov 2010
• new gene expression upload option
• updated documentation
Version 1.4.0
10 Nov 2010
• moved application to new server
• updated documentation
Version 1.3.0
20 Jan 2010
• fixed download of results in .TXT format
• restored sortable columns to output page
• added busy icon while waiting for clustering
• changed default Minimum number of miRNA sites per transcript to 2
• changed default Minimum individual site score to 15.0
• updated documentation
Version 1.2.0
21 Sep 2009
• integration of clustering library and heat map display applet
• new export of results in CSV format
• error checking for empty results list
• fixed unique output file naming per user
• support for all major browsers (Firefox, IE, Chrome, Safari)
• various interface and navigation improvements
• separate links and credits page
• separate history page
Version 1.1.0
25 Jun 2008
• initial web release
- 18 -
miR-AT! User’s Manual
v1.6
7 References
1.
Jackson, R.J. and Standart, N. (2007) How Do MicroRNAs Regulate Gene Expression? Sci. STKE, 2007,
re1.
2.
Wu, L. and Belasco, J.G. (2008) Let Me Count the Ways: Mechanisms of Gene Regulation by miRNAs
and siRNAs. Molecular Cell, 29, 1-7.
3.
Bartel, D.P. (2004) MicroRNAs: Genomics, Biogenesis, Mechanism, and Function. Cell, 116, 281-297.
4.
Wu, L., Fan, J. and Belasco, J.G. (2006) MicroRNAs direct rapid deadenylation of mRNA. Proceedings of
the National Academy of Sciences of the United States of America, 103, 4034-4039.
5.
Giraldez, A.J., Mishima, Y., Rihel, J., Grocock, R.J., Van Dongen, S., Inoue, K., Enright, A.J. and Schier,
A.F. (2006) Zebrafish MiR-430 Promotes Deadenylation and Clearance of Maternal mRNAs. Science, 312,
75-79.
6.
Doench, J.G. and Sharp, P.A. (2004) Specificity of microRNA target selection in translational repression.
Genes & Development, 18, 504-511.
7.
Krek, A., Grun, D., Poy, M.N., Wolf, R., Rosenberg, L., Epstein, E.J., MacMenamin, P., da Piedade, I.,
Gunsalus, K.C., Stoffel, M. et al. (2005) Combinatorial microRNA target predictions. 37, 495-500.
8.
Enright, A., John, B., Gaul, U., Tuschl, T., Sander, C. and Marks, D. (2003) MicroRNA targets in
Drosophila. Genome Biology, 5, R1.
9. De Hoon, M. J. L., Imoto, S., and Miyano, S. The C Clustering Library, The University of Tokyo, Institute
of Medical Science, Human Genome Center, 30 May 2009.
10. Snedecor, G. W. and Cochran, W. G. Statistical methods. Ames, Iowa: Iowa State University Press (1989).
11. De Hoon, M. J. L., Imoto, S., and Miyano, S. Statistical analysis of a small set of time-ordered gene
expression data using linear splines. Bioinformatics 18 (11), 1477-1485 (2000).
- 19 -
miR-AT! User’s Manual
v1.6
8 Acknowlegements & Permissions
Special thanks to Hasan Jamil of the Integration Informatics Laboratory in the Department of Computer Science,
Wayne State University and Anupam Bhattacharjee for technical support in web hosting. Thanks to Brad Sherman
for assistance with DAVID integration. Thanks to Drs. Anton Enright and Stijn van Dongen for help regarding the
use of the MicroCosm Targets database.
miR-AT! uses a variety of databases, software tools and libraries. Our thanks to their maintainers and developers.
MicroCosm Targets
A web resource developed by the Enright Lab at the EMBL-EBI (European Molecular Biology Laboratory European Bioinformatics Institute) containing computationally predicted targets for microRNAs across many
species. Our main microRNA database source.
www.ebi.ac.uk/enright-srv/microcosm/htdocs/targets/v5
National Center for Biotechnology Information
The national resource for molecular biology information. We use Entrez Gene for detailed information about
individual genes.
ncbi.nlm.nih.gov
Ensembl
The Ensembl project produces genome databases for vertebrates and other eukaryotic species and makes this
information freely available online. We use Ensembl for detailed information about individual genes and their
transcripts.
www.ensembl.org
DAVID Bioinformatics Resources
A comprehensive set of functional annotation tools for investigators to understand biological meaning behind
large lists of genes.
For analyzing gene list results from miR-AT!
david.abcc.ncifcrf.gov
Integration Informatics Laboratory
Our hosting service. The Integration Informatics Laboratory research project laboratory at Wayne State
University's Computer Science Department.
integra.cs.wayne.edu
Java / Java Servlets / JavaServer Pages
The principle programming platform of miR-AT!
java.sun.com
Apache Tomcat
Our Java server environment.
tomcat.apache.org
- 20 -
miR-AT! User’s Manual
v1.6
Java TreeView
An open source, extensible viewer for microarray data in the PCL or CDT format.
jtreeview.sourceforge.net
Cluster 3.0
The open source clustering software library we use with Java TreeView.
bonsai.ims.u-tokyo.ac.jp/~mdehoon/software/cluster/
30 May 2009
The C Clustering Library for cDNA microarray data.
Copyright © 2002-2005 Michiel Jan Laurens de Hoon
This library was written at the Laboratory of DNA Information Analysis, Human
Genome
Center, Institute of Medical Science, University of Tokyo, 4-6-1 Shirokanedai, Minatoku,
Tokyo 108-8639, Japan.
Contact: mdehoon "AT" gsc.riken.jp
Permission to use, copy, modify, and distribute this software and its documentation
with or without modifications and for any purpose and without fee is hereby granted,
provided that any copyright notices appear in all copies and that both those
copyright notices and this permission notice appear in supporting documentation,
and that the names of the contributors or copyright holders not be used in
advertising or publicity pertaining to distribution of the software without specific prior
permission.
THE CONTRIBUTORS AND COPYRIGHT HOLDERS OF THIS SOFTWARE DISCLAIM ALLWARRANTIES WITH REGARD TO THIS SOFTWARE, INCLUDING ALL
IMPLIED WARRANTIES OF MERCHANTABILITY AND FITNESS, IN NO EVENT
SHALL THE CONTRIBUTORS OR COPYRIGHT HOLDERS BE LIABLE FOR ANY
SPECIAL, INDIRECT OR CONSEQUENTIAL DAMAGES OR ANY DAMAGES WHATSOEVER RESULTING FROM LOSS OF USE, DATA OR PROFITS, WHETHER IN AN
ACTION OF CONTRACT, NEGLIGENCE OR OTHER TORTIOUS ACTION, ARISING OUT OF OR IN CONNECTION WITH THE USE OR PERFORMANCE OF THIS
SOFTWARE.
Python
The programming language. Used as the CGI interface to the Cluster 3.0 library.
www.python.org
sorttable
DHTML (Javascript and DOM) to make a <TABLE> sortable.
www.kryogenix.org/code/browser/sorttable/
Free CSS Templates
A free website template source on which many of our CSS templates have been based.
www.FreeCSSTemplates.org
- 21 -
miR-AT! User’s Manual
v1.6
9 Appendix A
Configuring Java to Allow Java Treeview Export & Save
For security reasons, by default, Java prevents applets from reading or writing to the local hard drive. Java can be
configured to grant access to specific “trusted” applications. The following procedure must be done by a user with
Administrator privileges on the target computer.
1. Download and install the Java JDK
The latest release of the Java Platform, Standard Edition (SE), Java Development Kit (JDK) can be found
at:
http://java.sun.com/javase/downloads/index.jsp
Click on “Download JDK” and follow the installation instructions (you must choose the download
appropriate for your platform/computer).
2.
Start Java policytool
Navigate to the JDK installation folder. Common locations are:
Windows:
Linux:
C:\Program Files\Java\jdk1.6.0_20
/usr/java/jdk1.6.0_20
The exact version number of the JDK may vary. Navigate to the bin folder.
From this folder run
policytool
(e.g., by double-clicking on policytool.exe in Windows).
3. Open the user-specific policy file or Create a new policy file
Open your user-specific policy file, .java.policy , using File | Open from the policytool toolbar menu
(see Figure 19). This file should be located as follows:
Vista:
Windows:
Linux:
C:\Users\{username}\.java.policy
C:\Documents and Settings\{user-name}\.java.policy
{user-home}/.java.policy
If you do not find any user-specific policy file, then create a new one using File | New from the
policytool toolbar menu.
Click on the Add Policy Entry button to create a new policy entry for miR-AT!.
- 22 -
miR-AT! User’s Manual
v1.6
Figure 19. Java JDK Policy Tool application.
4.
Add permissions to the policy entry for miR-AT!
Enter the CodeBase (i.e., website) of miR-AT! by typing the following exactly (including final hyphen):
http://cptweb.cpt.wayne.edu/miR-AT/-
Java TreeView Applet permission to Read Files
Click on the Add Permission button (see Figure 20) to open the Permissions dialog (see Figure 21).
From the Permission: drop-down select:
FilePermission
From the Target Name: drop-down select:
<<ALL FILES>>
From the Actions: drop-down select:
read
Click on the OK button to save the permission.
Java TreeView Applet permission to Write Files
Click on the Add Permission button to open the Permissions dialog.
From the Permission: drop-down select:
FilePermission
From the Target Name: drop-down select:
<<ALL FILES>>
From the Actions: drop-down select:
write
Click on the OK button to save the permission.
Java TreeView Applet permission to Delete Files
Click on the Add Permission button to open the Permissions dialog.
From the Permission: drop-down select:
FilePermission
From the Target Name: drop-down select:
<<ALL FILES>>
From the Actions: drop-down select:
delete
Click on the OK button to save the permission.
- 23 -
miR-AT! User’s Manual
v1.6
Java TreeView Applet permission to Read Property Values
Click on the Add Permission button to open the Permissions dialog.
From the Permission: drop-down select:
PropertyPermission
Next to Target Name: drop-down type:
user.home
From the Actions: drop-down select:
read
Click on the OK button to save the permission.
Click the Done button to complete the Policy Entry.
Figure 20. Policy Entry for miR-AT!
Figure 21. Add Permissions dialog.
- 24 -
miR-AT! User’s Manual
v1.6
5.
Save the policy file
Save the policy file using File | Save from the policytool toolbar menu (see Figure 19).
If this is a new policy file then save the file as follows:
Vista:
Windows:
Linux:
C:\Users\{username}\.java.policy
C:\Documents and Settings\{user-name}\.java.policy
{user-home}/.java.policy
If you receive an error (e.g., “Access is denied”) check the file access/security settings for any existing
.java.policy file. The user you are logged in as should have modify/write permission in order to save
changes.
** IMPORTANT **
Close and restart any open browser for the new Java security policy to take effect.
****
- 25 -