1
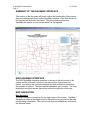
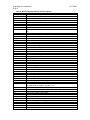
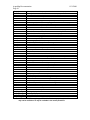
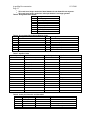
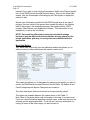
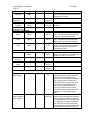
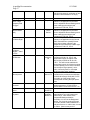
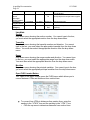
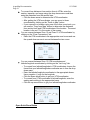
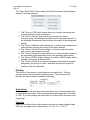
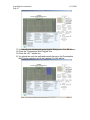
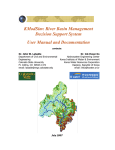
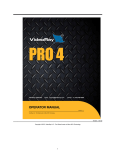
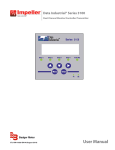
AQUAMAP
Version 3.0.1
DOCUMENTATION
AND
INSTRUCTIONS
Colorado Division of Water Resources
1313 Sherman Street
Room 818
Denver, CO 80203
Table of Contents
SUMMARY OF THE AQUAMAP INTERFACE .................................................... 1
DWR AQUAMAP INTERFACE ............................................................................ 1
MAP NAVIGATION .............................................................................................. 1
Map Navigator.................................................................................................. 1
Location Map ................................................................................................... 2
Slider Scale .................................................................................................. 2
Back Arrow Button ...................................................................................... 2
Forward Arrow Button ................................................................................. 2
Info Button ....................................................................................................... 3
Full Extent Button ........................................................................................... 3
Zoom Button .................................................................................................... 3
Pan Button ....................................................................................................... 3
Re-Center Button ............................................................................................. 3
Measure Button ............................................................................................... 4
Data Display ..................................................................................................... 4
Background Image ...................................................................................... 5
Table 1: Denver Basin Atlases ................................................................ 5
Counties ....................................................................................................... 6
Highways/Roads.............................................................................................. 7
Hydrography .................................................................................................... 7
PLSS ............................................................................................................. 7
Well Permits ..................................................................................................... 7
Table 2: Well Permit Information Field Descriptions ............................ 9
Table 4: Activity Codes .......................................................................... 11
Table 5: Designated Basin Codes ......................................................... 12
Table 6: Groundwater Management District Codes ............................ 12
Table 7: Aquifer Codes .......................................................................... 12
Table 8: Codes for Usecode1 and Usecode2 ....................................... 12
Table 9: Codes for Usecode3 ................................................................ 13
Table 10: Codes for Statcode and Trancode ....................................... 13
DWR Parcels .............................................................................................. 13
More Data Button ....................................................................................... 14
Table 11: Additional Layer Details ........................................................ 15
Location ......................................................................................................... 18
Section ........................................................................................................... 18
Township .................................................................................................... 18
Range .......................................................................................................... 18
Meridian ...................................................................................................... 18
Open PLSS Locator Button .......................................................................... 18
Open Quick Zoom Button ............................................................................. 19
Printing .............................................................................................................. 20
Output Scale .................................................................................................. 20
Page Size ....................................................................................................... 20
Create PDF Button ........................................................................................ 21
User ................................................................................................................ 21
Details ............................................................................................................ 21
Example of how to View a Denver Basin Well Permit or DWRParcel ........... 22
AquaMap Documentation
Page 1
8/31/2009
SUMMARY OF THE AQUAMAP INTERFACE
This section of the document will briefly outline the functionality of the various
tabs and check boxes shown on the AquaMap interface. Each item shown on
the interface will be briefly discussed. The picture below shows how
AquaMap will appear on your screen when it is first opened.
DWR AQUAMAP INTERFACE
The DWR AquaMap Interface comprises of a map on the left portion of the
screen and the tools and controls on the right portion of the screen. By
default, you will see the county boundaries and well notification areas when
the program is opened. The red crosshair represents your location. The map
dimensions are given across the bottom and up the right side of the map.
MAP NAVIGATION
Map Navigator
The Map Navigator is located in the top right corner of the screen. The Map
Navigator provides a few simple tools to help with moving around on the map
and providing information. The various tools that are available are outlined in
the sections below.
AquaMap Documentation
Page 2
8/31/2009
Location Map
The Location Map is located near the top center of the screen. The location
map is shaded in blue to show the area of the State that is displayed on the
map.
Vertical Slider Scale
Next to the Location Map is a slider scale that allows you to zoom to different
scales. To zoom in on a location, move the slider bar up. To zoom out from
a location, move the slider bar down. Alternatively, you can click on the
„zoom in‟ button at the top of the slider or the „zoom out‟ button at the bottom
of the slider.
The “Output Scale” box in the middle of the screen will display the scale at
which you are zoomed to. Click on the upside down triangle and it will display
a variety of scales. The scale represents 1 unit = xxxx units. For instance,
1:24,000 means 1 inch equals 24,000 inches or 1 mile equals 24,000 miles.
Any unit can be substituted because the scale represents a proportional
fraction.
Back Arrow Button
The back arrow works just like the back arrow of a browser. It
takes you back to the previous view or scale.
Forward Arrow Button
AquaMap Documentation
Page 3
8/31/2009
The forward arrow works just like the forward arrow in a
browser. It takes you forward to the view or scale you just left
using the back arrow.
Info Button
The info button provides information regarding the different
layers in AquaMap. It must be selected (clicked) when using
the mouse-over feature to obtain data regarding a specific
layer. The information obtained from using the info button will
be discussed in a later section.
Full Extent Button
The full extent button takes you back to the full extent of the
map which is the Colorado state boundary.
Zoom Button
The zoom button allows you to zoom in on a location by
dragging a rectangle around the area you want to zoom into.
The red cross hair will be in the center of the area you zoom
into. Click and hold your mouse button down as you slide
your mouse over the map. A red rubber-banding box will
appear to show the area
You must wait for the map to redraw before executing another command.
Pan Button
The pan button allows you to hold down the left mouse
button and drag the map to a new location by slicing your
mouse.
Re-Center Button
The re-center button allows you to define a new center of the
map. If you click somewhere on the map, the map will
recenter around that point.
AquaMap Documentation
Page 4
8/31/2009
Measure Button
The measure button allows you to measure distances in feet
between two or more points. The measurement appears in
the „Details‟ section on the bottom right of the screen. To end
the measure tool, double-click the last point. To erase the line
generated by the measure tool, click the „Info‟ button (the „I‟
button).
Beneath the Map Navigation buttons is a line which provides information on
what each button does and what mode you are currently in. You will also see
the UTM coordinates and latitude/longitude coordinates for the point where
your mouse cursor is at. The UTM X is the easting. The UTM Y is the
northing. All UTM coordinates are based on NAD83, Zone 13.
Data Display
The Data Display portion of the screen is directly below the Map Navigation
Box. This box is where you can turn on/off the most commonly used data by
checking and unchecking the box next to the data layer name. There are
eight base layers that you can turn on/off. Additional data can be found by
clicking on the „More Data‟ button.
AquaMap Documentation
Page 5
8/31/2009
NOTE: It is critical that you wait until one layer has been completely
drawn before clicking on another layer or any other buttons.
Background Image
The background image consists of all the raster background images. Using
the drop down menu, you can choose from aerial photographs, quad maps,
designated basins maps, and the Denver Basin Atlases.
2005 Aerials - Color aerial photography for the entire State. It appears
between scales of 1:3.5 Million and 1:1200.
Quad Maps - USGS 7.5‟ topographic maps. These maps do not contain any
drawings. It appears between scales of 1:150000 and 1:1200.
MapCab(Main) - Scanned topographic work maps. If multiple copies of a
map exist, they were scanned into MapCab (#2) and MapCab(#3). Multiple
copies contain different information. The scanned quad maps will appear
between scales of 1:25000 and 1:1200.
88-01 Aerials - Black and white aerial photography of the State between the
years 1988-2001. To view the year of the photo, turn on the „Quad Index‟
layer list under the „More Data‟ button, click on the „Information‟ tool and move
your cursor over the map. The year will appear under the „Details‟ section.
The aerials appear between scales of 1:3.5 Million and 1:1200.
SHP/UBS/UBS - Black and white aerial photography for the Southern High
Plains, Upper Big Sandy, and Upper Black Squirrel areas of the Designated
Basins. It appears between scales of 1:3,000,000 and 1:1200.
Subdivision - Plat maps of select subdivisions.
Mylar (Aquifer) – Scanned mylar work maps of the Denver Basin by aquifer.
The scanned mylars will appear between scales 1:250,000 and 1:1200.
Denver Atlas Maps – Scans of each individual map. Each map appears
between scales of 1:300000 and 1:1200. Table 1 shows how the background
maps in AquaMap correlate to the paper Denver Basin Atlases.
Table 1: Denver Basin Atlases
Background Layer Name
Dawson Base
Denver Atlas
Denver Sands
Map Name
Structural Contour Map of the
Base of the Dawson Aquifer
Location of Not Nontributary
Groundwater in the Denver
Aquifer
Sandstone/Siltstone Isolith Map
of the Denver Aquifer
Figure
Number
Figure 1A
Figure 2D
Figure 2C
AquaMap Documentation
Page 6
Dawson Atlas
Dawson Sands
L Dawson Atlas
L Dawson Sands
N Arapahoe Atlas
S Arapahoe Atlas
Arapahoe Sands
L Arapahoe Atlas
L Arapahoe Sands
N LarFox Atlas
S LarFox Atlas
LarFox Sands
8/31/2009
Location of Not Nontributary
Groundwater in the Dawson
Aquifer
Sandstone Isolith Map for the
Dawson Aquifer
Location of Not Nontributary
Groundwater in the Lower
Dawson Aquifer
Sandstone Isolith Map for the
Lower Dawson Aquifer
Location of Not Nontributary
Groundwater in the Arapahoe
Aquifer
Location of Not Nontributary
Groundwater in the Arapahoe
Aquifer
Sandstone/Siltstone Isolith Map
for the Arapahoe Aquifer
Location of Not Nontributary
Groundwater in the Lower
Arapahoe Aquifer
Sandstone/Siltstone Isolith Map
for the Lower Arapahoe Aquifer
Location of Not Nontributary
Groundwater in the Laramie-Fox
Hills Aquifer
Location of Not Nontributary
Groundwater in the Laramie-Fox
Hills Aquifer
Sandstone/Siltstone Isolith Map
for the Arapahoe Aquifer
Figure 1G
Figure 1E
Figure 1F
Figure 1C
Figure 3H
Figure 3H
Figure 3E
Figure 3G
Figure 3F
Figure 4E
Figure 4C
Figure 4C
To turn on the images, you must click in the box next to “Background Image”.
The raster images may take some time to load so you must be patient. If you
do not see the background image, you may be zoomed out too far. If you do
not see the background image after waiting for a minute or so, try zooming in
to a smaller scale.
The transparency slider bar allows you to set the transparency (opaqueness)
of the background image.
The high-low option sets the resolution of the image when it is sent for
printing. When printing, it is wise to set the resolution to low unless the map is
too grainy to read. The map generation and printing will take much, much
longer when the resolution is set to high.
No mouse-over information is available for the background images.
Counties
AquaMap Documentation
Page 7
8/31/2009
The Counties layer shows the county boundaries. The boundaries are
displayed as a brown line. The county outlines will appear down to a scale of
1:1200.
No mouse-over information is available for the Counties Layer.
Highways/Roads
The Highways/Roads layer shows highways and roads. The highways and
roads are displayed as a red line. The shapefile will appear on all maps
unless turned off from the full scale down to a scale of 1:1200.
Mouse-over information provided for the Highways/Roads layer is the name
of the feature. This information is only available if you are in the Info Mode.
Hydrography
The Hydrography layer shows 1:24,000 hydrography for rivers, streams,
lakes, reservoirs, etc. The rivers and streams are displayed as a blue line.
The lakes and reservoirs will appear as a blue polygon. The data is viewable
from scales between 1:3,000,000 and 1:6000.
Mouse-over information provided for the Hydrography layer is the name of the
feature. This information is available only if you are in the Info Mode.
PLSS
The PLSS layer shows the township, section, and quarter-quarters
information. The sections are displayed as a green line. The quarterquarters are displayed as pink lines. The section lines appear between
scales of 1:25000 and 1:1200. The quarter-quarters appear at scales of
between 1:24000 and 1:1200.
No mouse-over information is available for the PLSS Layer. The current
section is located directly below the data layers. The section displayed is the
location of the red „X‟ in the center of the map.
Water Well Application
The Water Well Application layer displays well permit application locations.
The data is updated nightly. Constructed wells are shown as a green dots.
Wells without construction information on file are shown as red dots. If there
are multiple wells for a single location, small squares will spiral around the dot
representing the additional wells. The wells are displayed from scales
between 1:250000 and 1:6000.
AquaMap Documentation
Page 8
8/31/2009
Mouse-over information provided for the Well Permit layer is the owner name
on file, receipt number, permit number, permit suffix, permit replacement,
aquifer, activity code, yield, and depth. The aquifer and activity code
information is given as abbreviations (See Tables 4 and 7). Blank fields
represent no information and may have to be manually looked up in our
records. This information is only available if you are in the Info Mode.
The full information on the well is available by double clicking on the well
permit of interest. The table will contain all of the information available in
Hydrobase. A description for each field along with any associated codes is
listed in tables 2 through 10. This information is only available if you are in
the Info Mode.
AquaMap Documentation
Page 9
8/31/2009
Table 2: Well Permit Information Field Descriptions
Field Name
Description
Receipt
Receipt number assigned by the Division of Water Resources
Div
Division number
Cty
County number (See Table 3)
Permitno
Permit number assigned by the Division of Water Resources
Permitsuf
Permit suffix – Used with non-exempt well permit numbers
Permitrpl
Permit replacement – Used for wells that have been replaced
Parcel_no
County parcel number
Actdate
Date the application was received by DWR
Actcode
Activity Code – Relates to the major actions taken on a permit. (See Table
4)
WD
Water District in which the well is located
Basin
Designated Basin (See Table 5)
MD
Groundwater Management District (See Table 6)
Full_name
Name of well owner on file with DWR
Address1
Mailing address of well owner on file with DWR
Address2
Mailing address of well owner on file with DWR
City
City for the mailing address
St
State for the mailing address
Zip
Zip code for the mailing address
Phone_number
Well owner‟s phone number
Pm
Principal Meridian in which the well is located
Rng
Range number
Rnga
Identifies the half range
Rdir
Range direction
Ts
Township number
Tsa
Identifies the half township
Tdir
Township direction
Sec
Section
Seca
Section designation for Ute correction sections
Q160
Quarter = 160 acres
Q40
Quarter-quarter = 40 acres
Q10
Quarter-quarter-quarter = 10 acres
Coordsns
Distances (in feet) from north or south section line
Coordsns_dir
Direction from the north or south section line
Coordsew
Distances (in feet) from the east or west section line
Coordsew_dir
Direction from east or west section line
Utm_x
UTM coordinate for the Easting
Utm_y
UTM coordinate for the Northing
Loc_source
Source of data for location information – Spotted from section lines, user
supplied UTM coordinates, quartered, etc.
Aquifer1
Aquifer in which the well is completed (See Table 7)
Aquifer2
Aquifer in which the well is completed (See Table 7)
Subdiv_name
Subdivision name shown on the permit
Lot
Lot number shown on the permit
Block
Block number shown on the permit
Filing
Filing number shown on the permit
Engineer
Staff member initials who approved the well permit
Well_name
Name of well given on the application by the applicant
Use1
Permitted use of the well (See Table 8)
Use2
Permitted use of the well (See Table 8)
Use3
Use of the Well (See Table 9)
Driller_lic
License number of the driller who constructed the well
AquaMap Documentation
Page 10
8/31/2009
Pump_lic
License number of the pump installer who installed the pump
Field Name
Description
Pidate
Date pump installation report was received by DWR
Statute
Statute under which the permit was issued
Statdate
Date of the status code action
Statecode
Interim status of the application or permit (See Table 10)
Npdate
Date the permit, denial, or monitoring hole was issued
Wadate
Date the Well Construction and Test Report was received by DWR
Trancode
Last action that was updated (See Table 10)
Trandate
Date the last action was taken
Sadate
Date of first beneficial use
Sbudate
Date the Statement of Beneficial Use was received by DWR
Exdate
Expiration date of the well permit
Abrdate
Date the Abandonment Report was received by DWR
Abcodate
Date the well was plugged and abandoned
Abreq
Used internally to show if abandonment is required for a well
Acreft
Annual appropriation for the well (shown in acre-feet)
Tperf
Depth to top of the first perforated casing
Bperf
Depth to the base of the last perforated casing
Case_no
Water court case number
Yield
Yield of well (Shown in gallons per minute)
Depth
Total depth of the well
Level
Depth to the static water level
Elev
Ground surface elevation of the well
Area_irr
Amount of land irrigated
Irr-Meas
Units for the amount of land irrigated (square feet or acres)
Comment
Comments
Meter
Totalizing flow meter required and/or installed
Wellxno
Cross reference to another well permit number
Wellxsuf
Cross reference to another well permit suffix
Wellxrpl
Cross reference to another well permit replacement
Nwcdate
Notice of Well Construction Report received
Nbudate
Notice of Commencement of Beneficial Use received
Wcdate
Date well was completed
Pcdate
Date pump installation was completed
Log
Flag to indicated if a geophysical log is required and received
Qual
Water quality information available (yes or no)
User1
Initials of the last staff member to update the file
Pyield
Proposed yield of the well shown on the application
Pdepth
Proposed depth of the well shown on the application
Pacreft
Proposed amount of water to be withdrawn from the well
Parcelsize
Number of acres in the parcel
Noticedate
Date that the Notice of Expiration was sent out
Completed_well
Date the well was completed
Display_utm_x
Easting displayed
Display_utm_y
Northing displayed
Latdecdeg
Latitude in decimal degrees
Longdecdeg
Longitude in decimal degrees
NOTE: Not all fields may be populated. If a field is not populated, the information
may not be available or it may be available in the actual permit file.
AquaMap Documentation
Page 11
Table 3: County Codes
County Code
County Name
1
Adams
2
Alamosa
3
Arapahoe
4
Archuleta
5
Baca
6
Bent
7
Boulder
8
Chaffee
9
Cheyenne
10
Clear Creek
11
Conejos
12
Costilla
13
Crowley
14
Custer
15
Delta
16
Denver
17
Dolores
18
Douglas
19
Eagle
20
Elbert
21
El Paso
22
Fremont
23
Garfield
24
Gilpin
25
Grand
26
Gunnison
27
Hinsdale
28
Huerfano
29
Jackson
30
Jefferson
31
Kiowa
32
Kit Carson
8/31/2009
County Code
33
34
35
36
37
38
39
40
41
42
43
44
45
46
47
48
49
50
51
52
53
54
55
56
57
58
59
60
61
62
63
64
Table 4: Activity Codes
Code
Explanation
AP
New application received
Code
CP
AD
AW
EX
MH
AV
BD
CA
CD
CO
Application denied
Application for a well permit is
withdrawn
Verbal approval granted to well
contractor to construct a well w/o a
2
permit in place.
Determination of available water in the
Denver Basin Aquifers inside the
Designated Basins
Cancelled well permit
Change description of acres irrigated
(Designated Basins)
Application to commingle wells
(Designated Basins)
NP
County Name
Lake
La Plata
Larimer
Las Animas
Lincoln
Logan
Mesa
Mineral
Moffat
Montezuma
Montrose
Morgan
Otero
Ouray
Park
Phillips
Pitkin
Prowers
Pueblo
Rio Blanco
Rio Grande
Routt
Saguache
San Juan
San Miguel
Sedgwick
Summit
Teller
Washington
Weld
Yuma
Broomfield
Explanation
Amended household use permit to allow
watering of user‟s noncommercial domestic
1
animals.
Well permit expiration date extended
Monitoring hole notice of construction
received
Well permit issued
RI
Well permit reinstated pursuant to Policy
2001-04
TH
TW
Test hole notice received
Test well notice received
AquaMap Documentation
Page 12
8/31/2009
1
This code is no longer used since State Statutes do not allow this use anymore.
This code is no longer used since verbal permission is no longer granted.
Table 5: Designated Basin Codes
Code
Designated Basin Name
1
Northern High Plains
2
Kiowa-Bijou
3
Southern High Plains
4
Upper Black Squirrel Creek
5
Lost Camp
6
Camp Creek
7
Upper Big Sandy
8
Upper Crow Creek
2
Table 6: Groundwater Management District Codes
Code Management District Name
Code
1
Plains
8
2
Sand Hills
9
3
Arikaree
10
4
Frenchman
11
5
Central Yuma
12
6
W-Y
13
7
North Kiowa-Bijou
Table 7: Aquifer Codes
Aquifer Symbol
Aquifer Name
GW
KA
UKA
LKA
JMB
KDB
KCH
CON
KD
TDW
UTDW
LTDW
TKD
JE
TG
PH
All Un-named Aquifers
Arapahoe
Upper Arapahoe
Lower Arapahoe
Brushy Basin
Burro Canyon
Cheyenne
Confined San Luis Valley
Dakota
Dawson
Upper Dawson
Lower Dawson
Denver
Entrada
Green River
Hermosa
Table 8: Codes for Usecode1 and Usecode2
Usecode
Explanation
Usecode
1
Crop Irrigation
9
2
Municipal
G
3
Commercial
H
4
Industrial
K
5
Recreation
O
6
Fishery
Q
Management District Name
Eastern Cheyenne
Lost Creek
Southern High Plains
Marks Butte
Upper Black Squirrel
Upper Big Sandy
Aquifer Symbol
Aquifer Name
KI
KL
KLF
ML
KM
KMV
JM
TO
KP
KPU
JMS
UNC
TW
TW
KW
Iles
Laramie
Laramie-Fox Hills
Leadville Limestone
Mancos
Mesa Verde Group
Morrison
Ogallala
Pierre Shale
Purgatorie
Salt Wash
Unconfined San Luis Valley
Wasatch
White River
Williams Fork
Explanation
Livestock
Geothermal
Household use only
Snowmaking
Other or Monitoring Hole/Well
Special uses for Monitoring Holes
AquaMap Documentation
Page 13
8/31/2009
7
Fire
R
Recharge
8
Domestic
E
Exchange and Augmentation
Table 9: Codes for Usecode3
Usecode Explanation
A
Augmentation – The well is covered under a water court approved augmentation plan.
M
Permitted monitoring well
Z
Household Use Wells Issued Prior to HB1111 that have been amended prior to 3(b)(II)(b) by
$25 application – No longer available
L
Permit issued under presumption 3(b)(II)(A) for domestic/livestock uses as the only well on
35 acres
G
Gravel pit well permit
C
Closed loop geothermal well
P
Geothermal production well
S
Other types of holes constructed especially for cathodic protection
5
Identifies that the permit was issued pursuant to Senate Bill 5 – 137(4)
Table 10: Codes for Statcode and Trancode
Code
Explanation
AB
Well plugged and sealed
AR
Application for well permit was resubmitted to DWR
AU
Application returned to applicant for correction or additional information
AH
Application on hold for more information
EP
Expired well permit
LC
Location of the well has been corrected
NC
Notice of well construction received for a permitted well
NS
Exempt wells where no state of use is required (No longer used)
OC
Change in ownership accepted and updated
PI
Pump installation report received
PU
Pump installation report returned to responsible party for correction
RC
A portion of the record was changed
S5
Notice of Well Construction received for a non-tributary well under 137(4)
SA
Statement of Beneficial Use accepted
SP
Statement of Beneficial Use received but not accepted
ST
Supplemental test well
SR
Statement of Beneficial Use resubmitted to DWR
SU
Statement of Beneficial Use returned to owner for correction
WA
Well construction report received
WU
Well construction report returned to responsible party for correction
YY
General update by permitting and records staff
ZZ
General update by records staff adding existing data to the system
DWR Parcels
The DWR Parcels displays parcels (polygons) created by DWR personnel in
AquaMap instead of on the paper maps. Polygons will appear with specific
colors for the different categories of polygons. Table 11 provides the
symbology for DWR Parcels. The data is viewable from scales between
1:250000 and 1:6000.
The default is to display all parcel types. To view only certain parcel types,
click the „More Data‟ button. The „Parcel‟ refers to all data categories
statewide. The „Aquifer‟ refers only to Denver Basin. These categories allow
you to choose which aquifer and which parcel type you wish to view. For
AquaMap Documentation
Page 14
8/31/2009
example if you wish to view only the Presumption Wells in the Denver Aquifer,
turn on the DWR Parcels and Well Permits layers. Then on the „More Data‟
screen, click the Presumption Well category and Tkd Aquifer to display the
subset of data.
Mouse-over information provided for the DWR Parcels layer is the type of
polygon, the user initials of the person who created the parcel, the creation
date of the polygon, the calculated acreage, the receipt number, WDID
number, Case number, and Subdivision number. This information is only
available if you are in the Info Mode.
NOTE: Care must be utilized when using the calculated acreage
because it may be different than the permitted acreage shown on the
permit application, plat map, or survey that was submitted with the
application.
More Data Button
The “More Data” button will open an additional window that allows you to
select a variety of other data layers that can be turned on/off.
This menu also allows you to designate the category and aquifer you wish to
see for the DWRParcels located within the Denver Basin. By default all the
Parcel Categories and Aquifer Categories are turned on.
The other data layers that can be turned on are grouped by subject.
The layers are viewable between the scales shown in the Table 11.
Note: Most of the layers will provide information in the way of a mouse-over.
If you don‟t see information regarding a specific layer, make sure that you are
zoomed into the appropriate scale. If you still don‟t see any information, try
turning off some of the other layers you have turned on.
AquaMap Documentation
Page 15
8/31/2009
Note: You must be in “Info” mode to see the information. To get in the “Info”
mode, press the “I” button on the AquaMap interface.
Table 11: Additional Layer Details
Layer
Max Scale
Min Scale
DWR Boundary
Denver Basin
1 to 3.4
1 to 12000
Million
Color
Black Line
Gray Fill
Designated
Basin
1 to 3.4
Million
1 to 12000
Purple Line
No Fill
Management
District
1 to 3.4
Million
1 to 12000
Green Line
No Fill
DWR Water
District
1 to 3.4
Million
1 to 12000
Black Line
No Fill
DWR Division
1 to 3.4
Million
1 to 12000
Red Line
No Fill
Critical Area
1 to 2 Million
1 to 6000
Pink Line
No Fill
Other Boundary
Quad Index
1 to 1 Million
1 to 12000
Red Line
No Fill
Red Line
Geology
1 to 3.4
Million
1 to 12000
Municipal
Water District
1 to 3.4
Million
1 to 12000
Red Line
Gray Fill
Municipal
Water/Sewer
District
1 to 3.4
Million
1to 12000
Red Line
Gray Fill
Climate
Evaporation
Station
Precipitation
Station
Temperature
Station
Solar Radiation
2
(MJ/m )
1 to 3.4
Million
1 to 6000
Blue
Square
Green
Square
Pink
Square
Brown Line
Precipitation
Contours
1 to 3.4
Million
1 to 6000
Red Line
Comments
Provides the extents of the Denver
Basin. The mouse-over provides the
name of the top aquifer at that location.
Provides the boundaries of the
Designated Basins. The mouse-over
provides the Designated Basin Name
and the date of formation.
Provides the boundaries of the
Groundwater Management Districts in
the Designated Basins. The mouse-over
provides the
Provides the boundaries of the DWR
Water Districts. Mouse-over provides
the division and water district numbers.
Provides the boundaries of the DWR
Divisions. Mouse-over provides the
division number.
Boundaries of the water critical areas in
Divisions 6 and 7. The mouse-over
provides the name of the water critical
area.
Provides the Quad Map name and SEO
Map Number as a mouse-over.
Provides the surface geology for the
State. Mouse-over provides the geologic
symbol for the formation.
Provides Municipal Water District
boundaries. The data was obtained from
the DOLA shapefile. The mouse-over
provides the name of the water district.
Provides Municipal Water and Sewer
District boundaries. The data was
obtained from the DOLA shapefile. The
mouse-over provided the name of the
district.
Evaporation station
Precipitation station
Temperature station
Shows the NOAA solar radiation contour
lines. The mouse-over provides the
2
annual solar radiation in MJ/m
Shows the NOAA precipitation contour
lines. The mouse-over provides annual
precipitation amount in inches.
AquaMap Documentation
Page 16
Layer
Evaporation
Contours
8/31/2009
Max Scale
1 to 3.4
Million
Min Scale
1 to 6000
Color
Red Line
Gridded
1 to 500000
Ppct/Evap
Division 2 – Arkansas
Dakota
1 to 3.4
Program
Million
Upper
Arkansas WCD
Division 3 – Rio Grande
Div 3 Clay
1 to 3.4
Extent
Million
1 to 1200
Blue Line
No Fill
1 to 6000
Black Line
Gray Fill
Provides the extents of the Dakota
Program.
Coming Soon
1 to 6000
Black Line
No Fill
DWR Depth to
Clay
1 to 3.4
Million
1 to 6000
Black Line
No Fill
HRS Depth to
Clay
1 to 3.4
Million
1 to 6000
Orange
Line
Provides the extents of the HRS clay
map. The mouse-over indicates if the
location is within the map extents.
Provides the extents of the blue clay
layer. The mouse-over provides the
depth to the top of the blue clay layer.
Provides the contours for the HRS depth
to clay. The mouse-over provides the
depth to the top of the clay layer as
determined by HRS.
1 to 6000
Pink Line
No Fill
Division 5 – Colorado
Div 5 A-B Line
1 to 3.4
Million
Div 5 Calling
Structures
Gages
Real Time
Gage
Historical Gage
Green
Circles
Red
Circles
Comments
Shows the NOAA evaporation contour
lines. The mouse-over provides annual
evaporation in inches.
Not Available
Provides the location of the Division 5 AB line. The mouse-over indicates if the
location is in the A, B, or C area.
Coming Soon
Real time gages, active
Gages, inactive
Parcel Category
Presumption
Well Polygon
1 to 200000
1 to 2000
Light Blue
Fill
Exempt Well /
Small Capacity
Well Polygon
1 to 200000
1 to 2000
Light
Purple Fill
A tract of land of 35 acres or more that is
"encumbered" by a well permit issued
pursuant to 37-92-602(3)(b)(II)(A),
C.R.S. for full domestic use, or a parcel
that is smaller than 35 acres that is
"encumbered" by a well permit issued
pursuant to 37-92-602(3)(b)(II)(A),
C.R.S. for household use only, or a
Cluster Development parcel that is
"encumbered" by a well permit issued
pursuant to 37-92-602(3)(b)(II)(A),
C.R.S.
A tract of land that was claimed by an
exempt well permit applicant to quantify
water in the Denver Basin pursuant to
37-92-602(3)(b)(I), C.R.S. and the April
23, 1986 policy, or a tract of land that
was claimed by a small capacity well
permit applicant to quantify water in the
Denver Basin pursuant to 37-90-105
AquaMap Documentation
Page 17
8/31/2009
where, in both cases, the issuance of the
well permit includes an evaluation of land
area and a determination of no injury.
Layer
Non-Exempt
Well / Large
Capacity Well
Polygon
Max Scale
1 to 200000
Min Scale
1 to 2000
Color
Purple Fill
Decreed
Denver Basin
Adj
1 to 200000
1 to 2000
Light
Green
Outline
Determination
of Water Right
1 to 200000
1 to 2000
Green Fill
Determination
of Water
Rights – Place
of Use
Approved
Subdivision
1 to 200000
1 to 2000
Gray Fill
1 to 200000
1 to 2000
Black Line
with gray
Fill
Cluster
Development
1 to 200000
1 to 2000
Black Line
with no Fill
Deemed
Consent
1 to 200000
1 to 2000
Pink Fill
Non-Critical
Area
Pre-213
Cylinder
1 to 200000
1 to 2000
1 to 200000
1 to 2000
Light
Green Fill
Light
Reddish Brown Fill
Comments
One or more pieces of land that were
claimed in an application to the water
court to adjudicate Denver Basin ground
water underlying the subject land
pursuant to 37-92-302, C.R.S.
One or more pieces of land that were
claimed in an application to the water
court to adjudicate Denver Basin ground
water underlying the subject land
pursuant to 37-92-302, C.R.S.
One or more pieces of land that were
claimed in an application to the Ground
Water Commission to quantify Denver
Basin ground water underlying the
subject land and determine a water right
pursuant to 37-90-107, C.R.S.
Not currently used
The piece of land that was created
pursuant to 30-28-133, C.R.S. and
whose water supply is subject of the
SEO review pursuant to 30-28-136,
C.R.S. This will include subdivisions
whose water supply is individual, exempt
or small capacity, on-lot wells; individual,
non-exempt or large capacity, on-lot
wells; community wells; or municipal
/quasi-municipal water suppliers.
The piece of land that was created
pursuant to the provisions and definition
in 30-28-401 through 30-28-404, C.R.S.
It is made up of the entire Cluster
Development including the open space
area.
The land area that is claimed by a water
supplier pursuant to 37-90-137(8) or
Ground Water Commission Rule 5.3.10
Not currently used
A circle that represents an
"appropriation" by a well constructed
before July 6, 1973 outside of the
Designated Basins and before
November 19, 1973 in the Designated
Basins. This could be a stored polygon
or created, based a radius attribute of a
well permit record. In either case, it must
be visible. (Note: some pre-213
AquaMap Documentation
Page 18
Municipal /
Quasi
Municipal
Water Supplier
Permitted
Irrigated Acres
Aquifer
Category
8/31/2009
1 to 200000
1 to 2000
Light Red
Fill
cylinders will not have a well permit, just
a court decree.)
The established service boundaries of a
municipal/quasi-municipal water supplier
1 to 200000
1 to 2000
Green Fill
Not currently used
1 to 250000
1 to 6000
Green or
Red
Shows the well permits based on
aquifer(s)
Location
Section
Drop down menu showing the section number. You cannot type in the box;
you must select the appropriate section from the drop down menu.
Township
Drop down menu showing the township number and direction. You cannot
type in the box; you must select the appropriate township from the drop down
menu. You must also select the appropriate direction from the drop down
menu.
Range
Drop down menu showing the range number and direction. You cannot type
in the box; you must select the appropriate range from the drop down menu.
You must also select the appropriate direction from the drop down menu.
Meridian
Drop down menu showing the principal meridian. You cannot type in the box;
you must select the appropriate principal meridian from the drop down menu.
Open PLSS Locator Button
The “Open PLSS Menu” button opens the PLSS menu which allows you to
convert between UTMs and distances from section lines.
To convert from UTMs to distances from section lines, enter the
easting in the “UTM X” box and the northing in the “UTM Y” box.
o Click the up arrow to determine distances from section lines.
AquaMap Documentation
Page 19
8/31/2009
To convert from distances from section lines to UTMs, enter the
section, township, and range using the drop down menus and then
enter the distances from the section lines.
o Click the down arrow to determine the UTM coordinates.
o After getting the UTM coordinates, you can zoom to those
coordinates by clicking on the “Zoom to Map” button.
o If you zoomed to a location using one of the other zoom tools, you
can use the “Copy from Map” button to determine the distances
from section lines and UTM coordinates of the location. The exact
location is the red „X‟ in the center of the screen.
You can convert between Zone 12 and Zone 13 UTM coordinates by
clicking on the “Zone Conversions” tab.
o Enter the UTM coordinates in the appropriate zone boxes and use
the up and down arrows to convert between the two zones.
You can convert between Zone 13 UTM coordinates and
latitude/longitude coordinates by clicking on the “Lat-Long” tab.
o To convert from latitude/longitude to UTM coordinates, choose the
format that your latitude/longitude coordinates are in from the drop
down menu.
o Enter the latitude/longitude coordinates in the appropriate boxes.
Use a negative (-) sign for the longitude.
o Click the down arrow button to get your UTM coordinates.
o To convert from UTM coordinates to latitude/longitude, enter the
easting and northing in the appropriate boxes.
o Click the up arrow button to get your latitude/longitude coordinates.
Open Quick Zoom Button
AquaMap Documentation
Page 20
8/31/2009
The “Open Quick Zoom” Button opens the Quick Zoom menu that provides a
variety of zooming methods.
1. The “Zoom to UTM Value” button allows you to enter the easting and
northing and then zooms to that point.
2. The “Zoom to Section” button allows you to enter the section,
township, range, and principal meridian from the drop down menus on
the AquaMap interface and then zooms to the center of the designated
section.
3. The “Zoom to Address” button allows you to enter a street address and
town and then zooms to the vicinity of the given address.
4. The “Zoom to Permit #” button allows you to enter a permit number
and a county and zooms to that well.
5. The “Zoom to Receipt #” button allows you to enter a receipt number of
an issued well permit and then zooms to the permitted well location.
6. The “Zoom to WDID” buttons allows you to enter a WDID (water district
identifier) and zooms to that structure.
7. The “Zoom to Parcel #” is a work in progress to link parcel id numbers
assigned by the county to a well. Most well records lack a parcel id
number to link the information.
Printing
This portion of the screen is located below the Location box. This box
provides menus that are related to printing maps. The sections below
describe the various options available for printing.
Output Scale
The output scale is a drop down menu that allows you to automatically zoom
to a pre-determined scale. The pre-determined scale ranges from 3.5 million
to 1200. If you are printing, the scale listed in this box will be the scale of the
output map.
Page Size
Page size is related to the output scale and is used to create printable maps.
There are two page sizes to choose from: 8.5” by 11” or 11” by 17”.
AquaMap Documentation
Page 21
8/31/2009
Create PDF Button
The “Create PDF” button creates a PDF file that can be printed out to scale.
Once you click on the “Create PDF” button, you will see a message above the
button that says the „PDF creating…‟. When the program has created the
PDF, the message changes to “Open PDF file”. Clicking on the Open PDF
message will launch Adobe Acrobat and the map that was created will open.
Note: If the map opens in the same browser window as AquaMap, you will
lose your AquaMap session when closing the window. To fix this, open
Acrobat. Go to Edit – Preferences – Internet. There is an option that says
“Display PDF in Browser”. Make sure that the box is not checked.
Note: To print a scaled PDF document, you must disable the scaling option
on the print menu in Adobe Acrobat Reader.
User
The user‟s initials are entered in this box. The initials are used to show who
created a parcel and/or map. This box must be filled in before a parcel can
be saved or a map can be printed.
Details
The details area is located directly below the Map Control Layers area. This
is where the mouse-over information will appear.
AquaMap Documentation
Page 22
8/31/2009
Example of how to View a Denver Basin Well Application or
DWR Parcel
1. Open AquaMap
2. Enter the section, township, range, and principal meridian for the parcel.
3. Click on the “Quick Zoom” button located beneath the Location portion of
the AquaMap interface.
4. Click on the “Zoom to Section” button.
5. Turn on the “Map Cab(Main)” background layer.
6. Turn on the “Water Well Application” background layer.
7. Turn on the “DWR Parcels” background layer.
8. If the output scale is not set to 18000 or 24000, choose one of those
options from the “Output Scale” dropdown menu.
9. You should see all of the parcels that have been drawn in AquaMap along
with the wells that have been historically permitted by DWR.
10. Click on the “More Data”
11. Click on the box next to “All Parcels” under the Parcel Category turning off
all parcels.
12. Click on the box next to “All Aquifers” under the Aquifer Category turning
off all aquifers.
AquaMap Documentation
Page 23
8/31/2009
13. You should note that all wells and polygons disappeared from the screen.
14. Check the “Presumption Well Polygon” box.
15. Check the “KLF” aquifer box.
16. You should see only the wells and parcels that are in the Presumption
Well Polygon category and in the Laramie-Fox Hills aquifer.