1
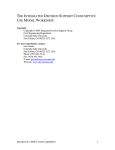
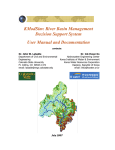
A Hand’s On Introduction to Conducting Water Rights Investigations Colorado Coalition of Land Trusts Conservation Excellence 2014 Conference March 19, 2014 Kara Sobieski, P.E. [email protected] Overview and Training Session Training Material Contents: CDSS Overview Colorado Water Rights and Administration – Review Querying, Viewing, and Extracting Data from HydroBase via CDSS website Example 1: I am interested in Ward Ditch in the Bear Creek basin. What information is available on this ditch? Example 2: What water rights are carried through the Ward Ditch and how have they changed over time? Example 3: Is there a proposed or decreed Instream Flow Reach near Ward Ditch? Example 4: Identify wells located on a property, and determine what information is available. Historical Crop Consumptive Use Analysis – Review CDSS Products Estimating Crop Consumptive Use – StateCU Example 5: Estimating crop CU for a specific ditch using the StateCU Wizard CDSS Overview What is CDSS? “Colorado’s Decision Support System (CDSS) is a water management system developed by the Colorado Water Conservation Board and the Colorado Division of Water Resources for each of Colorado’s major water basins.” When? 1992 1992 1998 2001 2009 Colorado State Legislature authorized CWCB to conduct a needs analysis and feasibility study for a Colorado River Decision Support System Colorado River DSS development (HydroBase development) Rio Grande DSS development South Platte DSS development Arkansas DSS Feasibility Study Why? To provide the capability to develop and manage credible information on which to base informed decisions concerning water resource management issues including: • Interstate Compact Issues • Resources Planning (response to population growth, drought and climate change, environmental issues, etc) • Water Rights Administration by DWR How? • Provide user-friendly access to quality controlled data (data-centered around HydroBase) and spatial information • Provide data and models to evaluate alternative water development and administration strategies • Provide a functional, integrated system that can be maintained and upgraded by the State • Have the capability to accurately represent current and potential federal and state administrative and operational policies and laws • Promote information sharing among government agencies and water users 1 Colorado Water Rights Administration - Review Prior Appropriation Doctrine: “First in time, first in right”. Water rights must be put to beneficial use – use of a reasonable amount of water to accomplish the purpose of the appropriation without waste. Absolute Water Right: a water right that has been placed to beneficial use. Conditional Water Right: a water right granted in water court that fixes the priority and provides time to complete the appropriation as long as it can be demonstrated that progress is being made toward project completion during six year “diligence” periods. Due Diligence: demonstrating progress toward perfecting a conditional water right. Historically could be as simple as performing a survey of the ditch alignment, studying available river flow, developing a ground water model, developing a preliminary well design. Appropriation Date: the date water is first put to beneficial use or steps were first taken to develop. Adjudication Date: the date water right is decreed in court. Administration Number: represents both the appropriation and adjudication date, reflecting the water right “place” in the priority system. Abandonment: relinquished water right due to intentional non-use. Water rights are subject to abandonment if not used in a consecutive 10-year period. River Call: a water right holder can “place a call” to the Division Engineer indicating they are not receiving their full decreed water right and request that the Division Engineer shut down (curtail) all upstream water rights junior to their calling right. 2 Over-Appropriated Stream: also termed critical stream or critical reach. Designation simply means there has been water rights administration due to a call at least one time. Exempt Groundwater: Wells limited to use inside a residential dwelling (no outside uses allowed) with rate < 15 gpm. Pre-1972 permitted wells may have exempt status, >15 gpm, and include some outdoor use or minimal stock watering. Tributary Groundwater: aquifer that is physically connected to a river system ground water use affects the flow in the river; river flows affect ground water levels. Non-exempt tributary wells require an augmentation plan if they tributary to a critical stream. Designated Basin Groundwater: aquifer that has been determined to be “nontributary” to a stream system; pumping will not affect the stream system within 100 years. Non-tributary ground water can be permitted by the overlying land owner to pump at an annual rate determined to deplete the aquifer at 1 percent per year, with the assumption that the aquifer has a 100-year supply. Source: Citizen’s Guide to Colorado Water Law, CFWE.org 3 Augmentation Plan: court-approved plan designed to protect existing senior water rights, while allowing junior uses to divert “out of priority”. An augmentation plan provides a replacement supply – in amount, quality, location, and timing of original water right. Non-exempt well permits tributary to an overappropriated stream will not be granted a permit without an augmentation plan. Water rights are decreed for specific use(s). This, plus the fact that water rights can be changed, requires detailed administrative accounting to be performed by water commissioners. In Colorado, water is a property that can be sold separately from the land; however, the public retains an interest in the water. This allows for change of water rights. • Change in type of use (ex: from irrigation to municipal; from direct use to storage) • Change in amount of use • Change in point of diversion • Adding points of diversion (alternate points) – can be wells or headgates Change of water rights must be approved by water court to assure no injury occurs to other water rights. Change of use and water rights transfers requires an historical consumptive use analysis (see Example 5). An historical consumptive use analysis quantifies the amount of diverted/pumped water that is available for transfer and the location and timing of lagged return flows that must be maintained after the transfer. Junior water rights are entitled to same conditions on the river. Interstate Compacts and Agreements: The ability to develop water in Colorado requires is also dependent on meeting obligations with downstream states. • 9 Compacts; 2 U.S Supreme Court cases; 2 Agreements, 1 Treaty with Mexico • Agreements vary - Set Delivery Obligations, Delivery Obligations based on Streamflow, Depletion and Storage Restrictions Divisions and Water Districts: River basin and tributary designations to facilitate water rights administration. 4 5 WDID: Each water right location (decreed or conditional) has been assigned a 3 or 4 digit integer identifier which, when combined with the Water District, is unique and can be used to query information in HydroBase (termed WDID). In general: • River Diversion IDs are between 100 and 1999 • Instream flow IDs are between 2000 and 2999 • Reservoir IDs are between 3000 and 3999 • Transbasin IDS are between 4000 and 4999 • Well IDs are greater than 5000 This rule of thumb still applies to 99 percent of water rights, but is no longer expected to be adhered to in the future. For example, the WDID for Larimer County Canal is 0300911 where 03 indicates the structure is in Water District 3, and 911 is the unique identifier for the ditch headgate location. All of Larimer County Canal’s over 50 water rights are “associated” with WDID 0300911 in HydroBase. Tip: The Citizen’s Guide to Colorado Water Law, prepared by the Colorado Foundation for Water Education, is an educational booklet that provides information on many water related topics including the Basics of the Prior Appropriation System, Types of Groundwater, and Water Court Proceedings. This Guide is available from the Colorado Foundation for Water Education website (www.cfwe.org). 1 Example 1: I am interested in Ward Ditch in the Bear Creek basin. What information is available on this ditch? Step 1: Locate the diversion structure and view nearby structures. If you are a GIS user, you can use the CDSS GIS layers or Geodatabase to spatially locate and identify diversion structures, stream gages and irrigated acreage. If you are not a GIS user, or want to quickly identify nearby features, use the CDSS Map Viewer. Select the Map Viewer tab on the CDSS homepage and click on Accept Disclaimer and open CDSS Map Viewer. * *You will need to turn off the Popup blocker ** 2 Similar to other map viewer programs, you can zoom, pan, and identify information. The StateIMS User Manual, which includes instructions to zoom, pan, display specific GIS layers, and select features, is available on-line by selecting the question ? button. Display specific layers by clicking the check box next to the layer name. You can also use the find button to select a specific diversions, climate stations, or gage stations. To select specific features, the layer name in the layer list must be active – click the layer name, making sure it is highlighted gray. Activate the Diversions layer and select diversions, using the find button, search for the diversion station of interest. In this example, search for “Ward Ditch”. Click Find - the structures resulting from the query will be highlighted on the map. , zoom to the Ward Ditch located in the southwest corner of the South Using the zoom features Platte Basin. Turn on other layers to view nearby structures including: • Rivers in Base Folder • Pending and Decreed Instream Flow Reaches in the Instream Flow folder (see Example 3) • • 2005 Irrigated Acreage in the Land Use Folder Real Time and Historical Streamflow Gages in the Gage Folder Tip: Climate data recorded at nearby stations provides the basis for the historical consumptive use estimates calculated through daily or monthly consumptive use equations (e.g. Blaney-Criddle, ASCE Standardized Penman-Montheith). A Historical Crop Consumptive Use Analysis Review is available at the back of this training manual. 3 View more about a Feature by selecting more info. This takes you to the CDSS Structure Data Selector window. Step 2: View information available for the diversion structure, which can provide clues and help determine the “right questions” to ask the Water Commissioner. Highlight the structure in the Data Selector window and select the Structure Summary button. Specify the information you want to review, and select the Get Structure Summary button. 4 Information available in the Structure Summary Report is stored in HydroBase, the State of Colorado’s water resources database. Tip: Start with the Structure Summary when investigating diversions. The summary reports all available information, including source, legal locations, water rights information, irrigated acreage information, monthly diversions, and water commissioner comments. Review the “anatomy” of the Structure Summary Report for information regarding the ditch. • Water Rights o Transactions reflect the “history” of the water rights including transfers and abandonment o Net Amounts reflect the current status of water rights associated with the ditch o Adjudication and Appropriation Dates reflect the seniority of the water right o Adjudication Type (See Example 2 for more information on the water rights and decrees) • Irrigated Acreage o Land Use by crop type o Assessment Year (availability differs depending on Division) o Irrigation Method is pertinent to efficiency 5 • Diversion Summary o Total Diversions reflect total water for all uses o Diversion Comments reflect anecdotal information from the Water Commissioner Tip: To verify irrigated acreage, review the “GIS” acreage from State assessments and compare to Diversion Comment acreage (provided by the Water Commissioner). If significantly different, ask the Water Commissioner for confirmation. Step 3: View the diversion records for the ditch, which reflect historical use. Close the Structure Summary Report and choose the Diversion Records button. Available time-steps and diversion classifications will be presented, as outlined in the Diversion Records Standard Handbook (effect. November 1, 2010). Diversion data is generally recorded as daily records, and aggregated to monthly records within HydroBase. River diversions and reservoir releases are coded by source, location of source, use, and type – known as DivClass or SFUTG, where G lists an augmentation plan). The Diversion Records Standard Handbook 6 describes standard diversion and use codes and provides examples of how to code specific diversions. The following tables are directly from the Water Commissioner Handbook. Additionally, there are standard codes used in Water Commissioner comments that provide information in lieu of diversion records (NUC Codes). 7 8 Tip: Daily records for senior ditches can provide an indication of the minimum flow in a reach during the irrigation season on streams with no gaged data. Diversions classes can identify how much flow in the river is non-native (from reservoir releases or transbasin diversions). If senior ditches routinely divert less than decree, questions to ask the Water Commissioner include “Are they taking less than their decree because they don’t have the demand for the water? Is there a physical water limitation? Is there a legal water limitation?” Infrequent diversion records often include annual totals for ditches infrequently visited by the water commissioner. Diversion coding indicates that Ward Ditch generally the ditch diverts for direct irrigation and “carries” water to other structures (S:1 U:Q T:3). Note that this diversion coding was used frequently in the past for many types of diversions, and is no longer available. More discreet coding is now required to reflect the source and destination of all diversions. Individual or multiple Diversion Records can be viewed by choosing the Summary button or exported by choosing Export to save in text file or to open in Microsoft Excel. Tip: “Shares” in irrigation districts are not stored in HydroBase. To determine the amount of share ownership, inquire with the Water Commissioner or the District itself. Example 2: What water rights are carried through the Ward Ditch and how have they changed over time? Step 1: Find the water rights transactions for Ward Ditch. Select Water Rights from the Online Tools tab drop-down on the menu bar of the CDSS home. Help Files available include the Water Rights Data Dictionary, which provides a description of water rights information stored in HydroBase, including use types. The Water Right Data Dictionary can be viewed and/or printed. **Note that some of this information has been revised in the new Diversion Records Standard Handbook*** 9 The Water Rights Help File provides step by step instructions for querying water rights information. Refine the query by selecting Water Division/District 9 – Bear Creek. Select Water Right Name Starts With Ward. Note that there are 33 water rights transaction records returned. To limit the records to the Ward Ditch on Bear Creek, query again by Structure ID (958). Select Water Rights Report by Structure Name (Adobe) in the Output Options. 10 There are five individual water rights carried by Ward Ditch, many of the senior water rights are transferred from Warrior/Harriman Ditch. Individual water rights transactions occurred under five separate Court Cases. Note that 53 cfs of the junior water right was abandoned in 1988. Click on Images next to each water right transaction to view the Decree associated with the water right transaction. 11 Tip: There are several options to narrow down the search of water rights in HydroBase. The tabs that refine searches cannot currently be used in conjunction, so choose a narrowing search then use Excel to sort and categorize further. Tip: Decreed and conditional water right rates are stored in HydroBase as a text field. If you choose the “Export as Excel” option when querying HydroBase, you will need to convert text columns to values to be able to use arithmetic functions, such as summing or averaging. If you save the output as a CSV file, it automatically brings rates and other numbers into Excel as a value field. Example 3: Is there a decreed Instream Flow Reach near Ward Ditch? Step 1: Use the Map Viewer to identify nearby Instream Flow Reaches. Toggle back to the Map Viewer screen to view Ward Ditch and nearby structures. In Example 1, the ISF Pending Decree and Stream with Instream Flow Right layers were turned on. There appears to be a decreed ISF reach just upstream of Ward Ditch on Bear Creek. To identify the ISF Reach and obtain additional information on it, first activate the Stream with Instream Flow Right layer – click the layer name making sure it is highlighted gray. Next, click on the identify button to enable this functionality in the Map Viewer. Then click on the decreed ISF feature (purple line) in the Map Viewer just upstream of the Ward Ditch diversion point. 12 View more about a Feature by selecting more info. This takes you to the CWCB Instream Flow Water Rights Database. Step 2: View information available for the decreed ISF Reach, including reach extents and water rights. The CWCB Stream Cases Physical Information Summary provides information on the Bear Creek ISF Reach located just upstream of Ward Ditch. Based on the summary, this ISF reach was appropriated in 1994 for 15 cfs in the summer months (April – October) and 7 cfs during the winter (October – March). The summary provides the reach termini, however it may be easier to view the ISF reach extent using the Map Viewer. Additional information regarding the CWCB Instream Flow Program can be found on the CWCB website (cwcb.state.co.us). 13 Instream Flow Program information: • Instream Flow FAQs, Statutes, and Rules • Water Acquisitions Program and Proposed Acquisitions: a voluntary program that allows water rights' owners to donate, sell, lease or loan existing decreed water rights to the CWCB on a permanent or temporary basis. • Annual Lists of Recommended ISF Appropriations Instream Flow Water Rights Database information: • Searchable database for ISF and Natural Lake Water Rights • Query by County, Division, Case Number, Stream Name, or Watershed • Results in a Physical Information Summary Example 4: Identify wells located on a property, and determine what information is available. Step 1: Locate a specific Township/Range/Section and view structures and information located in the area of interest. As with Example 1, if you are a GIS user, you can use the CDSS GIS layers or Geodatabase to spatially locate and identify wells and irrigated acreage associated with a specific location. For this example, we will use the CDSS Map Viewer and search for wells in Section 16, Township 5N, Range 54W. The CDSS Map Viewer has the functionality to Zoom To specific locations. Click on the Zoom To feature and use the parameters to find Township 5N, Range 54W. 14 Turn on additional layers to view pertinent information including: • Sections in the Base Folder • 2005 Irrigated Acreage in the Land Use Folder • Decreed Wells in the Diversions Folder • Wells by Permit Number in the Well Applications Folder , zoom to Section 16 located west of Prewitt Reservoir. Note that there are Using the zoom feature both decreed and permitted wells located in the section of interest. This example focuses on the permitted wells as information for decreed wells can be accessed through the CDSS Water Rights viewer used in Example 2. Step 2: Query for Permitted Wells and find associated ground water information. To select specific features, the layer name in the layer list must be active – click the layer name, making sure it is highlighted gray. Activate the Wells by Permit Number layer and use the Select by Area tool to select all the wells located in Section 16. There are 12 permitted wells in Section 16. 15 Tip: Permitted wells do not have a decreed water right, and limited information on the wells is generally available in HydroBase. This may be due to the use of the well (i.e. small domestic wells are exempt); the location of the well (i.e. some rivers are not over-appropriated and a well does not need a water right to pump); or the depth of the well (i.e. non-alluvial wells pump from Designated Basins and do not need a permit). Attributes from the Well Permit layer reflect the information provided on the well permits. This includes uses, owner, well parameters and location parameters. For example, the following information is provided for Permit No. 8579R: • first used in 1954 • permitted for irrigation use • total depth of 121 feet • yields 1800 gpm • depth of 17 feet to static water level • owned by State Land Board Tip: Owner information was initially included in HydroBase, however is not a reliable source of information as the State does not track changes in ownership through time. It is best to confirm this information with the State. Additional driller log information, geophysical log data, pumping test or volcanic material data information may be available. Select Groundwater (Other) from the Online Tools tab drop-down on the menu bar of the CDSS home. Help Files available include the Groundwater (Other) Data Dictionary and the Groundwater (Other) Help File which provide descriptions of information stored in HydroBase available through this query option. Continuing with the example of Permit No. 8579R, select Groundwater Data Type Pumping Tests and query for Permit Number 8579. 16 One record is returned, indicating a specific capacity pump test was performed on this well in 1978. No driller log information, geophysical log data, or volcanic material data is available for this permit. The scanned version of the permit itself is available via the Colorado Division of Water Resources website through the Laserfiche WebLink network. From the Colorado Division of Water Resources website (water.state.co.us), select the Documents & Forms webpage. On this webpage, select the Imaged Documents option from the left side of the screen. 17 Once on the Imaged Document Search Tool page, note that there are links to help documents, including the Weblink Help and the Research Help, that provide guidance for search. Additionally, these documents provide links to other pertinent reports and information available from the Colorado Division Water Resources website, including the State’s Abandonment List. Select the Imaged Documents (Weblink) link to search for the scanned permit for our example well. 18 Using the Template Well Permit Information, search for Permitno 8579. There are 4 results for this query. Refer to the CDSS Map Viewer well results to determine the Receipt Number to narrow down which permit is associated with our example well. The Receipt Number for Well Permit No. 8579R is 9056482. In the WebLink results, select the link under the Name column associated with the correct Receipt and Permit Number. The scanned permit for Well Permit No. 8579R will open, and the permit can be saved or printed. 19 20 CDSS Products 1. Basin Operation Information • Basin Fact Sheets • Straight-line Diagrams • Basin Information Reports • Water Resources Planning Model User’s Manual • Supporting Technical Memoranda From the Colorado’s Decision Support Systems home page (http://cdss.state.co.us/), select the basin of interest under the Basins tab. Scroll to review Quick Facts. View and Select Documents of interest under the Documents tab. Selecting the basin, while leaving other query fields blank will show all the documents, shapefiles, and Geodatabases available for the basin. Documents will display in an internet browser, allowing the option to save in *.pdf format. 21 2. GIS Coverages From the Colorado’s Decision Support Systems home page ( http://cdss.state.co.us/), select GIS Data tab. The File Download window guides you through either opening or saving the associated Geodatabase (ArcGIS 9.2 and later). 22 The File Download window guides you through either running the program open the Geodatabase, or save the Geodatabase on your computer. Information in the Geodatabase each division includes: • Boundaries (Water division/district and County boundaries) • NHD Hydrography (Rivers, lakes and reservoirs) • • • • • Structures (diversions, wells, stream gages, and reservoirs) Climate Stations Irrigated acreage (for snapshot years) Contours (50 meter) Soil Data (AWC for CU analysis, Statewide only) To download GIS layers, go through the Documents tab, select your basin to see available information, and download your divisions GIS layers. The File Download window guides you through either running the program to extract and save the layers, or saving the self-extracting zip file on your computer - allowing you to extract the layers at a later time. 23 Available layers for each division include: • • • • • • • • • • • • • • • • Water district boundaries Rivers Diversion structures Streamflow stations Climate stations Irrigated acreage (snapshot years) Lakes/Reservoirs Soil Data (AWC for CU analysis) Contour Lines Cities Highways Counties Hydrologic Unit Codes (HUCs) Land Use PLSS (public land survey system) Wells 3. General Water Resources Data • Stored in HydroBase, more data in completed DSS basins • Can be accessed through the CDSS Website (see Examples) • Can be accessed through Data Management Interfaces (StateView, TSTool, StateDMI) Available HydroBase data includes: • • • • • • Diversion records Streamflow measurements Water rights and well permits Climate data Call chronology Reservoir contents • • • • • • Groundwater levels Irrigated acreage Agricultural statistics Census data Owner/Operator information Structure physical information (headgate capacity, area/capacity curves) 4. Modeling Software and Data Sets • StateCU – Consumptive Use Model • StateMod – Surface Water Model • Basin-specific Model Data Sets 24 Historical Crop Consumptive Use Analysis - Review Definitions 1. Monthly Potential Consumptive Use (PCU) = crop evapotranspiration Modified Blaney-Criddle – outlined in SCS Technical Release 21 (most common) PCU = k * f f = t * p/100 k = kt * kc where: t = mean monthly air temperature p = mean monthly percentage of annual daylight hours k t = temperature coefficient k c = crop coefficient Original Blaney-Criddle – outlined in FAO-24 (typically used w/ calibrated coefficients developed from lysimeter data) Pochop Method – outlined in Elevation – A Bias Error in SCS Blaney-Criddle ET Estimates (for bluegrass) Input Data: Climate – monthly temperature and frost dates Latitude – used to calculate daylight hours Crop Type Crop Coefficients/Growing Season Triggers 25 2. Monthly Effective Precipitation (Re) = amount of monthly precipitation effective at serving crop needs Methods: SCS – outlined in SCS Technical Release 21 (dependent on net depth of application and average monthly PCU) USBR (linearly related to the monthly precipitation) Input Data: Climate – monthly total precipitation Net Application Depth Adjustments to Climate Data: Orographic Adjustment– outlined in ASCE Manual 70 User Supplied adjustments, typical values: Temperature – Adjust the climate station temperature down by 3.6 degrees per 1,000 feet rise in elevation between the irrigated acreage and the climate station location (based on the standard meteorological Environmental Lapse Rate) Precipitation – Compute the ratio of the annual precipitation at the location of the irrigated acreage (using average annual Isohyetal maps) divided by the average annual precipitation at the climate station. Monthly values at the climate station are then multiplied by the ratio to estimate monthly values at the irrigated lands. o Adjusts climate station data to location of irrigated lands o Used when representative climate station data not available (e.g. high altitude irrigated areas) o General “weight” climate station data if irrigated lands are located between multiple climate stations, in lieu of adjusting raw data 26 Adjustments to PCU: Use Crop Coefficients Representing Local Conditions Elevation Adjustment – outlined in ASCE Manual 70 10% upward for each 1,000 meters increase in elevation above MSL o Corrects for lower mean temp at higher elevations that do not reflect crops’ reaction to warm daytime temp and cool nights o Applies to Modified B-C and Original B-C method (Pochop has separate builtin altitude adjustment) o Applies to any crop type 3. Monthly Crop Irrigation Requirement = the amount of water the crops could use from a full irrigation supply CIR = PCU – Re 4. Supply-Limited Crop CU = Actual Crop Consumptive Use = Historical Crop Consumptive Use = Total Crop CU The actual amount of water the crops consumed from irrigation supplies. This is the amount that can be transferred to another use or another location. The amount of water historical diverted (surface or ground water) but not-consumed by the crop due to conveyance and application losses is the unlagged or total return flow obligation. As a “Term and Condition” of the water right change or transfer, this amount must continue to be available to the river based on historical lagged patterns to assure junior uses are not injured. Monthly Supply to the crop is compared to monthly CIR estimates based on a ditch-level water balance approach as follows: 27 Read Water Supply Information Adjust for Conveyance Efficiency = Farm Headgate Diversion Adjust for Max Application Efficiency = Effective Surface Water Supply No Available Soil Moisture? Consider Soil Moisture? No Yes Surface Water Supply > IWR? Yes Determine Soil Moisture Reservoir Capacity by Structure Water Supply Limited CU = Irrigation Water Requirement No Yes Water Supply Limited CU = Surface Water Supply Remaining Water Supply Used to Fill Soil Moistture Water Supply Limited CU = Surface Water Supply + Soil Moisture Supply River Diversion Conveyance Efficiency Irrigated Acreage/ Irrigation Method Soil Storage Capability Application Efficiency 28 Example 5: Estimating crop CU for a specific ditch using the StateCU Wizard Estimate the crop consumptive use for the Templeton Ditch in the Dolores River Basin. The StateCU model, and associated Documentation, is available on the CDSS website under the Products menu. Open StateCU by clicking on the application on your desktop or through an explorer window by clicking on the StateCUI.exe executable installed in the \cdss\statecu\bin\ subdirectory. The HydroBase Wizard is an interactive tool that guides the user step-by-step through the development of a new monthly scenario and pulls required input data directly from HydroBase through an internet connection. The HydroBase Wizard can be used to create a new monthly Climate Station Scenario or a Structure Scenario. Required data (e.g. climate data, diversion records, crop characteristics) is pulled directly from HydroBase via an active internet connection and formatted into the correct input files. Note that the purpose of the Wizard is to create a complete and operational scenario based on HydroBase data; it is the user’s responsibility to review and edit specific data in the input files through the GUI to obtain accurate results. Activate the Wizard by selecting the Create new StateCU scenario using HydroBase Wizard command through the File menu. Figure 5 displays the introductory screen to the Wizard. All screens in the Wizard have an Exit button. Select the OK button to proceed to Step 1. 29 Step 1: Select Consumptive Use Options Step 1 of the Wizard identifies the analysis as a Climate Station Scenario or a Structure Scenario. Using the radio controls, select the Structure Scenario. Select the option to use crop and acreage data from the data source and to use diversion data from the data source. The crop, acreage and diversion data loaded in HydroBase for the specific structure will be used when creating the input files. If either of these options is unchecked, the Wizard will ask for crop and acreage data to be manually entered in Step 3 and diversion data to be manually entered by the user in the GUI. Note that the message of ‘Connected’ in green text will appear if there is an active internet connection. If an internet connection is not available, the message will state ‘Not Connected!’ in red text. Enter a new scenario name avoiding special characters, spaces or periods in the file name. All input files will receive the same scenario ‘base’ name. The Wizard saves all new scenarios to the C:\CDSS\Data\StateCUWizard directory. Name this scenario “Templeton”. Click on the Continue button to move to the next step. Step 2: Select the structure for the analysis A Structure Scenario created in the Wizard will determine the potential crop consumptive use, irrigation water requirement and water supply limited consumptive use for one or more crops at a specific diversion structure. Step 2 of the Wizard determines the consumptive use location (ditch) that will be used in the analysis. Select the radial button to Search by Name, and enter Templeton in the Search by window. The search can be narrowed, if desired. Narrow the search by Division, and select Division 4 for the Gunnison Basin. Select the green Refresh List button. 30 Highlight the Templeton Ditch in Water District 60 – San Miguel River basin. Click on the View structure info to view structure and diversion class information. Templeton Ditch has only one diversion class, S:1 F: U1 T: G:, indicating the structure only diverts Source 1 (river) for Use 1 (irrigation). Therefore, when performing the historical crop consumptive use analysis for Templeton Ditch, it is appropriate to use DivTotal through the headgate. The diversion data can be previewed by clicking on the View DivTotal. Select the radial button for “Use structure DivTotal” and click the Continue button. Step 3: Select crop(s) and acreage Step 3 of the Wizard determines which crop(s) will be used in the analysis. Note that although acreage and crops can vary over time, the Wizard uses the single ‘snapshot’ of the most current CDSS acreage assessment data in this step and applies them to all years in the scenario. This data can be edited in the GUI to represent changes in cropping practices. 31 Based on the most recent CDSS Irrigated Acreage Assessment representing the year 2000, Templeton Ditch irrigates 20.09 acres of Grass Pasture. The Grass_Pasture.TR21 designation indicates that standard TR-21 coefficients will be used to estimate potential crop consumptive use. Highlight Grass_Pasture.TR21 and click the View info about selected crop button to see the parameters used to estimate growing season. The “Temperature Early Moisture” and “Temperature Late Moisture” indicates that the growing season will start when the mean monthly temperature reaches 45 deg F and end when it drops below 45 deg F. Note that these defaults are recommended in SCS TR-21, and can be revised by the user to reflect known irrigation practices. 32 The user can also revise the acreage and crop type, based on additional information by checking the boxes to select additional crops and entering or revising the associated acreage. The user can also choose to apply an elevation adjustment to all TR21 Crop Coefficients, using the check box in the lower left corner of the window. For this analysis, check the Apply elev adj to all TR21 crop coefficients and click on the Continue button to move to the next step. Step 4: Select climate station(s) Step 4 of the Wizard determines which climate station(s) will be used in the analysis. The Structure Scenario will only include one consumptive use location, however data from multiple climate stations can be used to determine the consumptive use. If multiple climate stations are selected, the Wizard equally weights the climate data from the multiple climate stations for the analysis. Select the District radial button in the “Narrow the search” by window and select Water District 50 – San Miguel River Basin. Six climate stations are available. Based on the location of Templeton Ditch, select Uravan to represent the climate conditions for this irrigated acreage. The View station info button displays physical information about the climate stations, including elevation and latitude. The View Precip Data and View Temp Data buttons provide monthly climate data and shows when/if data is missing. Review of the climate data indicates there is sufficient data for the analysis. Click on the Continue button to move to the next step. Step 5: Choose the time period and describe the scenario After completing the climate station selection in Step 4 of the Wizard, the user has determined all of the input parameters necessary to create a Structure Scenario. The Final Step of the Wizard is to set the 33 beginning and ending year of the analysis and enter a description of the scenario. Note that all time series data files will be created using these time period parameters. Through the GUI, an analysis can be adjusted to a smaller time period, but not a larger period, therefore it is recommended to define this period as large as available data can support. Missing data in the input files is indicated by -999. The user can choose to have StateCU fill missing data “on-the-fly” with month averages or zeros through selecting Missing time series data fill options in the Final Step. Note that ‘on-the-fly’ filling will fill the missing data for the consumptive use calculations only; the original input file data will remain unchanged. Consumptive use calculations cannot be performed for years with any missing data. Edit the years by typing over the default or using the up and down arrows. When we reviewed available diversion records in Step 2 above, we noted that diversion records are available beginning in 1974. Set the Begin Year to 1974. In addition, we noted that there were a few months of missing climate data. Select the Fill clim w/hist avg & div w/0 radial button. Enter a description of the scenario in the three allotted lines - this information is stored in the header of the model control options file and is included in certain output reports. Select the Create New Scenario to complete the creation of the scenario. 34 Several parameters and modeling options are not specifically input by the user into the Wizard, rather it is the responsibility of the user to review and edit these parameters through the GUI. The Wizard sets these parameters to defaults when creating the scenario. The default settings are listed in a window that is activated once the scenario is created. The following is a list of these defaults settings: • • • • • • The Modified Blaney-Criddle consumptive use analysis method is set The effective precipitation method is set to the SCS method. Crop types and crop acreages is fixed for all years Canal efficiencies are set to 80% Acreage is all set to be flood irrigated and crop types are fixed for all years (non-variable) o The maximum flood irrigation efficiency is set to 45% o The maximum sprinkler irrigation efficiency is set to 75% No soil moisture accounting and structure available water capacity is set to zero Input data generated through the StateCU Wizard can be viewed and edited through the StateCU Edit menu. For more information and easy to follow instructions, including screen shots, see the StateCU Documentation. Step 6: Run the simulation Select the Run.. Run Simulation command under the main menu. When a run is initiated, the StateCU GUI shells out to a DOS window to execute the StateCU program. The process status and any warning or error messages are displayed in the DOS window during StateCU execution. If the execution is successful, the DOS window will either close automatically or prompt the user to press the Enter key, and the user will be returned to the GUI to view output. If the execution is unsuccessful, the StateCU 35 generated log file will be displayed on the screen with a description of the error that caused the program to terminate. Tip: The user should view the StateCU Fortran Program Log File located in the Results menu or through a text editor even with a successful execution, as it may contain warnings or other pertinent information. In addition, the log file summarizes much of the data input. Step 7: View the results StateCU generates standard output reports that can be viewed through the GUI. Select the Results..Detailed Water Budget Output (*.dwb) to view annual, average monthly, and monthly results for the analysis. As shown, on average the annual Irrigation Water Requirement for the Templeton Ditch, based on the acreage assigned in HydroBase, is 54 acre-feet. The average Total Estimated Crop CU is 36 acre-feet, indicating the ditch does not receive a full supply. Select the Results..Time Series Data Report Generator (*.bd1) to select specific water budget components to view, graph, and save. Click twice on the Add Row from Data Source button. Double click on the ID (Name) and select “6000776 (TempletonDI)” from the drop-down list in both rows. Double click on the Data Type in row 1 and select “Irrigation Water Reqt” from the drop-down list. Double click on Data Type in row 2 and select “Total Crop CU” from the drop-down list. The results can be viewed in several formats, described in the StateCU Documentation. Select the Excel Graph and Worksheet button. The data is loaded into a Data worksheet in Excel and a corresponding Graph worksheet is created. The Excel spreadsheet can be saved and the graphical presentation revised. 36