1
ORACLE.COM/JAVAMAGAZINE /////////////////////////////////////////// MARCH/APRIL 2015
COMMUNITY
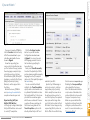
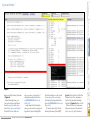
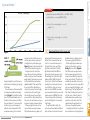
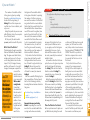
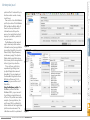
Select View option to Package
View, and then expand the tree
menu to select only the org.javaee7
.concurrency, org.javaee7.jsf, and
org.javaee7.session packages, as
shown in Figure 3.
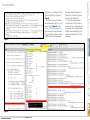
Within the Edit Profiling Roots
dialog box, you can also select
separate classes, down to the constructors and methods, to pinpoint
your performance measurements.
Click OK to close the dialog box,
and then ensure that the Filter
option is set to Profile only project
classes. Because enterprise applications typically invoke Java classes
JAVA IN ACTION
Before production
deployment, it
is imperative that
developers have an
accurate portrayal of
how an application
performs for its
users.
(sampled) option for the CPU profiler can sometimes incur too much
overhead and produce output that
is not meaningful without performing extended analysis.
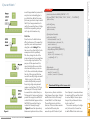
Click the customize link that
appears near the end of the
Advanced (instrumented) option.
This link opens up the Edit Profiling
Roots dialog box, which enables
you to choose which servlets, listeners, or application packages to
profile. By default, the Select View
option is set to Web Application
View, allowing you to select servlets and listeners. Change the
ABOUT US
only once, but if you
disabled by default.
KNOW YOUR APP
make any significant
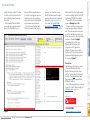
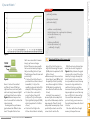
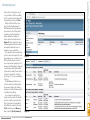
Accept the defaults
changes to the environand then click Run.
ment, recalibrating is a
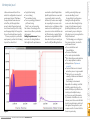
Doing so deploys and
good idea.
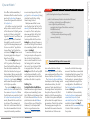
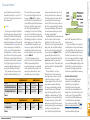
starts the applicaTo calibrate, choose
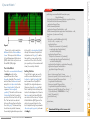
tion, and opens both
Advanced Commands
a Profiler window
-> Manage Calibration
and a VM Telemetry
Data from the Profile
Overview window (see
menu. Next, choose
Figure 2) within the
the targeted Java platNetBeans IDE.
form, and click the
The Profiler window
Calibrate button. After
provides the ability to
the calibration is comtake snapshots, view
plete, a success mesdump heaps, and more.
sage is displayed (see
Take the opportunity
Figure 1).
to hover over the charts within the
By using the profiler, you can
VM Telemetry Overview window
perform a myriad of profiling
to see detailed information about
tasks against a NetBeans project.
the heap or garbage collector at the
This article focuses on the default
specified time selection.
profiling configuration, but other
After you are comfortable
options are available. The three
with these options, run the promain options are Monitor, CPU, and
filer again by right-clicking the
Memory. Each of those contains
NetBeans project and choosing
its own suboptions for performing
Profile. If the profiler is still active,
quick or customized profiling. Read
you are prompted to end the curthe “Introduction to Profiling Java
rent session and begin a new one;
Applications in NetBeans IDE” for
otherwise, you can stop the profiler
more information.
manually by clicking Stop within
To monitor the AcmeWorld applithe Profiler window.
cation, right-click the project in the
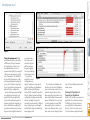
This time, choose CPU, and
Projects menu, and then choose
then select the Advanced (instruProfile, which opens the profiler’s
mented) option. The CPU profiler
main window.
allows you to profile the perforThen, choose Monitor. A few
mance of all application classes
options (for thread monitoring and
or only selected classes. That
lock contention monitoring) are
said, choosing the default Quick
JAVA TECH
//enterprise java /
blog
Figure 8
61