1
Debugging and Profiling Workshop
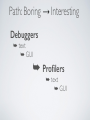
• A look at available debuggers and Profilers on PACE clusters (text/GUI)
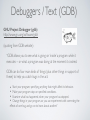
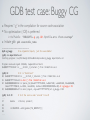
• Debuggers - GDB
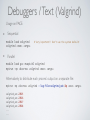
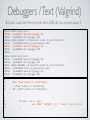
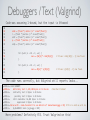
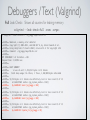
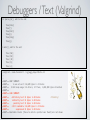
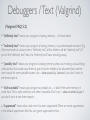
- Valgrind
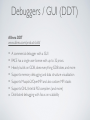
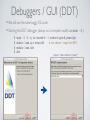
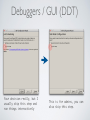
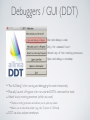
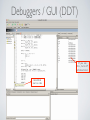
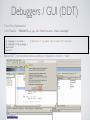
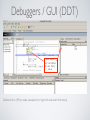
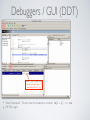
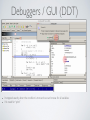
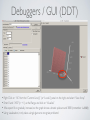
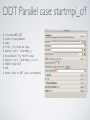
- DDT
• Profilers
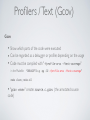
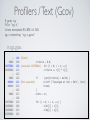
- Gprof/Gcov
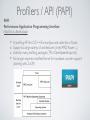
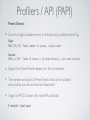
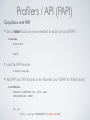
- PAPI
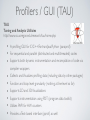
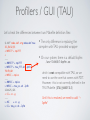
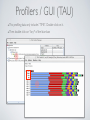
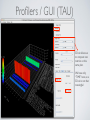
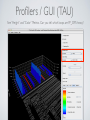
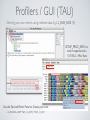
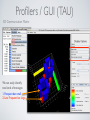
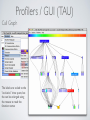
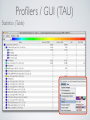
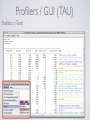
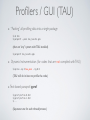
- TAU
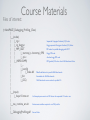
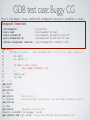
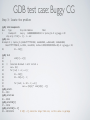
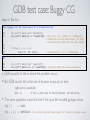
• Hands-on examples • Run “pace-register-classes” and pick this class in the list to register and copy
the class materials in ‘~/data/PACE_Debugging_Profiling_Class’ • This includes *everything* you need to follow/replay the tutorial
• Slides are designed to be self-contained (yes, they are crowded!)