1
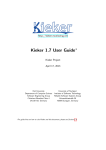
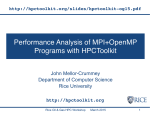
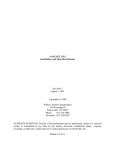
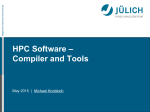
CS 594: SCIENTIFIC COMPUTING
FOR ENGINEERS
PERFORMANCE ANALYSIS TOOLS
Gabriel Marin
[email protected]
Some slides borrowed from Dan Terpstra, John Mellor-Crummey
Rough Outline
1.  Part I
•
•
•
Motivation
Introduction to Computer Architecture
Overview of Performance Analysis techniques
2.  Part II
•
•
Introduction to Hardware Counter Events
PAPI: Access to hardware performance counters
3.  Part III
•
2/26/2014
HPCToolkit: Low overhead, full code profiling using hardware
counters sampling
2
What is Performance?
•
•
•
•
•
•
2/26/2014
Getting results as quickly as possible?
Getting correct results as quickly as possible?
What about Budget?
What about Development Time?
What about Hardware Usage?
What about Power Consumption?
3
Why Performance Analysis
•  Large investments in HPC systems
o  Procurement costs:
o  Operational costs:
o  Electricity costs:
~$40 million / year
~$5 million / year
1 MW year ~$1 million
•  Efficient usage is important because of expensive and
limited resources
•  Scalability is important to achieve next bigger simulation
•  Embedded systems have strict power and memory
constraints.
2/26/2014
4
Simple Performance Equation
t = N *C / f
•  N – number of executed instructions
•  C – CPI = cycles per instruction
•  f – processor frequency
P =1/ t = f * I / N
•  I – IPC = instructions per cycle
•  Frequency scaling provided “easy” performance gains for
many years
•  Power use increases with frequency cubed
2/26/2014
5
Simple Performance Equation
P = f *I / N
•  N – affected by implementation algorithm, compiler,
machine instruction set (e.g. SIMD instructions)
•  f – determined by architecture, is not going up
anymore
•  I – affected by code optimizations (manual or
compiler) and by micro-architecture optimizations
•  Current architectures can issue 6-8 micro-ops per cycle
•  Retire 3-4 instructions per cycle (Itanium can retire 6)
•  IPC > 1.5 is very good, ~1 is OK, many applications
get IPC < 1
2/26/2014
6
Factors Impacting Performance
•  Algorithm – biggest impact
•  O(N*log(N)) performs much better than O(N2) for
useful values of N
•  Code implementation
•  Integer factor performance difference between efficient
and inefficient implementations of the same algorithm
•  Compiler and compiler flags
•  Architecture
2/26/2014
7
Example: Matrix Multiply
void compute(int reps) {!
int i, j, k, r;!
for (r=0 ; r<reps ; ++r)!
for (i = 0; i < N; i++) !
for (j = 0; j < N; j++) !
for (k = 0; k < N; k++) !
C(i,j) += A(i,k) * B(k,j);!
}!
2/26/2014
8
Matrix Multiply: Different Compilers
2/26/2014
9
Computer Architecture Review
Knowledge of the micro-architecture is very
important when trying to understand performance.
Most times the architecture is fixed, given to us.
But we can tailor our code to the target architecture.
In very specialized cases we want to tailor an
architecture to a specific application / workload
2/26/2014
10
Computer Architecture Review
CPU
front-end
CPU
back-end
2/26/2014
11
Processor Model
Front-End
Branch
predictor
I-cache
miss rate
F
Fetch /
Decode
Back-End
I
Reorder buffer (ROB)
# entries
Reserv.
Station E
Execution
Units
R
Retire /
Writeback
OoO
•  Front-end: operates in-order
•  Instruction fetch/decode
•  Branch predictor - speculative instruction fetch and
decode
•  ~ 1 in 5 instructions is a branch
•  Back-end trumps front-end
2/26/2014
12
Processor Front-End Stalls
Front-End
Branch
predictor
I-cache
miss rate
F
Fetch /
Decode
Back-End
I
Reorder buffer (ROB)
# entries
Reserv.
Station E
Execution
Units
R
Retire /
Writeback
•  Possible front-end stall events
•  I-Cache or I-TLB miss
•  Branch misprediction
•  Full Reorder Buffer
2/26/2014
13
FE Stalls: I-Cache or I-TLB Miss
Front-End
Branch
predictor
I-cache
miss rate
F
Fetch /
Decode
Back-End
I
Reorder buffer (ROB)
# entries
Reserv.
Station E
Execution
Units
R
Retire /
Writeback
•  Instruction fetch stops
•  Instructions continue to be dispatched until
buffers drains (hides penalty)
•  Pipeline starts to refill once the miss event is
resolved; refill time ~ drain time
•  Penalty ~= miss event latency
2/26/2014
14
FE Stalls: I-Cache or I-TLB Miss
•  Possible causes
•  Execution spread over large regions of code with
branchy unpredictable control flow
•  Not typical for HPC
•  Large loop footprint + small I-cache
•  Older Itanium2: 16KB I-cache, no hardware prefetcher
•  Space inefficient VLIW instruction set
•  Loop fusion / loop unrolling can create large loop footprints
•  Possible solutions
•  Feedback directed compilation can change code
layout
•  Limit loop unrolling or fusion
2/26/2014
15
FE Stalls: Branch Misprediction
mispred. branch
enters back-end
branch
executes
IPC
branch
resolution
front-end
refill
time
penalty
•  Mispredicted branch is fetched
•  Instruction fetch continues along a wrong path
•  Pipeline filled with useful instructions at this point
•  Mispredicted branch enters back-end
•  Back-end filled with useful instructions at this point
•  Branch executes, misprediction detected, pipeline is flushed
•  Instruction fetch starts on the correct path, front-end starts to refill
•  Penalty ~= branch resolution time + front-end refill
2/26/2014
16
Branch Misprediction Penalty
Architecture
Branch misprediction
penalty
AMD K10 (Barcelona, Istanbul, Magny-Cours)
12
AMD Bulldozer
20
Pentium 4
20
Core 2 (Conroe, Penryn)
15
Nehalem
17
Sandy Bridge
14-17
•  This is the minimum penalty, proportional to the processor
pipeline depth.
•  Bulldozer has a deeper pipeline than K10 -> higher penalty
•  Sandy Bridge added a micro-ops cache, which can lower
misprediction penalty compared to Nehalem.
2/26/2014
17
Branch Misprediction Penalty
•  Branch predictors have improved in time
•  Both Intel and AMD
•  Modern branch predictors have very good accuracy on typical
workloads, 95%+
•  Is there room for improvement?
•  Does it matter if we go from 95% to 96%?
2/26/2014
18
Branch Misprediction Penalty
•  Branch predictors have improved in time
•  Both Intel and AMD
•  Modern branch predictors have very good accuracy on typical
workloads, 95%+
•  Is there room for improvement?
•  Does it matter if we go from 95% to 96%?
•  Performance loss is proportional to branch misprediction rate
•  5% to 4% misprediction rate is a 20% improvement
•  ~ 1 in 5 instructions is a branch in typical workloads
•  Losses due to branch misprediction
•  Branch misprediction rate X pipeline depth
2/26/2014
19
FE Stalls: Full ROB
Front-End
Branch
predictor
I-cache
miss rate
F
Fetch /
Decode
Back-End
I
Reorder buffer (ROB)
# entries
Reserv.
Station E
Execution
Units
R
Retire /
Writeback
•  ROB maintains in-order state of not yet retired micro-ops
•  µops still in the issue buffer (have not executed)
•  µops in the back-end EU (executing)
•  µops that have completed before the ROB head micro-op
•  On a long data access, other micro-ops continue to issue,
but micro-ops dispatched after the stalled load cannot
retire
•  Dispatch continues until ROB fills up, then it stalls
2/26/2014
20
Processor Back-End
Intel Sandy Bridge
AMD K10
•  Execution units organized in stacks
•  Can issue one µop to each issue port each cycle
•  Can handle different instruction mixes
•  Register files (not shown)
•  Bypass network to forward results between stacks
•  Back-end inefficiencies trump front-end
2/26/2014
21
How To Define Peak Performance?
•  Peak retirement rate (IPC)
•  From the architecture point of view
•  Peak issue of “useful” instructions
•  HPC cares about FLOPS, mainly Adds and Multiplies
• Peak FLOPS rate, everything else is overhead
•  You need many data movement instructions (Loads, Reg
Copy, Data Shuffling, Data Conversion) + address
arithmetic and Branches to perform useful work
• Cannot get close to peak for most workloads, dense
linear algebra is an exception
•  What about SIMD instructions?
•  Peak issue of SIMD “useful” instructions
2/26/2014
22
Back-End Inefficiencies
•  Instruction dependencies limit available ILP
•  Machine units sit mostly idle
•  Mismatch between application instruction mix and available
machine resources
•  Contention on a particular execution unit or issue port
•  One unit heavily used while many units sit idle
•  Too many overhead instructions: address arithmetic, spill /
unspill code, branches, etc.
•  High IPC, but
•  “useful” operations are a fraction of all program operations
2/26/2014
23
Back-End Inefficiencies
•  Low mix of SIMD operations
•  Good IPC and ratio of “useful” instructions, but
•  Small fraction of peak performance
•  Long data access
•  Memory access misses in D-Cache or D-TLB
•  Non-blocking caches, other instructions continue to issue
• Multiple outstanding accesses to memory possible
•  Retirement stops on a long latency instruction
• Eventually ROB fills up, dispatch stops
2/26/2014
24
Long Data Accesses
•  Typically the main source of performance losses
•  Micro-architecture optimizations
•  Multiple levels of cache – exploit temporal and spatial reuse
• Eliminate many accesses to memory
•  Hardware prefetchers – fetch data before it is needed
• Hide memory latency
• Work best with streaming memory access patterns
•  Software optimizations
•  High level loop nest optimizations: tiling, fusion, loop
interchange, loop splitting, data layout transformations
• Increase temporal and/or spatial reuse
•  Software prefetching – uses instruction issue bandwidth
2/26/2014
25
Introduction to
Performance Analysis
2/26/2014
26
Performance Optimization Cycle
Code Development
functionally complete
and correct program
Performance Analysis
Measure
Analyze
•  Understand
•  Where time is spent
•  What factors are limiting performance
•  Performance improvement potential
Modify / Tune
complete, correct and
well-performing
program
Usage / Production
2/26/2014
27
Performance Analysis Challenges
•  Many variables affect performance
•  Micro-architecture optimizations make analysis
nondeterministic
•  Performance measurement well supported by tools
•  Analysis of results typically left to the user
•  You must have a feeling of what can go wrong
•  Computer architecture insight helps
•  Everyone has a different style
2/26/2014
28
Performance Analysis Techniques
•  Performance measurement
•  Performance modeling
•  Simulation
•  The line between different techniques can be
blurry
•  Modeling can use measurement or
simulation results as input
2/26/2014
29
Performance Measurement
•  Profiling vs. tracing
•  Instrumentation vs. sampling
•  Advantages
•  Performance of actual code on a real system
•  Reveals hotspots
•  Disadvantages
•  Observes performance effects
• Performance insight (diagnosis) not always
apparent
2/26/2014
30
Profiling vs. Tracing
Profiling
•  Records aggregate performance metrics
• No timeline dimension, or ordering of events
•  Number of times a routine was invoked
•  Time spent or cache misses incurred in a loop / routine
Tracing
•
•
•
•
When and where events took place along a timeline
Time-stamped events (points of interest)
Shows when/where messages sent/received
Event Trace: collection of all events of a process/program
sorted by time
2/26/2014
31
Profiling
•  Recording of summary information during execution
•  inclusive, exclusive time, # calls, hardware counter
•
•
•
•
statistics, …
Reflects performance behavior of
•  program entities: functions, loops, basic blocks
•  user-defined “semantic” entities
Very good for low-cost performance assessment
Helps to expose hotspots
Implemented through either
•  instrumentation: direct insertion of measurement code
•  sampling: periodic OS interrupts
2/26/2014
32
Instrumentation
•  Add calipers around code
Application code
start_timer()!
2/26/2014
areas of interest
stop_timer()!
•  Tradeoff
•  Instrumentation granularity
start_timer()!
vs. measurement overhead
stop_timer()!
•  Limits how much we can
measure
33
Application code
Sampling
2/26/2014
•  OS interrupts at fixed intervals
•  Record program counter when
interrupt received
•  Probability of recording a sample
goes up with time spent in a given
code region
•  Collect distribution of interrupt
samples
•  Arbitrarily low overhead
•  Full code coverage
•  Some attribution errors
34
Tracing
•  Record information about significant points (events) during
program execution
•  Save information in event record
o  Timestamp
o  CPU identifier, thread identifier
o  Event type and event-specific information
•  Useful to expose interactions between parallel processes or
threads
Tracing Disadvantages
o  Traces can become very large
o  Instrumentation and tracing add overhead
o  Handle clock synchronization
2/26/2014
35
Performance Analysis Tools
Raj Jain (1991)
“Contrary to common belief, performance evaluation is
an art. ... Like artist, each analyst has a unique style.
Given the sample problem, two analysts may choose
different performance metrics and evaluation
methodologies.”
… but even they need tools!
2/26/2014
36
Outline
1.  Part I
•
•
•
Motivation
Introduction to Computer Architecture
Overview of Performance Analysis techniques
2.  Part II
•
•
Introduction to Hardware Counter Events
PAPI: Access to hardware performance counters
3.  Part III
•
2/26/2014
HPCToolkit: Low overhead, full code profiling using hardware
counters sampling
37
What’s PAPI?
•  Middleware to provide a consistent programming interface for
the performance counter hardware found in most major microprocessors.
•  Countable events are defined in two ways:
•  platform-neutral Preset Events
•  Platform-dependent Native Events
•  Presets can be derived from multiple Native Events
•  All events are referenced by name and collected in EventSets
for sampling
•  Events can be multiplexed if counters are limited
•  Statistical sampling implemented by:
•  Hardware overflow if supported by the platform
•  Software overflow with timer driven sampling
2/26/2014
38
Where’s PAPI
•  PAPI runs on most modern processors and
Operating Systems of interest to HPC:
•  IBM
•  POWER series / AIX
•  POWER series, PowerPC / Linux
•  Blue Gene/L/P/Q
•  Intel / Linux
•  RAPL
•  MIC (Xeon PHI)
•  AMD / Linux
•  Cray / CrayPAT
•  ARM
•  NVIDIA / CUDA
2/26/2014
39
Some tools that use PAPI
•  TAU (U Oregon)
•  http://www.cs.uoregon.edu/research/tau/
•  PerfSuite (NCSA)
•  http://perfsuite.ncsa.uiuc.edu/
•  Scalasca (UTK, FZ Juelich)
•  http://www.fz-juelich.de/jsc/scalasca/
•  Vampir (TUDresden)
•  http://www.vampir.eu/
•  HPCToolkit (Rice Univ.)
•  http://hpctoolkit.org/
•  Open|Speedshop (SGI)
•  http://oss.sgi.com/projects/openspeedshop/
2/26/2014
40
PAPI Counter Interfaces
PAPI provides 3 interfaces to
the underlying counter
hardware:
3rd Party and GUI Tools
Low Level
User API
High Level
User API
1.  A Low Level API manages
hardware events in user defined
groups called EventSets, and
provides access to advanced
features.
PAPI PORTABLE LAYER
2.  A High Level API provides the
ability to start, stop and read
the counters for a specified list
of events.
PAPI HARDWARE SPECIFIC
LAYER
3.  Graphical and end-user tools
provide facile data collection
and visualization.
2/26/2014
Kernel Extension
Operating System
Perf Counter Hardware
41
Component PAPI
Low Level
User API
High Level
User API
PAPI FRAMEWORK
Developer API
PAPI COMPONENT
(NETWORK)
Operating System
Counter Hardware
2/26/2014
Developer API
PAPI COMPONENT
(CPU)
Operating System
Counter Hardware
Developer API
PAPI COMPONENT
(POWER)
Operating System
Counter Hardware
42
PAPI High Level Calls
1.
PAPI_num_counters()
♦
2.
PAPI_flips(float *rtime, float *ptime, long long *flpins, float *mflips)
♦
3.
start counting hardware events
PAPI_stop_counters (long long *values, int array_len)
♦
2/26/2014
copy current counts to array and reset counters
PAPI_start_counters (int *events, int array_len)
♦
8.
add current counts to array and reset counters
PAPI_read_counters (long long *values, int array_len)
♦
7.
gets instructions per cycle, real and processor time
PAPI_accum_counters (long long *values, int array_len)
♦
6.
simplified call to get Mflops/s (floating point operation rate), real and processor time
PAPI_ipc (float *rtime, float *ptime, long long *ins, float *ipc)
♦
5.
simplified call to get Mflips/s (floating point instruction rate), real and processor time
PAPI_flops (float *rtime, float *ptime, long long *flpops, float *mflops)
♦
4.
get the number of hardware counters available on the system
stop counters and return current counts
43
PAPI Low Level Example
#include "papi.h”
#define NUM_EVENTS 2
int Events[NUM_EVENTS]={PAPI_FP_OPS,PAPI_TOT_CYC},
int EventSet;
long long values[NUM_EVENTS];
/* Initialize the Library */
retval = PAPI_library_init (PAPI_VER_CURRENT);
/* Allocate space for the new eventset and do setup */
retval = PAPI_create_eventset (&EventSet);
/* Add Flops and total cycles to the eventset */
retval = PAPI_add_events (&EventSet,Events,NUM_EVENTS);
/* Start the counters */
retval = PAPI_start (EventSet);
do_work(); /* What we want to monitor*/
/*Stop counters and store results in values */
retval = PAPI_stop (EventSet,values);
2/26/2014
44
PAPI_L2_ICH:
PAPI_L2_ICA:
PAPI_L2_ICR:
PAPI_L2_ICW:
PAPI_L2_ICM:
Level 2 instruction cache hits
Level 2 instruction cache accesses
Level 2 instruction cache reads
Level 2 instruction cache writes
Level 2 instruction cache misses
PAPI_L2_TCH:
PAPI_L2_TCA:
PAPI_L2_TCR:
PAPI_L2_TCW:
PAPI_L2_TCM:
Level 2 total cache hits
Level 2 total cache accesses
Level 2 total cache reads
Level 2 total cache writes
Level 2 cache misses
PAPI_L2_LDM:
PAPI_L2_STM:
Level 2 load misses
Level 2 store misses
PAPI Preset Events
•  Preset Events
•  Standard set of over 100 events
for application performance
tuning
•  No standardization of the exact
definition
•  Mapped to either single or linear
combinations of native events on
each platform
•  Use papi_avail utility to see what
preset events are available on a
given platform
Level 3 Cache
PAPI_L3_DCH:
PAPI_L3_DCA:
PAPI_L3_DCR:
PAPI_L3_DCW:
PAPI_L3_DCM:
Level 3 data cache hits
Level 3 data cache accesses
Level 3 data cache reads
Level 3 data cache writes
Level 3 data cache misses
PAPI_L3_ICH:
PAPI_L3_ICA:
PAPI_L3_ICR:
PAPI_L3_ICW:
PAPI_L3_ICM:
Level 3 instruction cache hits
Level 3 instruction cache accesses
Level 3 instruction cache reads
Level 3 instruction cache writes
Level 3 instruction cache misses
PAPI_L3_TCH:
PAPI_L3_TCA:
PAPI_L3_TCR:
PAPI_L3_TCW:
PAPI_L3_TCM:
Level 3 total cache hits
Level 3 total cache accesses
Level 3 total cache reads
Level 3 total cache writes
Level 3 cache misses
PAPI_L3_LDM:
PAPI_L3_STM:
Level 3 load misses
Level 3 store misses
Cache Sharing
2/26/2014
PAPI_CA_SNP:
PAPI_CA_SHR:
PAPI_CA_CLN:
PAPI_CA_INV:
Requests for a snoop
Requests for exclusive access to shared cache line
Requests for exclusive access to clean cache line
Requests for cache line invalidation
45
PAPI Native Events
•  Native Events
•  Any event countable by the CPU
•  Same interface as for preset events
•  Use papi_native_avail utility to see all
available native events
•  Use papi_event_chooser utility to
select a compatible set of events
PRESET,
PAPI_L1_DCH,
DERIVED_SUB,
DATA_CACHE_ACCESSES,
DATA_CACHE_MISSES
2/26/2014
/* 19 */{.pme_name =
"DATA_CACHE_REFILLS_FROM_SYSTEM",
.pme_code = 0x43,
.pme_desc = "Data Cache Refills from
the northbridge",
.pme_flags = PFMLIB_AMD64_UMASK_COMBO,
.pme_numasks = 6,
.pme_umasks = {
{ .pme_uname = "INVALID",
.pme_udesc = "Invalid",
.pme_ucode = 0x01,
},
{ .pme_uname = "SHARED",
.pme_udesc = "Shared",
.pme_ucode = 0x02,
},
{ .pme_uname = "EXCLUSIVE",
.pme_udesc = "Exclusive",
.pme_ucode = 0x04,
},
{ .pme_uname = "OWNED",
.pme_udesc = "Owned",
.pme_ucode = 0x08,
},
{ .pme_uname = "MODIFIED",
.pme_udesc = "Modified",
.pme_ucode = 0x10,
},
{ .pme_uname = "ALL",
.pme_udesc = "All sub-events",
.pme_ucode = 0x1F,
},
},
},
46
How is Implemented?
PMD: AMD, Intel
8 mask bits
8 bits: 256 events
PMC: Intel Pentium II, III, M, Core, i7; AMD Athlon, Opteron
•
•
•
•
2/26/2014
2^32 ~= 4 billion ~= 2 seconds @ 2 GHz
2^40 ~= 500 seconds
2^48 ~= 128,000 seconds ~= 2000 minutes ~= 36 hours
2^64 ~= 96,000 days ~= 260 years
47
How many counters does it take?
100
256 shared
by 4 cores
90
80
70
60
52 shared
by 2 cores
50
40
30
20
2
10
0
4
5
3 fixed
4-32b
4(4) 4:24
7
8-16b
3 fixed 8
6:12
18
m
tiu nium ron
n
PS
I
ell
Pe
Ita Opte
M
C
e2 em
r
x
o
,4
l
e
3
t
C
,6
a
r
5
h
IV
o
R
e
/L
C
E
R
i
m
N
/P
G
E
u
S
W
i
7
B
t
G
i
W
O
n
B
P
PO
Pe
2/26/2014
48
Ivy Bridge Counters
•  3 Fixed Function Counters
•  Unhalted Core Cycles
•  Unhalted Reference Cycles
•  Instructions Retired
•  8 Programmable Counters
•  unless you’re Hyperthreading (4 per thread)
•  or using an NMI watchdog timer (3 per thread)
•  4 Uncore Counters
•  chip wide; not core specific
•  unified cache measurement (L3)
•  shared resources
2/26/2014
49
Useful PAPI Utilities
•  papi_cost
•  papi_avail
•  papi_native_avail
•  papi_event_chooser
•  papi_command_line
2/26/2014
50
PAPI Utilities: papi_cost
$ utils/papi_cost -h
This is the PAPI cost program.
It computes min / max / mean / std. deviation for PAPI start/stop
pairs and for PAPI reads. Usage:
cost [options] [parameters]
cost TESTS_QUIET
Options:
-b BINS
-d
-h
-s
-t THRESHOLD
2/26/2014
set the number of bins for the graphical
distribution of costs. Default: 100
show a graphical distribution of costs
print this help message
show number of iterations above the first
10 std deviations
set the threshold for the number of
iterations. Default: 100,000
51
PAPI Utilities: papi_cost
$ utils/papi_cost
Cost of execution for PAPI start/stop and PAPI read.
This test takes a while. Please be patient...
Performing start/stop test...
Total cost for PAPI_start/stop(2 counters) over 1000000 iterations
min cycles
: 63
max cycles
: 17991
mean cycles : 69.000000
std deviation: 34.035263
Performing start/stop test...
Performing read test...
Total cost for
min cycles
:
max cycles
:
mean cycles :
std deviation:
cost.c
2/26/2014
PAPI_read(2 counters) over 1000000 iterations
288
102429
301.000000
144.694053
PASSED
52
PAPI Utilities: papi_cost
Cost distribution profile
63:**************************** 999969 counts ****************************
153:
243:
[… ]
1683:
1773:
1863:
1953:********************
2043:
2133:********************
2223:
2313:
2403:********************
2493:********************
2583:****************************************
2673:****************************************
2763:****************************************************************************
2853:****************************************
2943:
3033:********************
3123:****************************************
3213:****************************************
3303:
3393:
3483:
3573:
3663:********************
2/26/2014
53
PAPI Utilities: papi_avail
$ utils/papi_avail -h
Usage: utils/papi_avail [options]
Options:
General command options:
-a, --avail
Display only available preset events
-d, --detail Display detailed information about all preset events
-e EVENTNAME Display detail information about specified preset or native event
-h, --help
Print this help message
Event filtering
--br
--cache
--cnd
--fp
--ins
--idl
--l1
--l2
--l3
--mem
--msc
--tlb
options:
Display branch related PAPI preset events
Display cache related PAPI preset events
Display conditional PAPI preset events
Display Floating Point related PAPI preset events
Display instruction related PAPI preset events
Display Stalled or Idle PAPI preset events
Display level 1 cache related PAPI preset events
Display level 2 cache related PAPI preset events
Display level 3 cache related PAPI preset events
Display memory related PAPI preset events
Display miscellaneous PAPI preset events
Display Translation Lookaside Buffer PAPI preset events
This program provides information about PAPI preset and native events.
PAPI preset event filters can be combined in a logical OR.
2/26/2014
54
PAPI Utilities: papi_avail
$ utils/papi_avail
Available events and hardware information.
-------------------------------------------------------------------------------PAPI Version
: 5.1.0.2
Vendor string and code
: AuthenticAMD (2)
Model string and code
: Six-Core AMD Opteron(tm) Processor 8439 SE (8)
CPU Revision
: 0.000000
CPUID Info
: Family: 16 Model: 8 Stepping: 0
CPU Max Megahertz
: 2812
CPU Min Megahertz
: 2812
Hdw Threads per core
: 1
Cores per Socket
: 6
NUMA Nodes
: 8
CPUs per Node
: 6
Total CPUs
: 48
Running in a VM
: no
Number Hardware Counters : 4
Max Multiplex Counters
: 64
-------------------------------------------------------------------------------Name
PAPI_L1_DCM
PAPI_L1_ICM
PAPI_L2_DCM
Code
Avail Deriv Description (Note)
0x80000000 Yes
No
Level 1 data cache misses
0x80000001 Yes
No
Level 1 instruction cache misses
0x80000002 Yes
No
Level 2 data cache misses
[… ]
PAPI_FP_OPS 0x80000066 Yes
No
Floating point operations (Counts speculative adds and
multiplies. Variable and higher than theoretical.)
[… ]
PAPI_REF_CYC 0x8000006b No
No
Reference clock cycles
------------------------------------------------------------------------Of 108 possible events, 40 are available, of which 8 are derived.
avail.c
2/26/2014
PASSED
55
PAPI Utilities: papi_avail
$ utils/papi_avail -a
Available events and hardware information.
--------------------------------------------------------------------------[…]
--------------------------------------------------------------------------The following correspond to fields in the PAPI_event_info_t structure.
Name
Code
Deriv Description (Note)
PAPI_L1_DCM 0x80000000 No
Level 1 data cache misses
PAPI_L1_ICM 0x80000001 No
Level 1 instruction cache misses
PAPI_L2_DCM 0x80000002 No
Level 2 data cache misses
PAPI_L2_ICM 0x80000003 No
Level 2 instruction cache misses
[…]
PAPI_DP_OPS 0x80000068 No
Floating point operations; optimized to count
scaled double precision vector operations
------------------------------------------------------------------------Of 40 available events, 8 are derived.
avail.c
2/26/2014
PASSED
56
PAPI Utilities: papi_avail
$ utils/papi_avail -e PAPI_FP_OPS
Available events and hardware information.
--------------------------------------------------------------------------[…]
--------------------------------------------------------------------------Event name:
PAPI_FP_OPS
Event Code:
0x80000066
Number of Native Events:
1
Short Description:
|FP operations|
Long Description:
|Floating point operations|
Developer's Notes:
||
Derived Type:
|NOT_DERIVED|
Postfix Processing String:
||
Native Code[0]: 0x4000001d |
RETIRED_SSE_OPERATIONS:SINGLE_ADD_SUB_OPS:SINGLE_MUL_OPS:DOUBLE_ADD_SUB_O
PS:DOUBLE_MUL_OPS:OP_TYPE|
Number of Register Values: 0
Native Event Description: |Retired SSE Operations, masks:Single precision
add/subtract ops,Single precision multiply ops,Double precision add/
subtract ops,Double precision multiply ops,Op type: 0=uops. 1=FLOPS|
------------------------------------------------------------------------avail.c
PASSED
2/26/2014
57
PAPI Utilities: papi_native_avail
UNIX> utils/papi_native_avail
Available native events and hardware information.
-------------------------------------------------------------------------------[… ]
===============================================================================
Native Events in Component: perf_events
===============================================================================
| perf::PERF_COUNT_HW_CPU_CYCLES
|
|
PERF_COUNT_HW_CPU_CYCLES
|
-------------------------------------------------------------------------------| perf::CYCLES
|
|
PERF_COUNT_HW_CPU_CYCLES
|
-------------------------------------------------------------------------------[…]
-------------------------------------------------------------------------------| perf::PERF_COUNT_SW_PAGE_FAULTS
|
|
PERF_COUNT_SW_PAGE_FAULTS
|
-------------------------------------------------------------------------------| perf::PERF_COUNT_SW_CONTEXT_SWITCHES
|
|
PERF_COUNT_SW_CONTEXT_SWITCHES
|
-------------------------------------------------------------------------------[… ]
2/26/2014
58
PAPI Utilities: papi_native_avail
-------------------------------------------------------------------------------| DISPATCHED_FPU
|
|
Dispatched FPU Operations
|
|
:OPS_ADD
|
|
Add pipe ops excluding load ops and SSE move ops
|
|
:OPS_MULTIPLY
|
|
Multiply pipe ops excluding load ops and SSE move ops
|
|
:OPS_STORE
|
|
Store pipe ops excluding load ops and SSE move ops
|
|
:OPS_ADD_PIPE_LOAD_OPS
|
|
Add pipe load ops and SSE move ops
|
|
:OPS_MULTIPLY_PIPE_LOAD_OPS
|
|
Multiply pipe load ops and SSE move ops
|
|
:OPS_STORE_PIPE_LOAD_OPS
|
|
Store pipe load ops and SSE move ops
|
|
:ALL
All sub-events selected
|
|
:e=0
edge level
|
|
:i=0
invert
|
|
:c=0
counter-mask in range [0-255]
|
|
:g=0
measure in guest
|
|
:u=0
monitor at user level
|
|
:k=0
monitor at kernel level
|
|
:h=0
monitor at hypervisor level
|
-------------------------------------------------------------------------------2/26/2014
59
PAPI Utilities: papi_native_avail
UNIX> utils/papi_native_avail -e DATA_CACHE_REFILLS
Available native events and hardware information.
-------------------------------------------------------------------------------[…]
-------------------------------------------------------------------------------Event name:
DATA_CACHE_REFILLS
Description:
|Data Cache Refills from L2 or Northbridge|
Unit Masks:
Mask Info:
Mask Info:
Mask Info:
Mask Info:
Mask Info:
Mask Info:
Mask Info:
Mask Info:
Mask Info:
Mask Info:
Mask Info:
Mask Info:
Mask Info:
2/26/2014
|:SYSTEM|Refill from the Northbridge|
|:L2_SHARED|Shared-state line from L2|
|:L2_EXCLUSIVE|Exclusive-state line from L2|
|:L2_OWNED|Owned-state line from L2|
|:L2_MODIFIED|Modified-state line from L2|
|:ALL|All sub-events selected|
|:e=0|edge level|
|:i=0|invert|
|:c=0|counter-mask in range [0-255]|
|:g=0|measure in guest|
|:u=0|monitor at user level|
|:k=0|monitor at kernel level|
|:h=0|monitor at hypervisor level|
60
PAPI Utilities: papi_event_chooser
$ utils/papi_event_chooser
Usage: eventChooser NATIVE|PRESET evt1 evt2 ...
2/26/2014
61
PAPI Utilities: papi_event_chooser
$ utils/papi_event_chooser PRESET PAPI_FP_OPS
Event Chooser: Available events which can be added with given events.
-------------------------------------------------------------------------------[…]
-------------------------------------------------------------------------------Name
Code
Deriv Description (Note)
PAPI_L1_DCM 0x80000000 No
Level 1 data cache misses
PAPI_L1_ICM 0x80000001 No
Level 1 instruction cache misses
PAPI_L2_ICM 0x80000003 No
Level 2 instruction cache misses
[…]
PAPI_L1_DCA 0x80000040 No
Level 1 data cache accesses
PAPI_L2_DCR 0x80000044 No
Level 2 data cache reads
PAPI_L2_DCW 0x80000047 No
Level 2 data cache writes
PAPI_L1_ICA 0x8000004c No
Level 1 instruction cache accesses
PAPI_L2_ICA 0x8000004d No
Level 2 instruction cache accesses
PAPI_L2_TCA 0x80000059 No
Level 2 total cache accesses
PAPI_L2_TCW 0x8000005f No
Level 2 total cache writes
PAPI_FML_INS 0x80000061 No
Floating point multiply instructions
PAPI_FDV_INS 0x80000063 No
Floating point divide instructions
------------------------------------------------------------------------Total events reported: 34
event_chooser.c
PASSED
2/26/2014
62
PAPI Utilities: papi_event_chooser
$ utils/papi_event_chooser PRESET PAPI_FP_OPS PAPI_L1_DCM
Event Chooser: Available events which can be added with given events.
-------------------------------------------------------------------------------[…]
-------------------------------------------------------------------------------Name
Code
Deriv Description (Note)
PAPI_TOT_INS 0x80000032 No
Instructions completed
PAPI_TOT_CYC 0x8000003b No
Total cycles
------------------------------------------------------------------------Total events reported: 2
event_chooser.c
PASSED
2/26/2014
63
PAPI Utilities: papi_event_chooser
$ utils/papi_event_chooser NATIVE RESOURCE_STALLS:LD_ST X87_OPS_RETIRED
INSTRUCTIONS_RETIRED
[…]
-------------------------------------------------------------------------------UNHALTED_CORE_CYCLES
0x40000000
|count core clock cycles whenever the clock signal on the specific core is running (not
halted). Alias to event CPU_CLK_UNHALTED:CORE_P|
|Register Value[0]: 0x20003
Event Selector|
|Register Value[1]: 0x3c
Event Code|
------------------------------------------------------------------------UNHALTED_REFERENCE_CYCLES
0x40000002
|Unhalted reference cycles. Alias to event CPU_CLK_UNHALTED:REF|
|Register Value[0]: 0x40000
Event Selector|
|Register Value[1]: 0x13c
Event Code|
------------------------------------------------------------------------CPU_CLK_UNHALTED
0x40000028
|Core cycles when core is not halted|
|Register Value[0]: 0x60000
Event Selector|
|Register Value[1]: 0x3c
Event Code|
0x40001028 :CORE_P |Core cycles when core is not halted|
0x40008028 :NO_OTHER |Bus cycles when core is active and the other is halted|
------------------------------------------------------------------------Total events reported: 3
event_chooser.c
PASSED
2/26/2014
64
PAPI Utilities: papi_command_line
$ papi_command_line PAPI_FP_OPS
Successfully added: PAPI_FP_OPS
PAPI_FP_OPS :
100000000
---------------------------------Verification: None.
This utility lets you add events from the command line interface to see if they work.
command_line.c
PASSED
$ papi_command_line PAPI_FP_OPS PAPI_L1_DCA
Successfully added: PAPI_FP_OPS
Successfully added: PAPI_L1_DCA
PAPI_FP_OPS :
PAPI_L1_DCA :
100000000
120034404
---------------------------------Verification: None.
This utility lets you add events from the command line interface to see if they work.
command_line.c
PASSED
2/26/2014
65
Performance Measurement Categories
•  Efficiency
•  Instructions per cycle (IPC)
•  Memory bandwidth
•  Caches
•  Data cache misses and miss ratio
•  Instruction cache misses and miss ratio
•  Translation lookaside buffers (TLB)
•  Data TLB misses and miss ratio
•  Instruction TLB misses and miss ratio
•  Control transfers
•  Branch mispredictions
•  Near return mispredictions
•  Special cases
•  Unaligned data access
•  Floating point operations
•  Floating point exceptions
2/26/2014
66
The Code
#define ROWS 1000
// Number of rows in each matrix
#define COLUMNS 1000
// Number of columns in each matrix
void classic_matmul()
{
// Multiply the two matrices
int i, j, k;
for (i = 0; i < ROWS; i++) {
for (j = 0; j < COLUMNS; j++) {
float sum = 0.0;
for (k = 0; k < COLUMNS; k++) {
sum +=
matrix_a[i][k] * matrix_b[k][j];
}
matrix_c[i][j] = sum;
}
}
}
2/26/2014
void interchanged_matmul()
{
// Multiply the two matrices
int i, j, k;
for (i = 0; i < ROWS; i++) {
for (k = 0; k < COLUMNS; k++) {
for (j = 0; j < COLUMNS; j++) {
matrix_c[i][j] +=
matrix_a[i][k] * matrix_b[k][j];
}
}
}
}
// Note that the nesting of the innermost
// loops has been changed. The index variables j
// and k change the most frequently and the access
// pattern through the operand matrices is sequential
// using a small stride (one.) This change improves
// access to memory data through the data cache.
// Data translation lookaside buffer (DTLB) behavior
// is also improved.
67
Performance Data
2/26/2014
68
IPC – instructions per cycle
•  A measure of instruction level parallelism
•  An indicator of code efficiency
retval = PAPI_ipc(&realtime, &processtime, &start_ins, &ipc);
classic_matmul();
retval = PAPI_ipc(&realtime, &processtime, &end_ins, &ipc);
retval = PAPI_stop_counters(NULL, 0));
PAPI_ipc
int events[] = {PAPI_TOT_CYC, PAPI_TOT_INS};
realtime[0] = PAPI_get_real_usec();
retval = PAPI_start_counters(events, 2);
classic_matmul();
retval = PAPI_stop_counters(cvalues, 2);
realtime[1] = PAPI_get_real_usec();
PAPI High Level
int events[] = {PAPI_TOT_CYC, PAPI_TOT_INS};
retval = PAPI_library_init (PAPI_VER_CURRENT);
retval = PAPI_create_eventset(&EventSet);
retval = PAPI_add_events(EventSet, events, 2);
realtime[0] = PAPI_get_real_usec();
retval = PAPI_start(EventSet);
classic_matmul();
retval = PAPI_stop(EventSet, cvalues);
realtime[1] = PAPI_get_real_usec();
2/26/2014
PAPI Low Level
69
IPC – instructions per cycle
Measurement
Classic mat_mul
Reordered mat_mul
============================================================================
PAPI_IPC Test (PAPI_ipc)
Real time
Processor time
IPC
Instructions
13.6093 sec
13.5359 sec
0.3697
9007035063
2.9796 sec
2.9556 sec
1.6936
9009011383
High Level IPC Test (PAPI_{start,stop}_counters)
Real time
13.6106 sec
IPC
0.3697
PAPI_TOT_CYC
24362605525
PAPI_TOT_INS
9007034503
2.9762 sec
1.6939
5318626915
9009011245
Low Level IPC Test (PAPI low level calls)
Real time
13.6113 sec
IPC
0.3697
PAPI_TOT_CYC
24362750167
PAPI_TOT_INS
9007034381
2.9772 sec
1.6933
5320395138
9009011130
•  All three PAPI methods consistent
•  Roughly 460% improvement in reordered code
2/26/2014
70
Data Cache Access
Data Cache Misses can be considered in 3 categories:
•  Compulsory: Occurs on first reference to a data item.
•
•
Capacity: Occurs regardless of cache associativity or line
size, solely due to the finite size of the cache
•
•
•
2/26/2014
Prefetching can hide latency
Larger caches
Improved data locality (tiling / fusion) – effectively lowers working set
Conflict: Misses that could have been avoided with a fullyassociative cache
•
Increase cache associativity
•
Data layout; memory access patterns
71
L1 Data Cache Access
Measurement
Classic mat_mul
Reordered mat_mul
============================================================================
DATA_CACHE_ACCESSES
2002807841
3008528961
DATA_CACHE_REFILLS:L2_MODIFIED:L2_OWNED:L2_EXCLUSIVE:L2_SHARED
205968263
60716301
DATA_CACHE_REFILLS_FROM_SYSTEM:MODIFIED:OWNED:EXCLUSIVE:SHARED
61970925
1950282
---------------------PAPI_L1_DCA
2002808034
3008528895
PAPI_L1_DCM
268010587
62680818
PAPI_TOT_INS
9007034381
9009011130
Data Cache Request Rate
Data Cache Miss Rate
Data Cache Miss Ratio
0.2224 req/inst
0.0298 miss/inst
0.1338 miss/req
0.3339 req/inst
0.0070 miss/inst
0.0208 miss/req
•  Two techniques
–  Using native events
–  Using PAPI presets only
•  ~50% more requests from reordered code
•  1/4 as many misses per instruction
•  1/6 as many misses per request
2/26/2014
72
L1 Instruction Cache Access
Measurement
Classic mat_mul
Reordered mat_mul
============================================================================
PAPI_L1_ICR
INSTRUCTION_CACHE_REFILLS_FROM_L2
INSTRUCTION_CACHE_REFILLS_FROM_SYSTEM
-----------------------------PAPI_L1_ICR
PAPI_L1_ICM
3014322225
22
73
3014205662
3
36
3014322033
60
3014205070
44
Instr Cache Request Rate
Instr Cache Miss Rate
Instr Cache Miss Ratio
0.3347 req/inst
0.0000 miss/inst
0.0000 miss/req
0.3346 req/inst
0.0000 miss/inst
0.0000 miss/req
•  Two techniques, like Data Cache case
•  Using native events
•  Using PAPI presets only
•  Small subroutines fit completely in cache
•  Virtually no misses; pretty boring
2/26/2014
73
L2 Cache Access
Measurement
Classic mat_mul
Reordered mat_mul
============================================================================
Direct L2 Cache Test
REQUESTS_TO_L2:INSTRUCTIONS:DATA:TLB_WALK
1057556622
70996294
62120093
4167947
L2_CACHE_MISS:INSTRUCTIONS:DATA:TLB_WALK
L2 Cache Request Rate
0.1174 req/inst
0.0079 req/inst
L2 Cache Miss Rate
0.0069 miss/inst
0.0005 miss/inst
L2 Cache Miss Ratio
0.0587 miss/req
0.0587 miss/req
-----------------------------Indirect L2 Cache Test
INSTRUCTION_CACHE_REFILLS_FROM_L2
4
0
INSTRUCTION_CACHE_REFILLS_FROM_SYSTEM
30
9
L2_CACHE_MISS:TLB_WALK
260
5438
REQUESTS_TO_L2:TLB_WALK
787632271
803242
DATA_CACHE_REFILLS:L2_SHARED:L2_EXCLUSIVE:L2_OWNED:L2_MODIFIED
205977083
60715886
DATA_CACHE_REFILLS_FROM_SYSTEM:SHARED:EXCLUSIVE:OWNED:MODIFIED
61973057
1950318
L2 Cache Request Rate
L2 Cache Miss Rate
L2 Cache Miss Ratio
2/26/2014
0.1172 req/inst
0.0069 miss/inst
0.0587 miss/req
0.0068 req/inst
0.0002 miss/inst
0.0318 miss/req
74
L2 Cache Access
Measurement
Classic mat_mul
Reordered mat_mul
============================================================================
L2 Cache Request Rate
L2 Cache Miss Rate
L2 Cache Miss Ratio
0.1172 req/inst
0.0069 miss/inst
0.0587 miss/req
L2 Instr Fraction
L2 Data Fraction
L2 TLB Fraction
0.0000
0.2538
0.7462
0.0068 req/inst
0.0002 miss/inst
0.0318 miss/req
0.0000
0.9873
0.0127
L2 cache is unified on Opteron
•  Two techniques:
•
•  First is coarser grained
•  Second provides more detail but requires 7 events (two passes)
•  No major differences for this code
•
L2 requests and misses down dramatically in reordered code
•  Recall, memory accesses are up by 50%
•
2/26/2014
Almost all (98+%) L2 access are for data in reordered code
75
DTLB Access
Measurement
Classic mat_mul
Reordered mat_mul
============================================================================
PAPI_L1_DCA
L1_DTLB_MISS_AND_L2_DTLB_HIT:ALL
L1_DTLB_AND_L2_DTLB_MISS:ALL
PAPI_TOT_INS
2002809207
296943120
783208861
9007034381
3008530341
350824
785470
9009011130
L1 DTLB Request Rate
L1 DTLB Miss Rate
L1 DTLB Miss Ratio
0.2224 req/inst
0.1199 miss/inst
0.5393 miss/req
0.3339 req/inst
0.0001 miss/inst
0.0004 miss/req
L2 DTLB Request Rate
L2 DTLB Miss Rate
L2 DTLB Miss Ratio
0.1199 req/inst
0.0870 miss/inst
0.7251 miss/req
0.0001 req/inst
0.0001 miss/inst
0.6913 miss/req
•
•
•
•
2/26/2014
L1 Data Cache Access == DTLB Access
More L1 accesses in improved code
Dramatically fewer misses
TLB misses can limit fast matrix multiply
76
ITLB Access
Measurement
Classic mat_mul
Reordered mat_mul
============================================================================
PAPI_L1_ICR
L1_ITLB_MISS_AND_L2_ITLB_HIT
L1_ITLB_MISS_AND_L2_ITLB_MISS:ALL
3014320811
4
9
3014204576
1
6
L1 ITLB Request Rate
L1 ITLB Miss Rate
L1 ITLB Miss Ratio
0.3347 req/inst
0.0000 miss/inst
0.0000 miss/req
0.3346 req/inst
0.0000 miss/inst
0.0000 miss/req
L2 ITLB Request Rate
L2 ITLB Miss Rate
L2 ITLB Miss Ratio
0.0000 req/inst
0.0000 miss/inst
0.6923 miss/req
0.0000 req/inst
0.0000 miss/inst
0.8571 miss/req
•  See DTLB…
•  L1 Instruction Cache Reads == ITLB Access
•  Boring…but useful in identifying code layout problems
2/26/2014
77
Branching
Measurement
Classic mat_mul
Reordered mat_mul
============================================================================
PAPI_BR_INS
PAPI_BR_MSP
PAPI_BR_TKN
1001028240
1028256
1000027233
1001006987
1006984
1000005980
Branch Rate
Branch Miss Rate
Branch Miss Ratio
0.1111 br/inst
0.0001 miss/inst
0.0010 miss/br
0.1111 br/inst
0.0001 miss/inst
0.0010 miss/br
Branch Taken Rate
Branch Taken Ratio
Instr / Branch
0.1110 tkn/inst
0.9990 tkn/br
8.9978 inst/br
0.1110 tkn/inst
0.9990 tkn/br
8.9999 inst/br
•
•
•
•
•
2/26/2014
Uses all PAPI Presets!
Branch behavior nearly identical in both codes
Roughly 1 branch every 9 instructions
1 miss per 1000 branches (remember ROWS?)
Branching and branch misses can be reduced with loop unrolling,
loop fusion and function in-lining.
78
Resources
•  Intel Developers Guide, Vol 3B (Chapters 18, 19)
•  http://download.intel.com/products/processor/manual/253669.pdf
•  AMD BIOS and Kernel Developer Guides
•  http://developer.amd.com/resources/documentation-articles/developer-guides-manuals/
•  Performance Analysis Examples
•  http://developer.amd.com/wordpress/media/2012/10/
Basic_Performance_Measurements.pdf
•  http://developer.amd.com/wordpress/media/2012/10/Introduction_to_CodeAnalyst.pdf
•  Performance Tuning of Scientific Applications
•  http://www.amazon.com/Performance-Scientific-Applications-Chapman-Computational/dp/
1439815690
•  http://booksgreatchoice.com/getbook/p236074/
(sign up for a 1 day account for $3.90)
2/26/2014
79
Outline
1.  Part I
•
•
•
Motivation
Introduction to Computer Architecture
Overview of Performance Analysis techniques
2.  Part II
•
•
Introduction to Hardware Counter Events
PAPI: Access to hardware performance counters
3.  Part III
•
2/26/2014
HPCToolkit: Low overhead, full code profiling using hardware
counters sampling
80
Performance Analysis Challenges
•  Complex applications present challenges
•  For measurement and analysis
•  For understanding and tuning
•  PAPI provides instrumentation based interface to
hardware counters
•  Easy to use if
•  Code regions of interest are already known, and
•  In small numbers
81
HPCToolkit Overview
•  Employs binary-level measurement and analysis
•  Observe fully optimized, dynamically linked executions
•  Support multi-lingual codes with external binary-only
libraries
•  Uses sampling-based measurement (avoid
instrumentation)
•  Controllable overhead
•  Full code coverage, avoid blind spots
•  Enable data collection for large-scale parallelism
82
HPCToolkit Overview
•  Collects and correlates multiple derived
performance metrics
•  Diagnosis typically requires more than one species of
metric
•  Associates metrics with both static and dynamic
context
•  Loop nests, procedures, inlined code, calling context
•  Supports top-down performance analysis
•  Natural approach that minimizes burden on developers
83
HPCToolkit Workflow
profile
execution
compile & link
[hpcrun]
app.
source
optimized
binary
binary
analysis
[hpcstruct]
presentation
[hpcviewer/
hpctraceviewer]
84
database
call stack
profile
program
structure
interpret profile
correlate w/ source
[hpcprof/hpcprof-mpi]
HPCToolkit Workflow
profile
execution
compile & link
[hpcrun]
app.
source
optimized
binary
binary
analysis
[hpcstruct]
call stack
profile
program
structure
•  For dynamically-linked executables on stock
Linux
•  compile and link as you usually do: nothing special needed
•  compile code with line mapping information (add flag –g)
presentation
[hpcviewer/
hpctraceviewer]
85
database
interpret profile
correlate w/ source
[hpcprof/hpcprof-mpi]
HPCToolkit Workflow
profile
execution
compile & link
call stack
profile
[hpcrun]
app.
source
optimized
binary
binary
analysis
program
structure
[hpcstruct]
•  Measure execution unobtrusively
•  launch optimized application binaries
•  dynamically-linked applications: launch with hpcrun to
measure
•  collect statistical call path profiles of events of interest
presentation
[hpcviewer/
hpctraceviewer]
86
database
interpret profile
correlate w/ source
[hpcprof/hpcprof-mpi]
HPCToolkit Workflow
profile
execution
compile & link
[hpcrun]
app.
source
optimized
binary
binary
analysis
[hpcstruct]
call stack
profile
program
structure
•  Analyze binary with hpcstruct: recover
program structure
•
•
•
analyze machine code, line map, debugging information
extract loop nesting & identify inlined procedures
map transformed loops and procedures to source
presentation
[hpcviewer/
hpctraceviewer]
87
database
interpret profile
correlate w/ source
[hpcprof/hpcprof-mpi]
HPCToolkit Workflow
profile
execution
compile & link
[hpcrun]
app.
source
optimized
binary
binary
analysis
[hpcstruct]
call stack
profile
program
structure
•  Combine multiple profiles
•
multiple threads; multiple processes; multiple executions
•  Correlate metrics to static & dynamic program
structure
presentation
[hpcviewer/
hpctraceviewer]
88
database
interpret profile
correlate w/ source
[hpcprof/hpcprof-mpi]
HPCToolkit Workflow
profile
execution
compile & link
[hpcrun]
app.
source
optimized
binary
•  Presentation
binary
analysis
[hpcstruct]
call stack
profile
program
structure
•  explore performance data from multiple perspectives
•  sort data by metrics to focus on what’s important
•  compute derived metrics to help gain insight
•  e.g. scalability losses, waste, IPC, bandwidth
presentation
[hpcviewer/
hpctraceviewer]
89
database
interpret profile
correlate w/ source
[hpcprof/hpcprof-mpi]
Using HPCToolkit
•  Add hpctoolkit’s bin directory to your path
•  Download, build and use instructions at http://hpctoolkit.org
•  Installed on newton cluster in “/home/gmarin/HPCToolkit/”
•  Perhaps adjust your compiler flags for your
application
•  most compilers throw away the line map unless -g is on
the command line. add -g flag after any optimization flags
•  Decide what hardware counters to monitor
•  dynamically-linked executables (e.g., Linux)
•  use hpcrun -L to learn about counters available for profiling, or
•  use papi_avail and papi_native_avail
•  you can sample any event listed as “profilable”
90
Using HPCToolkit
•  Profile execution:
•  hpcrun –e <event1@period1> [-e <event2@period2> …] <command>
[command-arguments]
•  Produces one .hpcrun results file per thread
•  Recover program structure
•  hpcstruct <command>
•  Produces one .hpcstruct file containing the loop structure of the binary
•  Correlate measurements with source code
•  hpcprof [–S <hpcstruct_file>] [-M thread] [–o <output_db_name>]
<hpcrun_files>
•  Creates performance database
•  Use hpcviewer to visualize performance results
•  Download hpcviewer for your platform from http://code.google.com/p/
hpcviewer/downloads/list
91
Hands-On Demo
void compute() {!
int i, j, k, r;!
for (i = 0; i < N; i++) !
for (j = 0; j < N; j++) !
for (k = 0; k < N; k++) !
C(i,j) += A(i,k) * B(k,j);!
}!
!
void main() {!
…!
for (i=0 ; i<reps ; ++i) {!
compute();!
if ((i % 2) == 0) !
compute();!
}!
…!
}!
2/26/2014
Two different call sites to the
compute routine
Second call-site executed only
half of the time
92
Hands-On Demo
•  Compiled binary is called matmul!
•  Measure PAPI_TOT_CYC, PAPI_TOT_INS, PAPI_FP_INS
and PAPI_LD_INS!
$ hpcrun -e PAPI_TOT_CYC@6000000 -e PAPI_TOT_INS@6000000 -e
PAPI_FP_INS@2000000 -e PAPI_LD_INS@3000000 -o hpc_matmul ./matmul 500!
•  Recover program structure
$ hpcstruct matmul!
•  Correlate measurements with source code
$ hpcprof -S matmul.hpcstruct -o db_matmul -M thread
hpc_matmul/matmul-000000-000-*.hpcrun !
•  Copy database to local machine
•  Open database in hpcviewer!
93
Analyzing results with hpcviewer!
source pane
costs for
• routines (including inlined)
• loops
• function calls in full context
view control
metric display
navigation pane
94
metric pane
Analyzing results with hpcviewer!
Understand where each routine
is called from.
Apportion costs to each call site.
Callers view
95
Principal Views
•  Calling context tree view - top-down (down the call chain)
•
•
•
associate metrics with each dynamic calling context
high-level, hierarchical view of distribution of costs
example: quantify initialization, solve, post-processing
•  Caller’s view - bottom-up (up the call chain)
•
•
•
apportion a procedure’s metrics to its dynamic calling contexts
understand costs of a procedure called in many places
example: see where MPI_Wait() is called from
•  Flat view - ignores the calling context of each sample
•
•
•
96
aggregate all metrics for a procedure, from any context
attribute costs to loop nests and lines within a procedure
example: assess the overall memory hierarchy performance within a
critical procedure
Compute derived metrics!
Provide a name
… and a formula
Click the f(x) button
97
Compute derived metrics!
98
Pinpointing
Scalability Bottlenecks
2/26/2014
99
The Problem of Scaling
Note: higher is better
2/26/2014
100
Performance Analysis with Expectations
•  You have performance expectations for your parallel code
•  strong scaling: linear speedup
•  weak scaling: constant execution time
•  Put your expectations to work
•  measure performance under different conditions
•  e.g. different levels of parallelism or different inputs
•  express your expectations as an equation
•  compute the deviation from expectations for each calling
context
•  for both inclusive and exclusive costs
•  correlate the metrics with the source code
•  explore the annotated call tree interactively
101
Weak Scaling Analysis for SPMD Codes
Performance expectation for weak scaling
–  work increases linearly with # processors
–  execution time stays constant
C(n q ) = C(n p )
€
102
C(n q ) − C(n p )
X w (n q ) =
Tq
parallel overhead
total time
Strong Scaling Analysis for SPMD Codes
Performance expectation for strong scaling
–  work is constant
–  execution time decreases linearly with # processors
•  Execute code on p and q processors; without loss of generality, p < q
•  Let Ti = total execution time on i processors
•  For corresponding nodes nq and np
•  let C(nq) and C(np) be the costs of nodes nq and np
•  Expectation:
•  Fraction of excess work:
103
qCq (n q ) − pC p (n p ) parallel overhead
X s (C,n q ) =
qTq
total time
Hands-On Demo
•  Using the CG benchmark from the OpenMP version of the
NAS Parallel Benchmark suite 3.3.1
•  Collect time measurements (PAPI_TOT_CYC) for different
process or thread counts, e.g. 2 and 4 threads
•  Produce performance database using data for thread 0 from
both runs
$ hpcprof -S cg.hpcstruct -o db_cgB -M thread hpc_cgB_[24]/
cg.B.x-000000-000-*.hpcrun !
•  Perform differential analysis
•  Compute “scalability loss” metric for both inclusive and
exclusive metrics!
104
CG Time Strong
withscaling
2 and
data4 threads
2-thread run
2/26/2014
4-thread run
105
CG Time with 2 and 4 threads
Compute scalability loss metric
Provide name
… and formula
Display metric as a percentage
2/26/2014
106
CG Time with 2 and 4 threads
Sort by loss (E)
2/26/2014
107
Summary
•  Performance tools help us evaluate application
performance
•  HPCToolkit: low overhead, full-code profiler
•  Uses hardware counter sampling on top of PAPI
•  Maps performance data to functions, loops, calling contexts
•  Intuitive viewer
•  Enables top-down analysis
•  Custom derived metrics enable quick performance analysis
at loop level
•  Differential analysis can identify scalability bottlenecks
108
Documentation
  http://hpctoolkit.org/documentation.html
•  Comprehensive user manual:
  http://hpctoolkit.org/manual/HPCToolkit-users-manual.pdf
•  Quick start guide
•  essential overview that almost fits on one page
•
Using HPCToolkit with statically linked programs
•  a guide for using hpctoolkit on BG/P and Cray XT
•
•
The hpcviewer user interface
Effective strategies for analyzing program performance with HPCToolkit
•  analyzing scalability, waste, multicore performance ...
•
•
HPCToolkit and MPI
HPCToolkit Troubleshooting
•  why don’t I have any source code in the viewer?
•  Installation guide
109