1
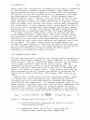
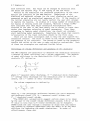
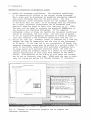
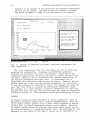
New Directions for Surface Water ModelingÇProceedmœ of the Baltimore Symposium, May
IAHSPubl.no. 181,1989.
EXSRM, an expert system for snowmelt runoff model (SRM)
E. T. Engman and A. Rango
USDA H y d r o l o g y L a b o r a t o r y ,
B e l t s v i l l e , Maryland 20705 USA
J . Martinec
Federal Institute for Snow and Avalanche Research
Davos, Switzerland
ABSTRACT
An expert system is being developed to assist unfamiliar
users to set up and operate a complex model for simulating snowmelt
runoff. The expert system encodes the procedures that experienced
hydrologists use to set up input data, select parameters, and adjust
these values when initial simulations do not match measured data.
The expert system is built around an existing FORTRAN model which is
not changed and does not need to be reprogrammed into a different
computer language.
INTRODUCTION
Hydrological research during the past two decades or so can be
characterized as the era of the computer and with it the development
of a large number of complex simulation models. Many of these
models are based on physical principles and some are spatially distributed in how they represent a complex basin. Still generalizing,
most models have been developed and verified or tested on only one
or a few data sets. Very few models have been subjected to rigorous
testing. The net result of this research has been an increase in
appreciation of understanding the complexity of hydrological
processes in the natural environment but it has not resulted in new
and better tools for practicing hydrologists and engineers.
Few, if any, complex simulation models can be used without
making a number of subjective decisions regarding model set-up and
selection of model parameters. For the most part, the model
developer or one intensively trained in the use of the model will
achieve better results than a new user. Although these models are
intellectually appealing because many are "physically based," they
have not been used much in practice. Studies by Naef (1981) and
Loague & Freeze (1985) demonstrated that the complex models do not
necessarily give better results. Thus, there is little incentive to
assemble the data and to become an expert in use of a given model.
The snowmelt-runoff model (SRM) (Martinec et al., 1983) is such
a model but with a few notable exceptions. First of all, it is
comparatively more simple than many of the models that would fall
under the discussion above. Secondly, it has undergone rigorous
testing for various conditions, sizes of basins and geographic
location. Nevertheless, it is a model that requires a number of
decisions to be made by the user and it is a model with which an
experienced user will achieve better results than the user with
little experience.
Expert systems incorporating the principal components of complex
simulation models may be a viable method for making the models more
usable for practicing hydrologists. Initially, at least, most
417
È. T. Engman et al.
418
models need some "calibration" or modification of inputs, parameters
or coefficients to achieve suitable results. These steps also
require experience with the model to evaluate just how reasonable
the results are and which modifications are necessary to get good
and hydrologlcally reasonable results. A well designed expert
system should be able to assist a user in setting up the data and
other necessary inputs. The expert system can at the very least
guide the user in subjective tasks such as how to subdivide a watershed into model units and help him select initial model parameters
and coefficients. A more advanced expert system should be able to
act on its own to automatically make changes for the most common
discrepancies. It is this area—evaluating model simulations and
improving them by modifying inputs—that this paper addresses.
An expert system is being built around an existing and well
tested FORTRAN snowmelt runoff model. The expert system encodes
the experience of the model developers to assist the new user in
setting up the input data, selecting parameters and coefficients,
and adjusting these values when simulated and measured runoff data
do not match. The expert system guides an inexperienced user
through the same sequence of steps that the model developers would
use in a similar application. This paper discusses the design and
strategy for developing an expert system for SRM to assist
nonexperts in successfully using the model.
THE SNOWMELT-RUNOFF MODEL
SRM has been developed to simulate and forecast daily streamflow in
mountain basins where snowmelt is a major component of the annual
water balance. SRM is a degree-day model that uses the percentage
of the basin covered by snow as the primary input. SRM was
developed by Martinec (1975) for small European basins. With the
advent of satellite snow-cover data in the 1970's, the model was
shown to be usable in larger basins. Using Landsat data, SRM has
been successfully run for various size basins in Europe and the
United States (Rango & Martinec, 1979; Rango, 1980; Jones et al.,
1981).
Applications of SRM usually involve simulating snowmelt runoff
for basins with some hydrological data, specifically measured
discharge and one or more meteorological stations that measure
precipitation and temperature. The minimum required inputs to the
model consist of periodic snow cover area and daily temperature and
precipitation. Each day during the snowmelt season, the water
produced from snowmelt is computed, superimposed on the recession
flow to yield the total basin discharge according to Equation (1).
Q ,, = c [a (T + A T )S + P ] k'^/,Qrà
x
n+l
n l n n
n n
nJ 86400
(1-k ,,)+Q k ,,
n+1 x n n+1
where Q = average daily discharge in m-'s--'c
=
runoff coefficient expressing the losses as a ratio
(runoff/precipitation).
a = degree-day factor (cm - °C -1 'd~l) indicating the
snowmelt depth resulting from 1 degree-day.
(1)
419
EXSRM, an expert system for snowmelt runoff model
T = number of degree-days ( ° O d ) .
AT = the adjustment by temperature lapse rate necessary
because of the altitude difference between the
temperature station and the average hypsometric
elevation of the basin or zone.
S = ratio of the snow-covered area to the total area.
P
=
precipitation contributing to runoff (cm). A preselected
threshold temperature, T Q J J J , determines whether this
contribution is rainfall and immediate.
A = area of the basin or zone in m^.
0.01 _
.
2,-1 _
3 _n
c
86400
conversion from cm'm d
to m - s ±
k - recession coefficient indicating the decline of discharge
in a period without snowmelt or rainfall:
n = sequence of days during the discharge computation period.
There are a number of steps a user must take before the model
can be run. The user must determine the physical characteristics
of the basin and select the model variables and parameters. After
the basin boundary has been defined by the streamgage site, the
basin must be subdivided into elevation zones separated by about
500 meters. The elevation zones are created in recognition that
snowmelt is very elevation dependent and thus the model is applied
to each of the zones to spatially distribute the rate of snowmelt.
A hypsometric curve is developed for the basin and the mean
elevation for each zone determined graphically.
Input data to the model are air temperature, precipitation, and
snow cover area. Ideally, temperature and precipitation would be
measured within the basin and at each mean hypsometric elevation
for each zone. Seldom is this the case in real basins. Usually
these data must be extrapolated from one or more stations, some of
which may not be in the basin.
Snow cover area is used to determine where snowmelt can
potentially occur and where certain algorithms unique to snow
coverage should be applied. Usually the snow cover data are
planimetered from remote sensing satellite data, and the individual
measurements are used to construct snow-cover depletion curves for
each elevation zone of the basin.
Model parameters include a runoff coefficient, a degree day
factor, a recession coefficient, and a time lag. Each of these can
be chosen and modified by the user to adjust the simulation results.
The model is set up with default values and the user's manual
(Martinec et al., 1983) describes how the choices should be made.
Typical applications usually require several iterations that
involve changes in parameters or how the basin has been subdivided
into equal elevation zones. Depending on how good the initial
simulations were and what type of discrepancies exist between the
measured and simulated hydrographs, the user chooses different
strategies to improve the simulations. It is during these
iterations that the experienced user works with a sequential plan
based on accumulated knowledge whereas the inexperienced user will
resort to a trial and error strategy.
E. T. Engman et al.
420
EXPERT SYSTEM STRATEGY
Figure 1 is a schematic illustrating the various parts of the expert
system used to set up and run the simulation model. Building the
expert system around the existing FORTRAN model allows one to get
up and running in a relatively short time. An advantage to this
strategy is that parts of the expert system can be implemented as
they are developed. Each increment, such as an interactive
graphics procedure for determining the recession constant, can be
added as it is completed and tested immediately. An additional
advantage to this approach is that verification and validation
(Geissman & Schultz, 1988) of the expert system is simplified.
Comparison with known simulation results validates the performance
of the expert system.
EXSRM is the expert system incorporating SRM to assist an
unfamiliar user to set up and run the simulation model. At the
front end of EXSRM a series of help windows and mousable menus
assist the user in setting up the model and loading the hydrologie
and climatological data. Default values are displayed and choices
(such as output options) can be made simply by mousing to that item
and "clicking" it over to the alternative choice. These options
are illustrated in Fig. 2. Under the SRM Parameters window the
current choice is indicated by bold print. This can be changed by
moving the mouse to the light print and clicking the mouse button.
The different model variables can be edited by first choosing
the specific variable from the menus in the Message window. For
example, to change the rainfall runoff coefficient, one would use
the data point editor which displays the existing CR values for
Fig. 1. Schematic of the expert system and its interaction with
mainframe computer and the FORTRAN simulation model.
421
EXSRM, an expert system for snowmelt runoff model
SRM Parameters
Top
-Labeling Optic
liane of Basin
VearHunber of 2on
Model Run Hun
Model Run Opti.
Mode
Starting Month
Ending Month
1180.8
Elevation of Base Station
Input Data Units
Metric English
Rctual Runoff Data
Exists Does not exist
Precipitation Data
By Zone Not By Zone
By Zone Not By Zone
Runoff Coefficients
Print Input Data
Yes No
Print Runoff Data
Plot Computed Us. Actual Runoff
Echo to PrinterTenperature Optic
>SRM-Rel-?>Bas' ns>DUMMV BPSIfi
1982.Bas
>SRM-Rel-7>Bas ns>FELSBERG BASIN
1982.Bas
>SRM-Rel-?>Bas' , >nadis<
verl9?8.basir
>SRtt-Rel-?>Bas
;>nadisi
verl9?6.basin.:
>SRM-Rel-?>Bas
,>nadisi
ver
1978.bas
• >kabul
1976.bas>SRM-Rel~?>Bas
>SRM~ReW>Bas
>9arbagel9?6.ba:
>SRM~Rel-7>Bas
>felsberg82.bas
>SRM-Rel-?>
>boise riverl978.bas
.1
>SRM-Rel-?>
>boise river
1978.b,
More be tow
Exit
D
are now pointing at the Help uindou.
Here, Help information about Ex-SRM is c
updated.
Effective Mouse Clicks:
Right Button - Pop up a Menu of Options.
E*-SRH Qptii
Execute SRM with current data
View Current Plots
(Edit Ivjariabîësl
Calculate Recession Constant
Edit Curves
Print Runoff Plots
Save Current Data to Disk
Run Ex-SRM Map Handler
Exit EX-SRM
^^*M^3*^Ss*«-îîï*î«^aî&*ffi»fe!aasfe*iasSJ
F i g . 2. Monitor showing user options on menu-choice i s to "Edit
Variables."
Uindou Systeri
Edit
by
ng V a r i a b l e
Ronan
CR
Of Zone
C
For
Basin
Ex-SRM TUr.a P o i n t E d i t o r
FELS8ERG BFlSIM
firea:
8.60
0 m
em
a 60
e fin
e fin
21
22
23
a 50
98
0 98
0 98
0 98
31
0 6G
19
0
0
0
8
0
0
8
8
8
0
G
Q
8
8
8
8
0
0
0
0
0
0
0
0
fV'Vii-H^lfliViiLv
[Thu 22 Sep 12:49:59]
Fig. 3.
values.
fin
fin
fin
fin
fin
fin
fin
fin
fin
fin
fin
fin
68
68
t>8 R e f r e s h !
68
Select 1
68
60
60
60
60
60
60
60
ES |
Rugust
Jul,
June
«.y
April
0.60
0 60
0 60
B 60
6 60
8 60
8 60
8 68
8 68
8 68
8 68
0 60
8
8
0
0
0
0
0
B
0
B
0
0
0
0
0
6
0 60
8 60
8 60
68
60
60
60
60
60
60
60
60
66
8 68
8 68
0
60
60
60
60
8 60
iîkiÀÛÊÊïÊÊWIÊÊBËÈÈÊÊÈ
sterbenz
Tabular runoff c o e f f i c i e n t s
0.68
0.60
0 68
0 60
0 60
0 60
8 60
8 68
8 68
0 68
0 68
0 68
0 68
8 68
8 68
8 68
8 68
8 60
0 60
0 68
0 68
for e d i t i n g by typing in new
E. T. Engman et al.
All
each elevation zone. Any value can be changed by selection with
the mouse and options (Fig. 3) and typing in the new value.
Results of the simulation are presented graphically on the color
monitor and tabularly on the B&W monitor. Comparisons of the
simulated and.measured volumes for the total simulation period are
presented as well as statistical measures of fit. If the results of
the initial simulation are not nearly perfect the user will attempt
to improve the results. In studies of a large number of simulations
for basins of varying sizes and climates, Martinec & Rango (1986)
have concluded that when major simulation discrepancies have
occurred in the past it has been mostly due to errors in input data
rather than improper selection of model parameters. Thus, when
attempting to improve model simulations, one should not randomly
start modifying model parameters. Experience has shown that careful
re-evaluation of the input variables should be the first step.
There are two basic strategies used to help the user improve his
simulation results. The first is based on the volume difference and
the goodness of fit statistic. The second is based on the graphical
results and relies on the user to make subjective evaluations. Each
of these two strategies are explored further below.
Percentage of volume difference and goodness of fit statistic
The SRM computes two statistics to describe the simulation accuracy:
a measure of model efficiency and a volume comparison. The measure
of model efficiency is the Nash-Sutcliffe (1970) goodness of fit
statistic R~, defined as
n
2
R
' 2
(Q. - QJ 2
= l_i=i
n
I
i=l
(2)
-2
(Q. - Q)
1
where Q = measured daily discharge, Q' - simulated daily discharge,
Q = average daily discharge for the simulation year or simulation
season, and n = number of daily discharge values.
The volume comparison is defined by
D
V - V
R
= -1
V
R
. 100
(3)
where D y = the percentage difference between the total measured
and simulated runoff (%); V R = measured runoff volume; and
V
= simulated runoff volume.
The EXSRM will automatically suggest certain steps to be taken
by the user if the runoff volume difference exceeds ±5% or if the
R^ value is less than 0.75 (these thresholds can be changed).
EXSRM leads the user through a sequence of steps that the expert
has learned by repeated experience with the model to be the most
efficient for improving the model simulations. In order of
effectiveness, these are:
EXSRM, an expert system for snowmelt runoff model
Re-evaluate the snow cover depletion curves. The snow-cover
variable, S, of an elevation zone or basin is usually obtained
from a variety of sources of snow-cover data including ground
observations, aircraft photography, and satellite imagery.
These data should be rechecked for possible interpretation
errors. EXSRM graphically displays the depletion curve for
each elevation zone. The user can redraw the curve by tracing
a new curve with the mouse and these points are automatically
inserted in place of the previous curves points. EXSRM can
then be rerun to get a new simulation. Instructions for
evaluating the curves and for making changes are given in an
accompanying window.
Reconsider the lapse rate. The calculated degree-day values
must be extrapolated from a base station to each elevation zone
using a suitable lapse rate. The temperature lapse rate must be
carefully determined, especially if the observation station is
situated at a low altitude and the extrapolation of degree-days
is made in only one direction (upwards). Instructions are
provided in a window for evaluating the lapse rate and if
simulations have previously been made for the subject basin,
the user can examine these values.
Adjust the runoff coefficient. The model requires a runoff
coefficient, c, that is a ratio of runoff to precipitation.
Because the runoff coefficient is likely to vary throughout the
year as a result of changing vegetation and soil moisture
conditions, the SRM computer program permits changes in c every
15 days. Usually, c is higher for snowmelt than for rainfall.
Therefore, the model can handle different runoff coefficients
for snow, eg, and for rain, cg_, as determined by the user
(Fig. 3 ) .
Reconsider the degree-day factor. The degree-day factor is
used to convert degree-days to snowmelt expressed in depth of
water. In the absence of detailed temperature and snow pillow
or lysimeter data, the degree-day factor can be obtained from
an empirical equation developed by Martinec (1980). The effect
is similar to 2, above.
Evaluate the precipitation input data. Measurement of
representative precipitation amounts in a mountain basin is
extremely difficult. Extrapolation of precipitation amounts
from one or more base stations to zones in the basin must be
based on user knowledge of the study area. Errors in precipitation data may result in volume errors as well as errors in the
peak discharge. If precipitation is determined to fall in the
basin on a given day, a critical temperature, TcRIT» m u s t lDe
examined to determine whether the precipitation is rain or snow.
•^CRIT i-s usually selected to be slightly above the freezing
point and may vary from basin to basin. The distinction between
rain and snow is important in SRM because the rain contribution
to runoff is on the same day that the rain occurs, whereas the
snow contribution to runoff is delayed. Evaluation suggestions
are given in instruction windows and modifications can be
implemented with the data point editor.
E. T. Engman et al.
424
Subjective evaluation of graphical output
Modify the recession coefficient. The recession coefficient,
k, is exponentially related to the current stream discharge.
The k value must be determined by graphical procedures computed
from daily discharge data for the given basin. For this
determination, daily discharge values for the snowmelt season
or the whole year are used. If no discharge data are available
for a basin, recession coefficients can be estimated from
empirical formulas based on basin size (Martinec et al., 1983).
The user will be asked to evaluate the graphical comparison of
the measured and simulated hydrograph. If the computed
hydrograph arises or drops too rapidly the recession coefficient
should be increased, and vice versa. The user will be guided
to use an interactive graphical procedure to redraw an envelope
line that computes a new recession coefficient (see Fig. 4 ) .
Modify the time lag. Snowmelt runoff is computed for a time lag
between the rise in temperature and the rise of the hydrograph
of 18 hours. If the time lag is not conveniently 18 hours, the
computed discharge values must be shifted by a certain number of
hours to facilitate comparison with published streamflow data.
In large basins with multiple elevation zones, the time lag
changes during the snowmelt season as a result of the changing
spatial distribution of snow cover with respect to the basin
outlet. Discrepancies in the timing of flow peaks and troughs
may be due to incorrect time lags. EXSKM asks the user to evaluate the timing and guides him through changes, if necessary.
Recession Constants
This is a Log-Log plot.
Using Metric units.
f^NÉU'ÊSt/im^
.. 5
EïatlseHosER);:;
H
•'
EîRLtt
S
^
R
O
E
-•<*
/
-
• : <
•£>
Qn*l
REDRAW
REPLACE
y
s
s
xteûEH
-
INSTRUCTIONS FOR DRRUING RECESSION LIME
Moue the nouse pointer to a point that locates
the louer end of the recession line.
encra Press the Left nouse button to set the lower
left point for the recession line.
Moue the nouse pointer to a point that locates
the upper end of the line.
Press the Center nouse button to set the upper
right point and drau the line.
fn-re' Press the Right nouse button.
REQRRH
lets you do it all over again.
REPIRCE updates the data constants.
RBORT
returns to nain window (no update).
S
er-3 7.
2
3
4
5
6 '
real H
HELP HINDOU
DISCHARGE Q n
1.1613917.
. -S.13812153.I
[Thu 22 Sep 12:4U:16] sterben;
Fig. 4. Example of interactive graphics use to compute new
recession constants.
EXSRM, an expert system for snowmelt runoff model
425
Figure 5 is an example of the simulated and measured hydrographs
plotted on the screen. The user is able to visually evaluate
the match of peaks to judge if the lag needs to be changed.
Window S y s t e n b y Reman
x\\'.-.-'-.'vV.SBM-.--P«rr«Wè'te>r»\--^V->\-..^.-..'-\-./.V-.'-
•:
« » s
Snowmelt R u n o f f
fïà'rtfi
•tëvc
Horib
Wo'ds
FELSBERG BASIN
Solid
È'rvd-ï
:£;i:«V
1982
Run number
•$f;6£fti;9^^^
==> Measured data
Dotted ==> Computed data
ïrip'ij
ftijnn
.Echo
C
1000
b
900
c
8°°
m
7Û0
t
600
e
500
s
400
P
e
r
300
s
e
c
0
This graph w i l l be sent to the
Laser P r i n t e r .
Ej
1
I f you do not wish t o p r i n t t h i s H
graph, then c l i c k on ABORT.
|
I f you c l i c k on SEMD, ther the
graph u i l l be p r i n t e d .
Hjk
200
100
The p r i n t e r takes a long t i n e
t o process the data. Expect a
delay (roughly 3 n i n u t e s ) .
•
=a^
Hindou 24
0
0
30
d
60
90
T I M E (days)
120
150
;;^ttôl^-fh;9;;!;i'M'\t;b^
Hindou 25
lill M ^ ^ ^ k » ®
?«««*
[Thu 22 Sep 11:34:151 sterbenz
Fig. 5. Example of measured and model simulated hydrographs for
user comparison.
The trial simulations that the user makes can all be saved and
recalled for examination. Likewise, the different graphical
displays can be buried and later redisplayed. Rapid recall and
comparison capabilities allow the new user to become familiar with
the model operation and to understand the relative sensitivity of
the various parameters and input data. It encourages him to
experiment with different combinations of inputs. However, buried
within EXSRM are limits for the various parameters and variables.
If the user chooses an unrealistic value, the program will warn the
user that this value is outside the physically reasonable range.
For example, if a user chooses a critical temperature of -10°C the
program will warn the user and indicate what the range of physically
acceptable values is. This prevents random and meaningless fitting.
SUMMARY
An expert system has been developed to assist unfamiliar users in
simulating snowmelt runoff with a complex FORTRAN model. This use
of an expert system appears to be a very useful approach to making
complex data intensive simulation models easily usable. Building
an expert system around an existing simulation model allows one to
get up-and-running in a relatively short time. An advantage to this
approach is that parts of the expert system can be implemented as
11
E. T. Engman et al.
426
they are completed without affecting the model operation. Since the
FORTRAN code itself is not changed, historic inputs and parameter
estimation can be mixed with the expert system developed inputs and
parameters. Thus, as the expert system grows, it encompasses more
of the heuristics that an experienced operator would use to get good
results.
Extending this thought a step further, the expert system will be
able to "learn" from experience. The role of snowmelt forecasting
is to forecast runoff for a specific basin year after year. Extreme
events usually cause the forecaster problems because his experience
had not previously encountered such events. The expert system would
behave similarly; thus, it would not be able to do better than the
experienced forecaster for the unusual events. However, the expert
system should be able to "remember" these events by storing them in
the knowledge base. Once in the knowledge base, it should be able
to profit from this when a new event, some time in the future, has
data characteristics that indicate it may be unusual.
REFERENCES
Geissman, J. R. & Schultz, R. D. (1988) Verification and validation
of expert systems. AI Expert 3(2):26-33.
Jones, E. B., Shafer, B. A., Rango, A. & Frick, D. M. (1981)
Application of a snowmelt model to two drainage basins in
Colorado. Proc. 49th Annual Western Snow Conference,
St. George, Utah, 43-54.
Loague, K. M. & Freeze, R. A. (1985) A comparison of
rainfall-runoff modeling techniques on small upland watersheds.
Water Resour. Res. 21(2):229-248.
Martinec, J. (1975) Snowmelt-runoff model for streamflow forecasts.
Nordic Hydrol. _6(3):145-154.
Martinec, J. (1980) Hydrologie basin models. In: Remote Sensing
Applications in Agriculture and Hydrology, Fraysee, G., editor,
A. A. Balkema, Rotterdam, 447-459.
Martinec, J., Rango, A. & Major, E. (1983) The Snowmelt-Runoff
Model (SRM) User's Manual. NASA Reference Publ. 1100,
Washington, D.C., 118 pp.
Martinec, J. & Rango, A. (1986) Parameter values for snowmelt runoff
modeling. J. Hydrol. 84, 197-219.
Naef, F. (1981) Can we model the rainfall-runoff process today?.
Hydrol. Sci. Bull. .26(3), 281-289.
Rango, A. (1980) Remote sensing of snow covered area for runoff
modelling. Hydrological Forecasting (Proc. Oxford Symposium),
IAHS Publ. no. 129, Oxford, U.K., 291-297.
Rango, A. & Martinec, J. (1979) Application of a snowmelt-runoff
model using Landsat data. Nordic Hydrol. _10(4), 225-238.