1
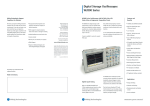
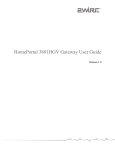
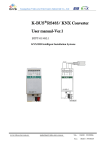
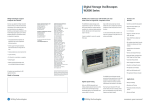
Preliminary Study on Power Consumption of
Typical Home Network Devices
Thuy Nguyen, Adam Black
Centre for Advanced Internet Architectures, Technical Report 071011A
Swinburne University of Technology
Melbourne, Australia
[email protected], [email protected]
Abstract—This document reports on our preliminary
study of the power consumption of typical household
networking equipment under different operational modes.
Three ADSL modems are studied: Cisco 837, Linksys
AG041 and Linksys WAG54G. We consider each modem’s
power consumption when it is being in the Minimum
Load (powered on with no physical ADSL/Ethernet connections), Idle (powered on with ADSL/Ethernet connection
but no user-ininitated traffic) and Loaded (with a high
packet per second link load and loaded NAT table).
For the ADSL/Wireless Linksys WAG54G modem, we
also consider its power consumption when receiving and
transmitting packets.
In the Minimum Load, the Linksys AG041 consumes
the most power, followed by the Cisco 837. The Linksys
WAG54G consumes the least power. A loaded link tends to
increase the power consumption of the Cisco 837 modem,
and reduce that of the two Linksys modems compared
to the Idle state. Loaded NAT tables increase the power
consumption of the two Linksys modems, yet slightly
reduce that of the Cisco 837. Transmitting using the
wireless interface of the Linksys WAG54G with a high bit
rate consumes significantly greater power than receiving
traffic.
Also in this document, our test methodologies, testbed
setup, equipment specifications and equipment calibration
are described.
I. I NTRODUCTION
The Internet has been growing very fast over the years
with increases not only in the number of its users, hosts
and servers, networks and autonomous systems, but also
in volume and types of traffic. Traditional Internet applications, such as electronic mail, file transfer, and staticcontent web sites, are being joined by newer services
such as IP telephony, real-time interactive audio and
video conferencing, streaming of multimedia content,
online games, and electronic commerce. This creates a
wide range of household and business Internet uses. This
CAIA Technical Report 071011A
expanding trend is driven further by the rapid development of computing and communications in portable
forms (e.g. laptop computers, PDAs, cellular phones),
along with new modes of Internet access (e.g. from
dial-up to broadband to possible optical access networks
in the future), which potentially will spawn more new
applications and services.
However, this rapid development raises an issue of
the energy consumed to power the Internet. Roth et al.
[1] studied the annual electricity consumption of nonresidential office and telecommunications equipment in
the U.S. The study found that the office and telecommunications equipment consumed up to 97TWh of electricity in 2000, and the key IT equipment (personal computers and their monitors, server computers, computer
networks, telephone networks, and UPSs) accounted
for more than 70% of the total. It is estimated that
the Internet could cause from 2% to 5% of Germany
electricity consumption in 2010 [2]. IT equipment also
consumes about $6 billion of electricity every year for
the U.S. [3].
While most previous work focuses on measuring energy consumption for non-residential networking devices
(e.g [4] [1]), there have not been many studies focusing
on the actual energy consumption of household networking equipment. Over the last few years, we have
witnessed the rapid penetration of broadband residential
Internet services. Subscriptions to broadband Internet
services rose 20% in 2006 to exceed 50 million US
households. It is estimated that the trend will continue
to surpass 60 million households by the end of 2007,
accounting for 55% of all US households [5]. South
Korea became one of the worlds broadband leader with
67% of household having broadband Internet access in
2002 [6]. Similar broadband penetration trends have been
seen in many other countries (e.g. China, France, Japan
[7]).
October 2007
page 1 of 17
In this study we focus on exploring the power consumption characteristics of some common consumer networking devices, especially ADSL modems and 802.11
wireless LAN devices. We’re looking at how energy
efficient these devices are, considering that they are being
used by millions of households around the world, and
typically left powered on 24x7. We are also interested in
whether different network usage patterns cause changes
in the power consumption of these devices. Examples of
different network scenarios include when the device is
at Minimum Load, Idle or Loaded - with high link load
in terms of packet rate and loaded NAT table - and when
the wireless modem transmitting or receiving traffic over
the wireless interface.
This document provides a summary of our studies
so far, including: problem definition, test methodologies, description of different test scenarios and expected
outcomes, actual test outcomes with our analysis and
critique. Finally we provide recommendations on similar/related studies in the future.
The rest of the report is organised as follows. Section II provides the definition of the ‘problem’ for our
studies. It outlines the aims of our measurements and
briefly describes different test scenarios and the expected
outcomes. Section III describes our test methodologies,
testbed setup, equipment specifications and equipment
calibration. Section IV reports on the results of our
preliminary studies, together with our analysis and discussion. Section V concludes the report with some final
remarks.
II. P ROBLEM D EFINITION
In this study we focus on two ADSL (Cisco 837
and Linksys AG041) and one wireless ADSL modem
(Linksys WAG54G). (Some background information on
the ADSL and 802.11 wireless technologies are presented in Appendix A). We monitor the power consumptions of these devices in different operational modes:
Minimum Load, Idle and Loaded (in terms of link
load and NAT table). For the Linksys WAG54G the
power consumption of transmitting and receiving phases
over the wireless interface are studied. Our experimental
scenarios are described as follows:
B. Scenario 2: Idle/Loaded with high packets per second
(PPS) rate)
An efficient device should consume energy proportionally to its output or utilities [3]. Thus an idle or
lightly utilized device should not consume the same
energy as when it is highly utilised.
The Idle state of a modem is defined as the modem
is powered on, with physical wires plugged into one
Ethernet and ADSL ports of the modem, and without
any user-initiated traffic.
Loaded state of a modem is defined as the modem is
pushed to the maximum capacity, in terms of packet rate
in this scenario, it needs to process.
In this scenario, we compare each modem’s power
consumption in these two cases. It is expected that the
higher the data rate, the greater the processing load
to the modem, and hence possibly the greater power
consumption.
C. Scenario 3: Minimum/Loaded NAT table lookup
This test considers the scenario when the consumer’s
device has to perform NAT table lookup for data processing.
We consider two variants of the scenario:
•
•
First, the modem transmits data from a single traffic
flow (one pair of source and destination IP addresses) with minimum NAT/port forwarding setup.
Second, the modem transmits data from a single
traffic flow (one pair of source and destination IP
addresses) with large amount of NAT entries in the
NAT table.
The device’s power consumption of these two scenarios are compared.
D. Scenario 4: Transmitting/Receiving traffic through
the wireless interface
With wireless devices, transmitting traffic may require greater power than receiving traffic. We study the
differences in the power consumption of the transmitting/receiving phases of the Linksys WAG54G modem.
A. Scenario 1: Minimum Load
III. T EST M ETHODOLOGY
This is one of the extreme cases - when the test modem
is powered on with no physical ADSL or Ethernet
connections (no physical wires plugged into the Ethernet
and ADSL ports of the modem).
CAIA Technical Report 071011A
In this section, we describe our test methodologies,
experimental testbed setup, equipment specifications and
calibration for our particular test purposes.
October 2007
page 2 of 17
A. Measurement methodology and testbed setup
To measure the power consumption of each modem,
we use a simple testbed as illustrated in Figure 1. A small
resistor is inserted in the middle of the power source
and the device to allow the (indirect) measurement of
the current drawn by the Device Under Test (DUT). The
resistor should be chosen with small value of resistance
and relatively high power rating. This is to ensure that
only small amount of voltage would be dropped between
V1 and V2. This is to ensure an adequate voltage is
supplied to the modem.
PSTN
ADSL
Modem
CPE
R
+ V2
200
samples
200
samples
200
samples
200
samples
V1
V2
0
2
P=
TABLE I
C OMPONENT S PECIFICATIONS
(V1-V2)*V2
R
GND
Testbed Layout
The power drawn by the DUT is calculated using
Equation 1:
(V 1 − V 2) × (V 2)
(1)
R
The challenge of monitoring P in realtime become the
challenge of monitoring V1 and V2 in realtime. This can
be done by using a digital oscilloscope. For example, the
digital TDS2014 oscilloscope allows remote control using a computer connected to the oscilloscope via a serial
RS232 cable. V1 and V2 can be sampled simultaneously
in realtime with small sampling interval.
A limitation of the TDS2014 oscilloscope is that it
only allows a maximum of 2500 samples for each data
query (per channel). To monitor V1 and V2 over a
long time with fine grain sample interval, we use the
following sampling method. For each data query we
collect 200 sample points with sampling interval of
0.1 millisecond. Then wait for 2 seconds to repeat the
process. The 2 seconds gap is to ensure the sample block
has been successfully transmitted from the oscilloscope
to the monitoring computer via a serial connection. This
sampling method is illustrated in Figure 2.
Substituting the corresponding pair of voltage sample points (V1 and V2) into equation 1 gives us the
instantenous power consumption of the DUT for each
sample. The average power consumption of the DUT
is calculated from the median value of all instantenous
power measurements of each sample block.
Component
Digital Storage
Oscilloscope
(DSO) Tektronix
TDS2014
Specifications
•
•
•
•
•
P =
CAIA Technical Report 071011A
Data Logger Method
B. Equipment Specifications
Power
Source
CH1
Time
(second)
4
Fig. 2.
Server
V1
CH2
Fig. 1.
200
samples
Table I gives a summary of equipment’s specification
used in our testbed.
DSLAM
-
TDS2014
Osilloscope
200
samples
Resistor
Power
Supply
Unit
(PSU)
Instek
GPC1850D
4 channels
8 bit ADC
2mV to 5V/div vertical sensitivity
±3% DC vertical accuracy (may vary with
different settings [8])
Record length 2.5K samples
1 Ohm with power rating of 2W
•
•
Two 3 1/2 Digit 0.5 inch LED Displays
switchable between voltage and current
Accuracy + (0.5% of readings + 2 digits)
DUT
•
•
•
Monitoring
(CPE)
Cisco ADSL 837 modem (18VDC 1A)
Linksys AG401 ADSL modem (12VDC
1A)
Linksys WAG54G ADSL/Wireless modem
(12VDC 1A)
PC
•
•
•
•
•
Intel Pentium 4 3.00GHz with HyperThreading
1GB (2 x 512MB) DDR2 533 RAM
Seagate ST380817AS 80GB SATA HDD
Asus P5LD2-VM motherboard
Running FreeBSD 6.1
Server PC
October 2007
•
•
•
•
Intel Celeron 2.4GHz (400) Single Processor
ASUS P4P800VM ATX Motherboard
256MB PC3200 DDRAM High Speed
Memory
Running FreeBSD 5.3
page 3 of 17
C. Equipment Calibrations
The accuracy for our experimental measurements are
constrained by a number of factors:
• Noise generated by the cables used for measurements.
• Error of the TDS2014 in general and Error for each
channel used to measure V1 and V2 in realtime.
• Uncertainty of the resistor’s value.
• Behaviours of DUT’s power plug pack over time.
The following subsections summarise the results of
our equipment calibration.
1) Cable calibration: To measure voltages (V1 and
V2) using the TDS2014 we use two BNC-to-banana plug
cables that connect from the measurement points in the
circuit board to 2 channels of the DSO.
Our cable calibration test [9] shows that some cables
generate more noise than the others. Cables with a long
unshielded part seem to generate more noise than the
ones with a shorter unshielded part. From the test, we
chose the two cables that generated the least noise for
future tests. The errors introduced by these cables are in
the bound of V ± 5mV . Details can be found in [9].
2) Oscilloscope calibration: The Tektronix TDS 2014
[8] is a four channel DSO that provides real-time voltage
acquisition. Since the factory’s specification is quite
conservative in estimating the equipment’s accuracy,
we experimentally calibrated the unit for our voltage
measurement purpose. The DSO calibration details can
be found in Technical Report 071008A [10].
We use linear regression equations to estimate the real
input voltage from the one recorded with the oscilloscope. The method is applied to three different voltage
range measurements for the three ADSL modems we
considered. A summary estimation for these voltage
ranges is presented in Table II. The errors introduced
by are in the range of 12mV - 15mV, dependent on the
voltage range and a particular channel used.
TABLE II
VOLTAGE E STIMATION
Vrange
15.5V-18.5V
(Cisco 837)
10.8V-13.8V
(Linksys AG041)
11.4V-14.4V
(Linksys WAG54G)
Channel
1
2
1
2
1
2
Estimation y=Vest , x = VDSO
y = (0.9945x + 0.0882) ± 0.015
y = (0.9963x + 0.0345) ± 0.014
y = (0.9948x + 0.0737) ± 0.013
y = (0.9965x + 0.0465) ±0.013
y = (0.9936x + 0.0915) ± 0.012
y = (0.9970x + 0.0296) ± 0.013
CAIA Technical Report 071011A
3) Resistor calibration: To calibrate the resistor, a
power supply source (GPC-1850D) which generates a
source of known current is used. The current is passed
through the resistor, and the TDS2014 is used to estimate the voltage drop over the resistor. An average
of 10 repetitive tests with the current of 0.5A gave us
R = 1.016 ± 0.058Ω. Details can be found in Appendix
B.
4) Calibration of equipment behaviour over time:
Continuously monitoring a DUT in the Minimum Load
condition over an 18 hours period, we found that the
voltage source provided by the DUT’s power plug pack
slightly changed over time (up to 1V within a few hours
period). Even though our power measurement is based
on the median of instantenous V1 and V2 over 200
samples, the fluctuation in instantaneous supply voltage
has impacts on the actual power consumed by the DUT,
which then may interfere with our interpretation of the
results in subsequent tests.
To overcome the problem, in Scenarios 2, 3 and
4, considering we are interested in the relative power
changes in different traffic scenarios through the DUT,
we use a regulated constant voltage supply (the PSU)
with an equivalent voltage supplied by the DUT’s power
plug pack. (In Scenario 1’s tests we use the DUT’s power
plug pack as the power source to have a sense of the
actual power consumption if the consumer let the device
be under Minimum Load 24/7.)
Our experimental results show that the voltage supplied by the PSU stayed stable over time. Details can be
found in Appendix C.
D. Conclusion on power measurement methodology
Due to the equipment calibration results, we use the
following methodology for our experiments:
• To compare the power consumption of the DUT
under two different traffic patterns, the two tests
are taken place within a short period of time (to
avoid the fluctuation of the devices’ behaviours
over time). ‘Short’ period of time means under 30
minutes apart.
• In Scenarios 2, 3 and 4’s tests a regulated PSU is
used to supply a constant V1, adjusted so that V2 is
close to the voltage normally supplied by the DUT’s
power plug pack.
• The same DSO settings are used for comparable
tests.
• The experimental voltage estimation approach is
used to estimate the real voltage from the measured
voltage of the DSO.
October 2007
page 4 of 17
In all our experiments, the same voltage resolution
of 12mV is used. An important note here is that, with
the voltage range of the 3 DUTs (from 12V to 18V),
one can argue that changes in the power consumption
in order of ∼ 144mW for Vin ∼ 12V and ∼ 216mW
for Vin ∼ 18V are inconclusive. One may not be sure
that the fluctuations are caused by the changes in the test
condition, or just due to the uncertainties of the voltage
measurements.
However, in our tests we collect thousands of data
samples within several minutes (very short relatively to
the time period over which the power source’s fluctuations may occur). We not only look into the absolute
changes in the power consumption’s values, but also the
distribution of the data samples. If the distribution of the
power values vary when the traffic pattern changes in a
test scenario, even though the absolute differences are in
the sensitive ranges, we suggest that these changes may
due to the variation of the traffic pattern.
E. Methodology to construct different network scenarios
Our network testbed is illustrated in Figure 3. All network management/test control data is transferred using
the out-of-band Swinburne University public network.
192.168.0.2/24
192.168.0.1/24
10.1.1.1/16
ADSL Modem
Password: bart
136.186.229.65/24
BART DSLAM
Password: caiabart
Client
VC 8/35 PPPOE
User: caia Password: caiappp
ATM
10.1.0.100/16
10.1.0.1/16
Cisco 7200 Router
136.186.229.232/24
Remote Server
136.186.229.81/24
ITS Network
Fig. 3.
Network Testbed Layout
1) Scenario 1: Each DUT is powered on with its
manufacturer’s supplied power plug pack, with no physical ADSL and Ethernet connection. V1 and V2 (hence
the power consumption) are monitored continuously over
five minutes period.
2) Scenario 2: All modems are configured to operate
with 8Mbps download/1Mbps upload at the DSLAM
in our ADSL testbed [11]. However, the actual speeds
perceived at the modems are ∼ 7M bps download and
∼ 700Kbps upload.
We study the power consumption of each modem in
different operations: Idle and Loaded. In the Loaded
CAIA Technical Report 071011A
case, the first test is run with TCP traffic. We transmit
the traffic for 5 minutes and then let the modem be idle
for further 5 minutes. This process is repeated twice to
confirm the changes in the power consumptions between
different phases if there are any.
The same procedure is then repeated with UDP traffic.
We use packet payload size of 40bytes (small packet to
achieve higher PPS rate). MTU sizes at both client and
server are set at 1500 bytes. Two-way UDP traffic is
used. To make sure there is no substantial packet loss,
we estimate the maximum PPS theoretically with the
download and upload speed perceived by the modem.
The method to estimate the maximum PPS is illustrated
in Appendix D.
We start from the estimated maximum PPS rate, run
the test, and monitor the traffic at both sender and
receiver using tcpdump [12] to estimate packet loss 1
If unacceptable packet loss occurs, we reduce the packet
rate and repeat the test. After a few trials, we choose to
use the traffic profile with an upstream packet interarrival
time of 2.5 milliseconds and downstream with packet
interarrival time of 0.5 millisecond.
For all tests, the PSU is used to provide an equivalent
voltage as supplied by the DUT’s power plug pack.
3) Scenario 3: In this scenario, a number of tests were
run to confirm a reasonable number of NAT entries to
load the DUT’s NAT table. It needed to be close to the
maximum allowed number and avoid packet loss for the
test TCP traffic. We choose to populate a modem’s NAT
table with concurrent idle SSH sessions.
Our experiments with the three modems showed that
the Linksys AG041 allowed up to ∼ 500 concurrent SSH
sessions, however the Linksys WAG54G and Cisco 837
only allowed up to ∼ 300 concurrent SSH sessions. Any
attempts to open additional SSH sessions failed with
sessions being torn down and/or losing packets in the
TCP test stream.
For a safer option, we choose to populate 250 entries into each modem during the NAT loaded test. To
generate 250 concurrent NAT entries, we use a script
to automatically populate 250 concurrent SSH sessions.
These SSH sessions are left opened and stayed idle
during the test. To make sure the entry for the TCP traffic
1
We compare the total number of packets sent and received to
estimate packet loss. This requires the synchronisation of traffic
recording at the sender and the receiver. The test scripts are written
to provide this synchronisation. The difference of less than a hundred
packets out of hundred thousands of packets between the sender and
the receiver is considered acceptable to balance the trade-offs between
packet loss and link utilisation in our tests.
October 2007
page 5 of 17
IV. R ESULTS AND A NALYSIS
17.84
17.82
V1(Volt)
stay at the bottom of the NAT table (in case the modem’s
firmware uses a linear search from the top, searching for
the TCP entry will incur more processing overhead with
bigger NAT table), the population of SSH sessions were
completed before initiating TCP traffic.
17.8
17.78
17.76
A. Power Consumption - Scenario 1
17.74
0
1
2
3
4
5
6
7
8
9
10
11
12
13
14
15
16
17
18
19
20
This section shows the power consumption of the three
modems in Scenario 1. As can be seen in Figure 4, the
Linksys AG041 consumes the most power, of more than
6W, and the LinksysWAG54W consumes the least, of
less than 4W.
Time elapsed (milliseconds) − Cisco837
12.2
12
0.6
11.9
0.4
11.8
11.7
0.0
0
1
2
3
4
5
6
7
8
9
10
11
12
13
14
15
16
17
18
19
20
Cisco837
LinksysAG041
LinksysWAG54G
0.2
CDF(0−1)
0.8
V1(Volt)
1.0
12.1
Time elapsed (milliseconds) − LinksysAG041
4.5
5.0
5.5
6.0
6.5
13.45
Power Consumption (W)
Fig. 4. Power consumption of different modem with Minimum Load
- scenario 1
It is also interesting to note the distribution of the
power values between the maximum and the minimum
of each modem’s power consumption range. While the
power consumption for the Cisco 837 modem distributes
over only few values, the ones for the two Linksys
modems have much larger ranges of possible values.
A closer look at the voltage supplied for each modem
explains the results. Figure 5 shows V1 values (sampled
every 0.1 millisecond over a 20 milliseconds period) for
the three DUTs. The power plug pack of the Cisco 837
modem seems to be well regulated, the median of V1
shows only few possible values (± multiple of 12mV equals to the DSO’s voltage resolution). On the contrary,
the ‘regulated’ plug packs of the Linksys AG041 and
Linksys WAG54G exhibit a noticeable 100Hz analog
ripple of ±250mV and ±125mV respectively. Similar
results have been seen for V2. The ripple in V1 and V2
causes the DUT’s actual power consumption to ripple
slightly, causing more possible distinct power values to
be observed between the maximum and minimum values
in this scenario.
CAIA Technical Report 071011A
13.4
13.35
13.3
13.25
13.2
0
1
2
3
4
5
6
7
8
9
10
11
12
13
14
15
16
17
18
19
20
4.0
V1(Volt)
3.5
Time elapsed (milliseconds) − LinksysWAG54G
Fig. 5. Voltage source (V1) provided by each modem’s power plug
pack
B. Power consumption for each modem - Scenario 2 and
3
This section reports on the power consumption of the
three modem under different traffic scenarios.
1) Linksys AG041 Modem: For scenario 2, Figure 6
show the results of alternating phases when the link is
loaded with TCP traffic. The scatter plot shows that
during the test period, the power consumption of the
modem when Idle and Loaded ranges from 7.35W to
7.5W. Most of the data points gathered around the
October 2007
page 6 of 17
1.0
0.8
0.6
0.2
0.4
1.0
0.8
0.0
0.6
0.4
0.0
Minimum NAT
Nearly full NAT entries
7.25
7.30
7.35
7.40
7.45
7.50
Power Consumption (W)
Fig. 8.
AG041
Minimum NAT
Nearly full NAT entries
5.95
0.2
CDF (0−1)
consumption between the phases should be measurable
using more precise equipment.
2) Cisco 837 Modem: For scenario 2, Figure 9 shows
the Cisco 837’s power consumption during Idle and
loaded (with TCP traffic) phases for scenario 2’s test.
The CDF of the power consumptions in different
phases show that when the modem is loaded, there
is significant change in the distribution of the power
consumptions compared to the Idle state. It shifts toward
the upper bound of the power consumption range. More
than 80% of the time the modem consumes more than
5.8W in the Loaded phase, compared to less than 40%
when the modem is in the Idle phase.
The test was repeated with UDP traffic. Figure 10
shows the modem’s power consumption during different
operating phases.
Similar to the case of TCP load, the CDF of the
power consumptions in the two phases show that when
the modem is loaded, there is significant change in the
distribution of the power consumptions compared to the
Idle one, which shifts toward the higher end of the
power consumption range. More than 50% of the time
the modem consumes more than 6.1W in the Loaded
phase, compared to less than 10% when the modem is
being idle. This suggests that the modem when loaded
may consume slightly higher power compared to when
idle.
CDF (0−1)
boundary values, which can be explained by the well
regulated voltage supply of the PSU used in the test.
Though it is hard to see the differences in the power
consumption between the different phases with the scatter plot, the cumulative distribution function (CDF) plot
shows that more than 30% data points having the upper
bound values of 7.5W for the Idle phase, compared to
approximately 20% for the Loaded phase. This suggests
that the modem in the Idle state may consume slightly
higher power compared to the loaded state.
The test was repeated with UDP traffic. We transmit
the traffic for 5 minutes and then let the modem be idle
for further 5 minutes. This process is repeated twice.
Figure 7 shows the modem’s power consumption
during different operating phases. Our results exhibit
similar behaviour as with TCP traffic. The CDF of
the Idle phase showed an increase of ∼20% of data
points gathered around the upper bound of the power
consumption compared to the Loaded phase. Again, this
suggests that the modem in the Idle state consumes
slightly higher power compared to the Loaded state.
For scenario 3, Figure 8 shows the modem’s power
consumption during minimum NAT table and nearly full
NAT table cases. The CDF of the nearly full NAT entries
phase showed an increase of more than 30% of the data
points gathered around the upper bound of the power
consumption compared to the Minimum NAT phase.
This suggests that the modem consumes slightly more
power with loaded NAT table compared to the operation
with minimum NAT entries.
Minimum/Loaded NAT table with TCP traffic - Linksys
Please note that the differences in power consumption
for thoses tests are mostly under 150mW, which is in the
range of errors caused by uncertainties/resolution in our
voltage measurements. The exact difference in the power
CAIA Technical Report 071011A
6.00
6.05
6.10
6.15
Power Consumption (W)
Fig. 11. Minimum/Loaded NAT table with TCP traffic - Cisco 837
For scenario 3, Figure 11 shows the modem’s power
consumption during minimum NAT table and loaded
NAT table phases. There was not much difference between the two phases. However, the CDF of the nearly
full NAT entries phase shows a slightly lower power
consumption than the phase with minimum NAT entries.
This result is different from the one we see with the
Linksys AG041 modem. More exhaustive experiments
October 2007
page 7 of 17
1.0
7.5
Packet Rate (per second)
0.8
0.6
CDF (0−1)
7.35
0.4
7.4
Median P − 2 seconds time bin
0.2
Power Consumption (W)
750
7.45
7.3
500
250
Idle
Loaded
Idle
Loaded
0
7.25
Time Elapsed (minutes)
7.30
7.35
7.40
7.45
Idle
Loaded
0
7.50
Power Consumption (W)
Time Elapsed (minutes)
Idle/Loaded with TCP traffic - Linksys AG041
1.0
Fig. 6.
Loaded
0
1
2
3
4
5
6
7
8
9
10
11
12
13
14
15
16
17
18
19
20
Idle
0.0
Loaded
0
1
2
3
4
5
6
7
8
9
10
11
12
13
14
15
16
17
18
19
20
7.25
Idle
7.5
0.2
Median P − 2 seconds time bin
7.3
Loaded
Idle
Loaded
7.35
Time Elapsed (minutes)
1.0
Idle
500
Idle
Loaded
7.50
800
0.6
0.2
5.6
5.5
600
400
200
0.0
Median P − 2 seconds time bin
0
1
2
3
4
5
6
7
8
9
10
11
12
13
14
15
16
17
18
19
20
5.4
0
Time Elapsed (minutes)
Idle
Loaded
Idle
Loaded
0
5.4
5.5
5.6
5.7
5.8
5.9
6.0
Power Consumption (W)
Fig. 9.
CAIA Technical Report 071011A
Loaded
Idle
Loaded
Packet Rate (per second)
5.7
Idle
Time Elapsed (minutes)
0.4
5.9
5.8
Loaded
0
0.8
Loaded
750
Idle/Loaded with UDP traffic - Linksys AG041
CDF (0−1)
Power Consumption (W)
Idle
7.45
1000
Power Consumption (W)
Fig. 7.
6
7.40
1250
250
Idle
Loaded
0
1500
0
1
2
3
4
5
6
7
8
9
10
11
12
13
14
15
16
17
18
19
20
Idle
0
1
2
3
4
5
6
7
8
9
10
11
12
13
14
15
16
17
18
19
20
7.25
1750
0
1
2
3
4
5
6
7
8
9
10
11
12
13
14
15
16
17
18
19
20
7.35
Packet Rate (per second)
0.8
7.4
0.4
CDF (0−1)
0.6
7.45
0.0
Power Consumption (W)
2000
Time Elapsed (minutes)
Idle/Loaded with TCP traffic - Cisco 837
October 2007
page 8 of 17
1.0
6.3
5.9
Idle
Loaded
Idle
Loaded
0
1
2
3
4
5
6
7
8
9
10
11
12
13
14
15
16
17
18
19
0.0
5.8
0
5.8
5.9
6.1
6.2
Loaded
6.3
Idle
Loaded
Time Elapsed (minutes)
C. Power consumption of Wireless Router - Scenario 4
In this section, we look at the power consumption
of the Linksys WAG54G with different traffic scenarios
using the wireless service. We compare the two scenarios
of the modem transmitting and receiving traffic. We use
a UDP flow of different packet sizes (40 bytes, 1400
bytes and 4096 bytes) with packet gap of 5ms.
For each test, we transmit the UDP traffic for 5
minutes, receive the UDP traffic for 5 minutes, again
0.8
0.6
0.4
0.2
with deeper analysis to explain the results are subject to
our future work.
3) LinksysWAG54G Modem: For scenario 2, Figure
12 shows the Linksys WAG54G’s power consumption
during the Idle/TCP traffic Loaded phases. The CDF
graph shows that more than 85% of the time, the modem
consumes more than 4.75W for the Idle phase, compared
to more than 70% for the Loaded phase.
The test was repeated with UDP traffic. Figure
13 shows the modem’s power consumption during
Idle/Loaded phases. There is not much difference in the
power consumption between the phases. The CDF of the
Idle phase showed an increase of ∼2% of data points
gathered around the upper bound values compared to
the Loaded phase. This suggests that the modem in the
Idle state may consume slightly higher power compared
to the loaded state.
For scenario 3, Figure 14 shows the modem’s power
consumption during minimum/loaded NAT table phases.
The CDF of the nearly full NAT table phase showed an
increase of ∼ 20% of the data points gathered around the
upper bound of the power consumption (of ≥ 4.75W )
compared to the Minimum NAT phase. This suggests
that the modem consumes more power with loaded NAT
table compared with a minimum NAT table.
1.0
Idle/Loaded with UDP traffic - Cisco 837
Minimum NAT
Nearly full NAT entries
0.0
Fig. 10.
CAIA Technical Report 071011A
6.0
Idle
Power Consumption (W)
CDF (0−1)
Time Elapsed (minutes)
2200
2000
1800
1600
1400
1200
1000
800
600
400
200
0
0
1
2
3
4
5
6
7
8
9
10
11
12
13
14
15
16
17
18
19
20
Packet Rate (per second)
0.8
0.6
CDF (0−1)
6
0.4
6.2
6.1
Idle
Loaded
0.2
Power Consumption (W)
Median P − 2 seconds time bin
4.60
4.65
4.70
4.75
4.80
4.85
Power Consumption (W)
Fig. 14. Minimum/Loaded NAT table with TCP traffic - Linksys
WAG54G
transmit the UDP traffic for 5 minutes and receive the
UDP traffic for 5 minutes. Figure 15, 16, 17, 18, 19 and
20 show the results for three different packet sizes of 40
bytes, 1400 bytes and 4096 bytes respectively. As shown
in the figure, with a small packet size of 40 bytes, there
seems to be no difference between the modem’s power
consumption when transmitting and receiving. However,
with bigger packet sizes of 1400 bytes and 4096 bytes
(MSS of 1500 bytes), there are noticeable differences in
the power consumption between the two phases. Please
note that in the 4096-byte packets case, since we used
the same MTU size of 1500 bytes, each packet would
be fragmented into 3 back-to-back packets. Hence the
bigger packet size of these tests imply the higher bit
rate and longer transmission time for the test period.
Figure 17 and 18 show that transmitting consumes
more power (approximately 150mW) than receiving for
UDP packet sizes of 1400 bytes. While the power consumption for the receiving phase is in the range of 4.30W
October 2007
page 9 of 17
Idle
Loaded Idle
1.0
4.9
Loaded
Idle
Loaded
4.6
Packet Rate (per second)
0.8
CDF (0−1)
4.7
4.65
0.6
4.8
4.75
800
0.4
Median P − 2 seconds time bin
0.2
Power Consumption (W)
4.85
600
400
200
Idle
0.0
4.55
0
4.60
4.65
Time Elapsed (minutes)
Loaded Idle
Loaded
4.80
4.85
4.65
4.6
0.8
2000
0.6
CDF (0−1)
4.7
2200
Idle
Loaded
0.4
Median P − 2 seconds time bin
4.75
1800
1600
1400
1200
1000
4.55
0.0
4.60
4.65
4.70
Idle
Loaded
4.75
Time Elapsed (minutes)
1.0
Transmit
Receive
4.5
0.2
4.4
0.6
0.8
Receive
0.4
Transmit
CDF (0−1)
Receive
Loaded
Idle/Loaded with UDP traffic - Linksys WAG54G
4.7
Transmit
Idle
Power Consumption (W)
Fig. 13.
4.3
0.0
Power Consumption (W)
400
0
Time Elapsed (minutes)
0
1
2
3
4
5
6
7
8
9
10
11
12
13
14
15
16
17
18
19
20
4.2
0
4.30
Time Elapsed (minutes) − PacketSize = 4096bytes
Fig. 15.
600
0
1
2
3
4
5
6
7
8
9
10
11
12
13
14
15
16
17
18
19
20
0
1
2
3
4
5
6
7
8
9
10
11
12
13
14
15
16
17
18
19
20
0
4.6
800
200
4.5
Loaded
Time Elapsed (minutes)
0.2
Power Consumption (W)
4.85
4.8
4.75
Packet Rate (per second)
Idle
Idle
Idle/Loaded with TCP traffic - Linksys WAG54G
1.0
4.9
4.70
Power Consumption (W)
Fig. 12.
Loaded
0
0
1
2
3
4
5
6
7
8
9
10
11
12
13
14
15
16
17
18
19
20
0
1
2
3
4
5
6
7
8
9
10
11
12
13
14
15
16
17
18
19
20
4.5
4.40
4.45
4.50
4.55
Power Consumption (W) − Packet size = 40 bytes
Transmit/Receive with symmetric packet size of 40 bytes
- 4.45W, the power consumption for the transmitting
phase is in the range of 4.45W-4.60W.
Figure 19 and 20 even show more significant differences in the power consumption when transmitCAIA Technical Report 071011A
4.35
Fig. 16. Transmit/Receive with symmetric packet size of 40 bytes
- Cumulative Distribution
ting/receiving phases for UDP packet sizes of 4096
bytes. While the power consumption for the receiving
phase stays in the range of 4.30W - 4.45W, power
October 2007
page 10 of 17
1.0
0.8
4.7
Receive
Transmit
Receive
4.4
0.2
4.3
0.0
4.5
0.4
4.6
0.6
CDF (0−1)
Transmit
Power Consumption (W)
Transmit
Receive
4.3
4.2
4.5
4.6
4.7
4.8
0
1
2
3
4
5
6
7
8
9
10
11
12
13
14
15
16
17
18
19
20
Power Consumption (W) − Packet size = 4096 bytes
0
Time Elapsed (minutes) − PacketSize = 4096bytes
4.4
Fig. 20. Transmit/Receive with symmetric packet size of 4096 bytes
- Cumulative Distribution
1.0
Fig. 17. Transmit/Receive with symmetric packet size of 1400 bytes
0.4
0.6
0.8
Transmit
Receive
0.0
0.2
CDF (0−1)
consumption for the transmitting in the range of 4.75W4.9W.
While in all three cases, the receiving phase consumes the lowest power (stable at 4.30W-4.45W), the
transmitting phase consumes more power with a longer
transmission time and a greater bit rate. It makes sense as
the modem needs to consume a certain amount of power
when transmitting every bit of data. Figure 21 shows the
approximated data rate in terms of megabits per second
for the three tests.
4.35
4.40
4.45
4.50
4.55
6
4.60
5
Power Consumption (W) − Packet size = 1440 bytes
Fig. 18. Transmit/Receive with symmetric packet size of 1400 bytes
- Cumulative Distribution
Bit Rate (Mbps)
4.30
4
Transmit
3
Receive
40bytes
Transmit
1400bytes
Receive
4096bytes
2
1
Power Consumption (W)
0
1
2
3
4
5
6
7
8
9
10
11
12
13
14
15
16
17
18
19
20
0
Median P − 2 seconds time bin
Time Elapsed (minutes)
5
4.9
Fig. 21.
4.8
4.7
Transmit
Receive
Transmit
Approximate transmit/receive data rate (Mbps)
Receive
4.6
4.5
V. C ONCLUSION
4.4
In this report we have summarised our empirical testing method and results. We studied the power consumption of the three ADSL modems (Cisco 837, Linksys
AG041, Linksys WAG54G) in different operating modes:
Idle and Loaded with high packet rate and loaded NAT
table. The power consumption of transmitting and receiving phases over the wireless interface of the modem
Linksys WAG54G is also studied.
4.3
0
1
2
3
4
5
6
7
8
9
10
11
12
13
14
15
16
17
18
19
20
4.2
0
Time Elapsed (minutes) − PacketSize = 4096bytes
Fig. 19. Transmit/Receive with symmetric packet size of 4096 bytes
CAIA Technical Report 071011A
October 2007
page 11 of 17
Our results show that in the Minimum Load, the
Linksys AG041 consumes the most power, followed by
the Cisco 837 and the Linksys WAG54G respectively.
Heavy link load tends to increase the power consumption
of the Cisco 837 modem, and interestingly reduce that
of the two Linksys modems compared to the Idle state.
A loaded NAT table increases the power consumption
of the two Linksys modems, yet slightly reduces that of
the Cisco 837. Transmitting using the wireless interface
of the Linksys WAG54G with a high bit rate consumes
significantly greater power than receiving traffic.
The results for the two Linksys modems in the heavy
link load scenarios are quite counter-intuitive, they shows
less power consumption compared to the Idle phase. Further study and research is needed for a good explanation.
However, our preliminary results suggest the devices are
not particular efficient when idle.
In this document, we also provide details about our
testing approach and experimental based equipment calibration method. A number of factors affecting the results
are considered and demonstrated. This will hopefully be
helpful to similar or related work.
In the future we plan to extend our work with a
larger range of devices (e.g. personal computers, laptops,
routers, switches, core network components etc.) and
test scenarios (e.g. different peer to peer downloading
methods, different uploading methods for wireless communications, user behavious in web browsing etc.). The
results that we obtained for the three modems may not
be representative to all modems of the same brand,
repeating the tests for a couple of modems of each brand
may help to confirm the findings.
ACKNOWLEDGEMENTS
We would like to thank Grenville Armitage (FICT)
for his very helpful advices and great assistance in the
development of this project and this report.
We would like to thank Tony Cricenti (FICT), Iain
Livingstone (FEIS), Steve Burrows (FEIS) and Walter
Chetcuti (FEIS) for being very helpful in supplying us
with the equipment used in our testbed.
A PPENDIX A
BACKGROUND ON ADSL AND W IRELESS H OME
N ETWORKS
A. ADSL network
Asymmetric Digital Subscriber Line (ADSL) is one
of the key technologies for broadband network services.
It belongs to the family of DSL technologies, known
as xDSL, which includes DSL variants such as CDSL,
CAIA Technical Report 071011A
UDSL, VDSL, HDSL, IDSL, SDSL, RADSL, VADSL,
G.SHDSL, and ADSL [13]. ADSL offers megabit data
rates over the telcos’ existing copper access infrastructure. The data transmission is asymmetric: most of
the channel bandwidth is allocated for the downstream
with relatively smaller channel bandwidth allocated for
upstream.
Basically, ADSL makes use of advanced signal processing techniques, that allow the utilisation of un-used
frequencies for standard voice services. It therefore enables the transmission of digital data traffic onto the same
analog line with the traditional telephone service [13].
DMT (Discrete Multi-Tone) and CAP (Carrierless Amplitude/Phase modulation) are two widely used ADSL
line codes, each takes a different approach to the technical challenge of dividing the frequency spectrum into two
discrete ranges, with the bottom range (0-4kHz) reserved
for POTS (Plain Old Telephone Service) and the upper
range (24kHz to 1.1 MHz) carrying ADSL data signals.
DMT is the official ANSI standard for ADSL T1.403.
This technology divides the upper frequency spectrum
into 249 separate channels, each of 4kHz bandwidth capable of transmitting about 30kbps. The DMT circuitry
therefore behaves like 249 separate modems running in
parallel. At the ADSL spectrum, 136kHz is used for the
upstream or subscribe return signal. CAP is a variant on
QAM (Quadrature Amplitude Modulation) developed by
AT&T. This technology shifts the carrier’s amplitude and
phase in one of 64 different ways, depending upon the
data value to be transmitted. CAP uses separate upstream
and downstream data bands. However unlike DMT, the
top of the upstream band operates in the same frequency
range as the lowest part of the downstream band. The
SNR is enhanced using signal encoding techniques [14].
A customer deploying ADSL must support PPP-style
authentication and authorization over a large installed
base of legacy bridging customer premises equipment
(CPE). PPPoE (PPP Over Ethernet) and PPPoA (PPP
Over ATM) are the two common types. PPPoE is specified in RFC2516 [15]. It provides the ability to connect a
network over a simple bridging access device to a remote
access concentrator or aggregation concentrator. PPPoA
relies on RFC1483 [16], operating in either Logical Link
Control-Subnetwork Access Protocol (LLC-SNAP) or
VC-Mux mode. A customer premises equipment (CPE)
device encapsulates the PPP session based on this RFC
for transport across the ADSL loop and the Digital
Subscriber Line Access Multiplexer (DSLAM).
Our ADSL testbed [11] uses DMT modulation for data
transmission. While the network supports both PPPoE
October 2007
page 12 of 17
and PPPoA, our ADSL clients are connected using
PPPoE protocol. PPPoE encapsulation is summaried in
Appendix D.
B. Wireless 802.11b network
The IEEE’s 802.11b specifications define the physical
layer and media access control (MAC) sublayer for
communications across a shared, wireless local area
network at up to 11Mbps. At the physical layer, IEEE
802.11b radio operates at 2.45 GHz and uses direct
sequence spread spectrum (DSSS) transmission. At the
MAC sublayer 802.11b uses carrier sense multiple access
with collision avoidance (CSMA/CA) [17].
802.11b operates in either Ad hoc mode or Infrastructure mode. In ad hoc mode wireless clients communicate
directly with each other. In infrastructure mode, wireless
clients communicate with a wired network (an enterprise
LAN or Internet connection) or other clients via an Access Point (AP). Infrastructure mode networks consist of
APs, wireless clients (computing devices with 802.11bbased network interfaces) and a wired network. An AP
acts as an Ethernet bridge between wireless clients and
the wired network. Our study focuses on 802.11b in
infrastructure mode.
The 802.11b transmission medium is half-duplex. It
uses Positive Acknowledgement (ACK) of every transmission and a Virtual Carrier Sense mechanism to reduce
the probability of two clients colliding.
A PPENDIX B
C ALIBRATION OF THE R ESISTOR
To calibrate the resistor (R ± δR), we use a power
supply source (GPC-1850D) which generates a source of
known current (I ± δI ). The current is passed through
the resistor, and the TDS2014 is used to measure the
voltage dropped over the resistor (VR ± δVR ).
R=
VR
I
(2)
hence:
δR
=
R
s
(
δVR 2
δI
) + ( )2
VR
I
(3)
δI is estimated as: 0.5% of the reading + 2 digits
(according to the power suply specifications)
hence: δI = 0.005 × I + 0.01
We chose to set a constant current I = 0.5A from
the power supply, VR across the resistor was measured
using mean value of CH3 (100mV/div, vertical voltage
position at zero). Ten measurements of VR were taken
CAIA Technical Report 071011A
to reduce the error of a single measurement. An average
of 10 measurement gave us the mean value of VR :
VR = 0.508 ± 0.026(V ). The error in VR measurement
was calculated using formula given in Specification [8]:
Err = ±(3% × reading + 0.1div + 1mV )
For this specific test, we had I = 0.5 ± 0.012
Substituting I, VR to equation 3 we had R = 1.016 ±
0.058Ω
A PPENDIX C
C ALIBRATION OF EQUIPMENT OPERATION OVER TIME
For our study, we would like to monitor the power
consumption of the DUT over several minutes. As we
might do tests several hours apart, the behaviour of
equipment over time is studied. A number of external
affecting factors include the changes in room temperature
over time, changes in the modem or resistor’s temperature during test, and changes in the DUT’s power plug
pack over time.
Equipment used to carry out this calibration test:
• Power Supply Unit (PSU) GPC-1850D
• TDS2014 Oscilloscope
• Linksys AG041 modem
• Resistor (1Ω 2W power factor)
A. Resistor hot/cold
We investigate whether the resistor’s temperature affects the modem’s voltage measurements. We monitor
the power consumption of the DUT for 10 minutes (only
powered on, with no LAN/ADSL cables connected). The
first five minutes of the test was with the resistor being
pre-heated (so that the resistor was quite hot - to simulate
the temperature when there was current going through it
for a long time) (Hot period). (To heat up the resistor
we used the GPC-1850D’s to constantly supply a 0.9A
current going through the resistor for 3 minutes.) The last
five minutes was with the register being cooled down by
applying an ice-bag directly to the resistor and leave it
for the remainder of the test (Cold period).
Figure 22 shows slightly reduction in the power consumption when the temperature of the resistor reduced
(changing from Hot to Cold period). The blue solid line
shows the median of the power consumption for each
30 seconds of data. Tracking the trend of the median
plot, the changes are insignificant (less than 100mW).
The results after repeating the test a second time shows
similar trend yet even less differences between the two
phases.
To verify the findings, we run the 10 minutes test
with only one phase: the resistor was pre-heated with
October 2007
page 13 of 17
6.9
7.1
7.3
7.5
Hot
Cold
Median plot
6.7
Power Consumption(W)
6.4
6.3
6.2
6.1
6
Power Consumption(W)
6.5
Hot
Cold
Median plot
0
60
120
180
240
300
360
420
480
540
600
0
60
120
180
Time (sec)
300
360
420
480
540
600
Time (sec)
Fig. 22. Power consumption when the resistor’s temperature changes
6.5
the same method described above, and there was no
cooling period during the test. Figure 23 shows the power
consumption results. The median plot exhibits the same
range of power consumption as the Cold period in the
above Hot/Cold test.
6.1
6.2
6.3
6.4
Hot
Median plot
Fig. 24. Power consumption when the resistor’s temperature changes
- PSU
the modem being pre-heated (so that the modem was
quite hot - to simulate the temperature when the modem
is powered on for a long time) (Hot period). To heat up
the modem we put it under a hand dryer for few minutes.
The last five minutes was with the modem being cooled
down by putting it into a fridge for few hours (Cold
period).
Similar to the resistor test, to eliminate the possible
effects of the DUT’s power plug pack over time, we
replace the power plug pack with a constant voltage
supply source of equivalent voltage using the PSU.
Figure 25 shows test results for Hot/Cold test for the
Linksys AG041 modem.
1.0
6
Power Consumption(W)
240
180
240
300
360
420
480
540
600
0.8
120
To eliminate the possible effects of the DUT’s power
plug pack over time, we replace the power plug pack
with a constant voltage supply source of equivalent
voltage (12.6V with an estimation of 0̃.6V dropped
through the resistor during test) using the Power Supply
Unit (PSU). Figure 24 shows test results for Hot/Cold
test.
0.2
Power consumption when the resistor’s hot
Hot
Cold
0.0
Fig. 23.
CDF(0−1)
Time (sec)
0.6
60
0.4
0
7.0
7.5
8.0
8.5
Power Consumption(W)
B. Modem hot/cold
Fig. 25. Power consumption when the modem’s temperature changes
- Linksys AG041
We investigate whether the modem’s temperature has
any effects on the its voltage measurements. We monitor
the power consumption of the DUT twice, each time for
5 minutes (only powered on, with no LAN/ADSL cables
connected). The first five minutes of the test was with
Figure 25 shows significant higher power consumption
when the modem is in the Cold period. However the test
condition may be too extreme. Using the modem under
normal room temperature should not have this problem.
CAIA Technical Report 071011A
October 2007
page 14 of 17
6.5
Power Consumption (W)
We repeat the test with the Linksys WAG54G modem.
Figure 26 shows the test results. It seems that the modem
consumes a little higher power when the modem is cold.
However the difference was insignificant, in order of
150mW (which also in the range of uncertainties caused
by the voltage measurements, however the distribution
of the results shows more than 50% data points failing
into the higher end of more than 4.30W).
Median P − 5 minutes time bin
6.4
6.3
6.2
6.1
0.6
17
16
15
14
13
12
11
9
10
8
7
6
5
4
3
2
Time Elapsed (hours)
0.4
Fig. 27.
pack
0.2
CDF(0−1)
0.8
0
1
0
1.0
6
0.0
Hot
Cold
4.05
4.10
4.15
4.20
4.25
4.30
Power Consumption(W)
Power consumption over time - Idle state - Power plug
plug pack’s drift over long periods of time - possibly
tracking long-term changes in the laboratory’s nominal
240V AC mains power. (We assume that the TDS2014
maintains its accuracy level over time - this assumption
is validated with a set of tests below).
Fig. 26. Power consumption when the modem’s temperature changes
- Linksys WAG54G
13.6
13.4
13.2
C. Modem power plug pack over time
CAIA Technical Report 071011A
V1 (V)
13
12.8
12.6
12.4
12.2
17
16
15
14
13
12
11
9
8
7
6
5
4
3
2
1
0
10
Median V1 − 5 minutes time bin
12
0
The two tests above suggested that changes in temperature of the resistor and the DUT would not have
significant impact on the device’s power consumption.
However, our experimental results show fluctuation when
the same test was done at different time (spaced out by
several hours).
To investigate the problem, we monitor the Linksys
AG041’s power consumption in Minimum Load over
an 18 hours period. The test was conducted overnight,
started at 4̃pm 7/08/2007. The modem’s plug pack was
used as the power source. V1 and V2 were monitored
simultaneously using two channels of the TDS2014
DSO.
Figure 27 shows the power consumption of the modem
over the test period. The plot shows the median of power
consumption with time bin of 5 minutes. As can be seen
in the figure, the power consumption of the modem was
fluctuated over time, similar to a sine wave with the
largest changes between two peaks of under 200mW.
The changes in the DUT’s power consumption over
time was suspected to cause by the DUT’s power source
(plug pack) over time. Figure 28 shows V1 corresponding to the power consumption presented in Figure 27.
Our hypothesis is that the fluctuation in V1 is due to the
Time Elapsed (hours)
Fig. 28.
V1 over time - Idle state - Power plug pack
To confirm the hypothesis stated, we replace the
modem’s power plug pack by an equivalent, constant
voltage source supplied by the GPC-1850D PSU. We
repeat the same test again overnight, collected at 4pm
10/8/2007 with 18 hours test duration (Figure 30).
A PPENDIX D
PPP O E ENCAPSULATION
Table III provides a summary of PPPoE packet encapsulation overhead [18].
Based on the details in Table III, for example, if
the upstream ADSL bit rate is limited to 700Kbps and
downstream bit rate is limited to 6.5Mbps, Table IV
October 2007
page 15 of 17
provides an estimate of the maximum ATM cell rate
and PPS rate to transmit 40byte and 1500byte payload
UDP/IP packet.
7.2
7.15
P (W)
7.1
7.05
TABLE IV
E XAMPLE C ALCULATION OF M AXIMUM ATM CELLS / SEC AND
PPS
7
6.95
6.9
6.85
18
17
16
15
14
13
12
9
10
8
7
6
5
4
3
2
1
0
6.8
11
Median P − 5 minutes time bin
Time Elapsed (hours)
Fig. 29.
Power consumption over time - Idle state - PSU
Packet
Payload
40
bytes
AAL5PDU ATM
Max
size
cells/packet cells/sec
Max PPS
144
3
550
up,
5110 down
1500
bytes
1584
33
1650 up,
15330
down
1650 up,
15330
down
50 up, 464
down
12.6
12.59
12.58
R EFERENCES
12.57
V1 (V)
12.56
12.55
12.54
12.53
12.52
12.51
18
17
16
15
14
13
12
11
9
8
7
6
5
4
3
2
1
0
0
10
Median V1 − 5 minutes time bin
12.5
Time Elapsed (hours)
Fig. 30.
V1 over time - Idle state - PSU
TABLE III
E NCAPSULATION OVERHEAD IN PPP O E/ATM/ADSL NETWORK
[18]
Encapsulation
Layer
TCP or UDP
IP
PPP
PPPoE
MAC
Overhead Sizes (octets)
20 bytes or 8 bytes respectively
20
2
6
18 + Padding
PaddingOctets(PDU) =
Max [(0, minMACFrSize (PDU + DstMAC + SrcMAC + Encap +
FCS)]
= Max [(0, 64 - (PDU + 6 + 6 + 2 + 4)]
max 10
LLC/SNAP
(RFC1483Bridging)
AAL5
AAL5 trailer (8) + Padding
PaddingOctets(PDU)
=
+AAL5trailer)
Roundup( (Encap+P DU48
)×
48 − (Encap + P DU + ALL5trailer)
ATM
5 octers per 48 octers of AAL5PDU
CAIA Technical Report 071011A
[1] K. Roth, F. Goldstein, and J. Kleinman, “Energy consumption
by office telecommunications equipment in commercial buildings volume 1: Energy consumption baseline,” in Arthur D.
Little Reference No. 72895-00, 2002.
[2] S. Thomas and B. C, “www.internet.co2? GHG
emission
trends
of
the
Internet
in
Germany,”
http://iea.org/Textbase/work/2002/ictfeb02/THOMAS.PDF,
as of 24 May 2007.
[3] C. Gunaratne, K. Christensen, and B. Nordman, “Managing
energy consumption costs in desktop PCs and LAN switches
with proxying, split TCP connections, and scaling of link
speed,” in Int. J. Netw. Manag., vol. 15, no. 5. New York,
NY, USA: John Wiley & Sons, Inc., 2005, pp. 297–310.
[4] M. Gupta and S. Singh, “Greening of the Internet,” in SIGCOMM ’03: Proceedings of the 2003 conference on Applications, technologies, architectures, and protocols for computer
communications. New York, NY, USA: ACM Press, 2003, pp.
19–26.
[5] S. Beer, “US residential broadband penetration to exceed
50% in 2007,” as of 24 May 2007. [Online]. Available:
http://www.itwire.com.au/content/view/9666/127/
[6] H. H. Kim, J. Y. Moon, and S. Yang;, “Broadband penetration
and participatory politics: South korea case,” in Proceedings of
the 37th Annual Hawaii International Conference on System
Sciences, 2004.
[7] Broadband Subscriber Data - Global DSL Subscribers - 6 Year Growth, The ADSL Forum,
http://www.dslforum.org/dslnews/subscriberdata.shtml,
as
of 02 September 2007.
[8] TDS1000- and TDS2000-Series Digital Storage Oscilloscope
- User Manual, Tektronix, as of 01 September 2007.
[Online]. Available: http://www.tek.com/-or-http://courses.
washington.edu/phys334/datasheets/Tek2kUserManual.pdf
[9] A. Black, “Induced noise in oscilloscope cabling,” Centre for
Advanced Internet Architectures, Tech. Rep. 070724A, July
2007.
[10] A. Black and T. Nguyen, “Calibration of the Tektronix TDS
2014 Digital Oscilloscope,” Centre for Advanced Internet Architectures, Tech. Rep. 071008A, October 2007.
October 2007
page 16 of 17
[11] Centre
for
Advanced
Internet
Architectures,
http://www.caia.swin.edu.au/bart, as of 02 September 2007.
[12] Tcpdump/libcap, http://www.tcpdump.org/, as of 08 October
2007.
[13] Digital Subscriber Line (DSL): Using Next Generation Technologies to Expand Traditional Infrastructures, U.S. Robotic,
http://www.usr.com/download/whitepapers/8500-wp.pdf, as of
02 September 2007.
[14] D. J. Greggains, “ADSL and high bandwidth over copper lines,”
International Journal of Network Management, vol. 7, no. 5, pp.
277–287, 1997.
[15] L. Mamakos, K. Lidl, J. Evarts, D. Carrel, D. Simone, and
R. Wheeler, “RFC2516 - A Method for Transmitting PPP Over
Ethernet (PPPoE),” http://www.ietf.org/rfc/rfc2516.txt, February 1999.
[16] J. Heinanen, “RFC4183 - Multiprotocol Encapsulation over
ATM Adaptation Layer 5,” http://faqs.org/rfcs/rfc1483.html,
July 1993.
[17] IEEE, “ANSI/IEEE Std 802.11, 1999 edition,” ISO/IEC 880211: 1999, 1999.
[18] V.
Aken
and
S.
Peckelbeen,
Encapsulation
Overhead(s)
in
ADSL
Access
Networks,
http://www.oplnk.net/files/WhitePaper EncapsOverheads.pdf,
as of 21 June 2007.
CAIA Technical Report 071011A
October 2007
page 17 of 17