1
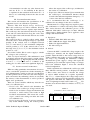
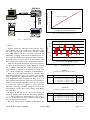
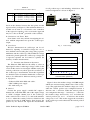
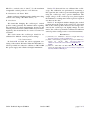
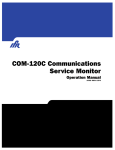
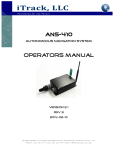
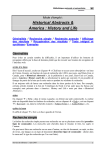
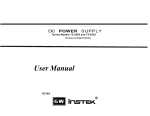
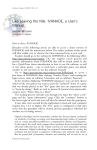
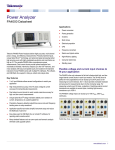
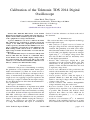
Calibration of the Tektronix TDS 2014 Digital
Oscilloscope
Adam Black, Thuy Nguyen
Centre for Advanced Internet Architectures, Technical Report 071008A
Swinburne University of Technology
Melbourne, Australia
[email protected], [email protected]
Abstract—The Tektronix TDS 2014 is a four channel
Digital Storage Oscilloscope (DSO) with 8-bit analogue to
digital converter. This document reports on the calibration
of the equipment for voltage measurements.
A precise multimeter was used to calibrate the DSO.
The calibration was performed by applying various DC
voltages to the DSO and comparing the measurement
results reported by the DSO and the multimeter. We were
able to establish a regression line for the multimeter and
DSO readings, which could be used to estimate the real
input voltage in future measurements recorded with the
oscilloscope.
We established there may be several factors which, when
altered, could affect the outcome of a calibration. These
factors include some of the DSO’s display settings such as
the vertical position and vertical scale. Due to the results
obtained, we recommend that individual calibration tests
must be conducted for different DSO settings.
I. I NTRODUCTION
Calibration is the process of determining or rectifying
the graduations of any instrument which returns quantitative measurements [1]. There are several reasons to
calibrate an oscilloscope. Firstly we can improve the accuracy of measurements by justifying the oscilloscope’s
output (in our case, applying a regression equation to the
oscilloscope’s output to estimate the true input voltage).
It is also likely that we are able reduce the manufacturer’s
error specification.
The report is structured as follows:
Section II lists the definitions of important terms which
have been used throughout the report. Section III contains the specifications of the various hardware consisting
of our testbed. In Section IV the report describes how the
TDS 2014 oscilloscope can be calibrated and contains
the results from several calibration tests we performed.
Section V investigates whether varying the vertical position of the oscilloscope can affect the consistency
of voltage measurements. The report is concluded in
CAIA Technical Report 071008A
Section VI and the references are listed at the end of
the document.
II. T ERMINOLOGY
This section introduces some important terminology
used throughout the report.
• ADC (analogue to digital converter): Converts an
analogue voltage level into a discrete digital representation. The granularity of an ADC can be determined from the number of bits it uses. For example,
an 8-bit ADC can digitally represent an analogue
signal using 28 = 256 unique voltage levels. The
more bits an ADC uses the less uncertainty exists
in the digital representation.
• Division: The oscilloscope’s display has a grid
superimposed on the waveform display area. The
vertical lines of the grid are used to represent a
quantity of time and the horizontal lines are used
to represent voltage levels.
• Vertical scale: Measured in Volts per division, the
vertical scale determines the voltage represented by
a single division along the y-axis.
• Vertical position: Used to offset the input of a
particular channel by a fixed DC voltage. This is
useful to view large voltages which would fall out
of range of the screen.
• Vertical resolution: The smallest distinguishable
voltage increment along the vertical axis.
• Regression line/Line of best fit: A mathematical
equation used to represent a set of data as closely
as possible. This document only discusses linear
regression lines. These are lines which can be
described by the equation, y = ax + b, where a
and b are constants.
• Coefficient of determination (R2 ) - A numerical
indication of the variability between a set of data
and a statistical model of the data. The coefficient
October 2007
page 1 of 5
of determination can take any value between zero
and one. If R2 = 1 all variability in the data set
is explained in the statistical model and if R2 = 0
there is no relationship between the data set and
model.
III. T ESTBED S PECIFICATIONS
This section will introduce the specifications of the
equipment used in our calibration experiments.
Tektronix TDS 2014 Digital Storage Oscilloscope:
This is the oscilloscope we wish to calibrate. It has an
8-bit ADC resolution and four separate input channels.
The oscilloscope has ten horizontal divisions along the
y-axis and ten vertical divisions along the x-axis. Note
that only eight of the ten horizontal divisions are visible
on the display.
The oscilloscope has a vertical position setting which
allows the user to offset the input voltage by a specified
quantity. If the vertical scale is configured between
2mV /div and 200mV /div the maximum configurable
vertical position is ±2V . If the vertical scale is set in
the range 202mV /div to 5V /div the maximum vertical
position is ±50V .
Instek GPC-1850D: This is used to supply a variable
DC voltage to the oscilloscope.
Fluke 189 digital multimeter: The multimeter is used
to accurately measure the power supply’s output voltage.
The multimeter has a 4 21 digit display and a DC accuracy
of 0.025% + 5 digits (the error is ± 0.025% of the
reading plus 5 counts of the least significant digit [2]).
IV. O SCILLOSCOPE C ALIBRATION
When recording quantitative measurements it is necessary to consider the potential error in the measuring devices. Manufacturers usually provide error specifications
for their products but in some cases the error margin is
quite conservative. By calibrating a device we can justify
the accuracy of the measurements as well as produce a
tighter error specification.
There are several variables which may alter the outcome of a calibration test.
• Vertical scale: The vertical scale determines the
resolution of the oscilloscope. A large vertical scale
results in low resolution voltage measurements and
conversely a small vertical scale results in high
resolution measurements. This means the oscilloscope’s vertical scale setting can affect the results
of a calibration test.
• Vertical position: In Section V we have experimentally tested whether varying the vertical position
CAIA Technical Report 071008A
affects the output of the oscilloscope, and therefore
the results of a calibration.
• Temperature: The user manual [3] recommends that
the oscilloscope’s self-calibration function should
be used if the ambient temperature changes by 5 ◦ C
or more since the last calibration.
It is recommended that the oscilloscope is recalibrated for any changes in the above variables.
Measurement of a voltage range may require a particular combination of vertical scale and position settings.
This section discusses the calibration process of the
Tektronix TDS 2014 oscilloscope for three different
voltage ranges. Similar method can be applied to other
settings and measurements.
A. Equipment
•
•
•
•
Tektronix TDS 2014 DSO and cables.
GPC-1850D Power Supply Unit (PSU).
Fluke 189 digital multimeter.
PC with serial port.
B. Method
Connect the PSU’s variable DC voltage output to the
oscilloscope’s channels and the digital multimeter in
parallel. Adjust the PSU to the lowest voltage level we
wish to calibrate and capture a record of 2500 samples,
also keep a log containing the multimeter’s reading.
Increment the power supply’s voltage and repeat the
acquisition process until the required range of voltages
have been calibrated. Figure 1 shows the described
testbed configuration.
In this experiment we calibrated the oscilloscope with
three different vertical positions, as displayed in Table
I. These values were chosen to measure the voltage
of various ADSL modems in a separate experiment.
The ‘VRange ’ column displays the voltage range used to
calibrate the oscilloscope for the particular vertical scale
and position. The PSU was adjusted in increments of
100mV beginning from the lower bounds of VRange . For
the three tests shown in Table I a timebase of 25ms/div
was used.
October 2007
TABLE I
C ALIBRATION TEST CONFIGURATION
Test
1
2
3
Vertical scale
-57
-41
-43
Vertical position
300
300
300
VRange
15.5-18.5
10.8-13.8
11.4-14.4
page 2 of 5
19
DMM Reading (Volts)
18.5
18
y = 0.9945x + 0.08823
17.5
17
16.5
16
15.5
15.5
16
16.5
17
17.5
18
18.5
19
Oscilloscope CH1 Reading (Volts)
Fig. 2.
Fig. 1.
Testbed Setup
Calibration Scatter Plot - Test 1
0.015
0.01
Figure 2 shows the calibration scatter plot for Test 1
using channel one of the oscilloscope. The values along
the x-axis represent the oscilloscope’s median voltage
over 2500 samples and the y-axis values represent the
multimeter’s reading. Under ideal circumstances the oscilloscope and multimeter readings should be identical.
In reality we do not expect this to be true because both
devices have some degree of error in their measurements.
Tables II, III and IV display the regression equations
for the tests shown in Table I. In the ‘Equation’ column
the x variable represents the voltage from the oscilloscope and the y variable is the calibrated voltage. The
‘R2 ’ column contains the coefficient of determination.
There are several important factors to consider when
performing calibration tests, one of them is the channel
used to perform the calibration. The oscilloscope has
four independent input channels and they do not all
have identical characteristics, therefore it is important to
calibrate each channel individually. It is also reasonable
to assume the regression equation is only applicable
when the oscilloscope’s display settings used for voltage
measurements are the same as the settings used during
the calibration.
In Tables II, III and IV we can see the regression
equations slightly differ from the theoretical mapping,
y = x. The coefficient of determination is very close to
one for all the regression lines, which mean they have
very strong linear correlation.
The error values shown in Tables II, III and IV are
CAIA Technical Report 071008A
Residuals
C. Results
0.005
0
−0.005
−0.01
−0.015
15.5
16
16.5
17
17.5
18
18.5
19
Oscilloscope CH1 Reading (Volts)
Fig. 3.
Residual Bar Plot - Test 1
TABLE II
C ALIBRATION R ESULTS F ROM T EST 1
Channel
1
2
3
4
Equation: y = ax + b ± Err (Volts)
y = (0.9945x + 0.0882) ± 0.015
y = (0.9963x + 0.0345) ± 0.014
y = (0.9940x + 0.1291) ± 0.013
y = (0.9924x + 0.1003) ± 0.016
R2
0.999963
0.999964
0.999980
0.999958
TABLE III
C ALIBRATION R ESULTS F ROM T EST 2
Channel
1
2
3
4
October 2007
Equation: y = ax + b ± Err (Volts)
y = (0.9948x + 0.0737) ± 0.013
y = (0.9965x + 0.0465) ± 0.013
y = (0.9935x + 0.1344) ± 0.014
y = (0.9927x + 0.0983) ± 0.012
R2
0.999965
0.999976
0.999954
0.999975
page 3 of 5
TABLE IV
C ALIBRATION R ESULTS F ROM T EST 3
Channel
1
2
3
4
Equation: y = ax + b ± Err (Volts)
y = (0.9936x + 0.0915) ± 0.012
y = (0.9970x + 0.0296) ± 0.013
y = (0.9936x + 0.1329) ± 0.014
y = (0.9918x + 0.1135) ± 0.014
for all positions up to and including -10 divisions. The
testbed configuration is shown in Figure 4.
R2
0.999984
0.999968
0.999950
0.999959
based on the distance between the data points and the
regression line (see Figure 2). The maximum distance or
residual can be used as a conservative error estimation
of the regression equation. A less conservative approach
may be to choose the 90th percentile of the residuals.
D. Limitations and Future Work
Some future work may include investigating the effects ambient temperature has upon the oscilloscope’s
output.
E. Conclusion
V. VARYING THE V ERTICAL P OSITION
The Tektronix TDS 2014 has the ability to offset an
input signal in order to make large voltages visible on the
screen. In this section we investigate whether varying the
vertical position has any affect upon the consistency of
the oscilloscope’s measurements. From this experiment
we should be able to determine whether the oscilloscope
needs to be calibrated for different vertical positions.
•
•
B. Method
Connect the power supply’s variable DC output to
channel four of the TDS 2014 and set the output voltage
to 1VDC. Configure channel four of the oscilloscope
with a vertical scale of 200mV /div and set the timebase
to 25ms. Adjust the vertical position to 0 divisions and
capture ten records of 2500 samples, then decrease the
position by one division and repeat the measurements
CAIA Technical Report 071008A
−5
1.08
1.06
1.04
1.02
1.00
0.98
0
−1
−2
−4
−6
−7
−8
−9
−10
Vertical Position (Divisions)
Fig. 5.
Tektronix TDS 2014 DSO and cables.
GPC-1850D power supply.
PC with serial port.
−3
1.10
A. Equipment
•
Testbed Setup
C. Results
Voltage (Volts)
We have demonstrated an oscilloscope can be calibrated by inputting a controlled voltage into one or
more channels and recording the voltage using a precise
multimeter and the oscilloscope. The multimeter voltage
can then be plotted against the oscilloscope voltage and
a regression equation can be formed to optimise the
accuracy of future measurements.
Fig. 4.
Varying the Vertical Position
Figure 5 shows the median voltage of 25,000 samples
which were measured using channel four of the oscilloscope. The graph shows the median voltage was 0.992V
when the vertical position was configured between 0
divisions and −6 divisions. When the vertical position
was configured in the range −7 divisions to −9 divisions
the median voltage decreased by 8mV and when the
vertical position was set to −10 divisions the median
voltage was 1.08V . This results suggest the consistency
of the oscilloscope can be affected as the vertical position
decreases.
October 2007
page 4 of 5
NB: For a vertical scale of 200mV /div the maximum
configurable vertical position is ±10 divisions.
D. Limitations and Future Work
Future work may including running similar tests using
vertical scale settings other than 200mV /div
E. Conclusion
We found that changing the oscilloscope’s vertical
position setting generally has minimal effect regarding
the consistency of voltage measurements, however as the
vertical position decreases (shifts further away from zero
negatively) the measurements do seem to become less
consistent.
This result means the oscilloscope should be recalibrated for different vertical position settings.
VI. C ONCLUSION
In Section III we listed the various equipment consisting of the testbed. We had a Tektronix TDS 2014 oscilloscope which we wanted to calibrate, a GPC-1850D
DC power supply and a Fluke 189 digital multimeter.
CAIA Technical Report 071008A
Section IV discussed how we calibrated the oscilloscope. The calibration was performed by connecting a
DC signal into the oscilloscope and measuring the signal
using the oscilloscope and a precise multimeter. The
output voltage of the oscilloscope was plotted against
the multimeter’s reading and a linear regression equation
was fitted to the data.
Section V investigated whether changing the vertical
position affects the output of the oscilloscope. We found
that as the vertical position decreases, the voltage measured by the oscilloscope can slightly change. To summarise, the oscilloscope should be calibrated for different
vertical position settings used to record measurements.
R EFERENCES
[1] Dictionary.com, “Calibration,” Viewed 27 August 2007, http://
dictionary.reference.com/browse/Calibration.
[2] Fluke, “Understanding specifications for precision multimeters,”
http://support.fluke.com/
Viewed
08
October
2007,
calibration-sales/Download/Asset/2547797 6200 ENG A
W.PDF.
[3] Tektronix, “TDS 1000- and TDS 2000-Series User Manual,”
Viewed 24 August 2007, http://courses.washington.edu/phys334/
datasheets/Tek2kUserManual.pdf.
October 2007
page 5 of 5