1
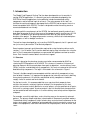
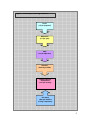
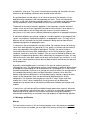
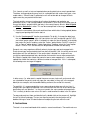
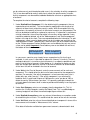
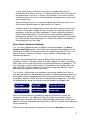
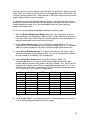
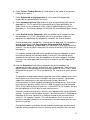
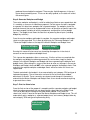
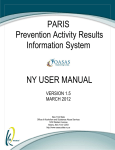
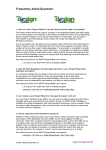
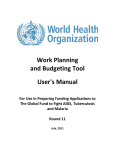
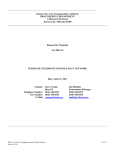
User's Manual
GFATM Proposal Costing Tool
31 October, 2008
1. Introduction
The Global Fund Proposal Costing Tool has been developed to assist countries in
costing GFATM applications. It is based in part on the template developed by the
GFATM for Round 8 applications, but modified to include more detailed activity
components and to facilitate input of unit costs. The main purpose of this tool is to
facilitate the costing of proposals developed for the GFATM, and to express these in a
format acceptable to the GFATM. The tool is designed to make the costing exercise
more automated and user-friendly.
In keeping with the requirements of the GFATM, the tool breaks quantity and unit cost
data down by quarter for the first two years of the proposal and by year for years 3-5. All
the data is included on one planning worksheet with totals by year and for the total
duration of the project. The program generates summary sheets that include workplans
and budgets as well as budget summaries.
The tool has been developed for use in costing HIV/AIDS proposals, but it is generic and
can just as easily be used for TB or Malaria proposals.
Some important concepts and information required for using the tool are discussed in
sections 1.1 to 1.3 below. Part 2 contains detailed step-by-step instructions for using the
tool. In Part 3 some potential problems are presented with guidance on how to resolve
these. Part 4 contains contact details for technical support.
1.1 Structure
The tool is based on the planning structure most often recommended by WHO for
structuring GFATM proposals for HIV/AIDS. This structure is based on a hierarchy of
planning elements which cascade down from goals to objectives, service delivery areas
(SDAs), activities, and detailed activity components. Unit costs are entered at the level of
detailed activity components. The logic is illustrated in the schematic in Figure 1.
The tool is flexible enough to accommodate activities and activity components at any
level of detail. However, it is important that proposals be internally consistent in defining
these planning elements. All activities and detailed activity components should be
roughly similar in content and level of detail.
For the best results, it is recommended that users construct their proposals from
activities that contain a relatively high level of detail. For the purposes of this tool,
activities can be most usefully defined as a set of actions, using a specified set of inputs,
that result in a primary output. A primary output is the first discrete level of output which
can be combined with other outputs in a service delivery area to help achieve objectives
and goals.
For example, an activity might be a series of training courses for community outreach
workers. The primary output might be a trained cadre of X community outreach workers.
The detailed activity components might include salary and subsistence allowance for the
trainers and support staff, adaptation and reproduction of training materials, purchase of
audio-visual equipment, travel and subsistence for the participants, rental of venue, and
so on.
1
Figure 1: Hierarchy of Planning Elements
Goals
(1-5 per proposal)
Objectives
(2-3 per goal)
SDA
(2-3 per objective)
Activities
(Several per SDA)
Detailed Activity
Components
(8-10 per activity)
Unit Costs
(One per detailed
activity component)
2
Activities are constructed from the bottom up, using detailed activity components as the
basic building blocks. Each detailed activity component and its corresponding unit cost
can be used many times in any number of activities. For example, the chart of accounts
might include an entry for one international consultant, and that cost may be equal to
€500 per day. This component may figure in several activities, but the activity
component and its unit cost data need be entered only once in the chart of accounts.
Figure 2 illustrates this principle. Activity component 1 and its unit cost are entered in
Activity A and again in Activity B. Component 3 is entered in Activities B and C, while
Component 2 figures in all three activities.
Figure 2: Activity Component and Unit Cost Input
Detailed Activity
Component 1
Unit
Cost
Activity A
Detailed Activity
Component 2
Unit
Cost
Activity B
Detailed Activity
Component 3
Unit
Cost
Activity C
1.2 Unit Cost Data
For optimal use, the tool requires unit cost data to be standardized across different
activities. One unit cost figure should be used for each detailed cost component,
regardless of how many times that cost component appears in the proposal. For
example, if an international expert will be recruited for 5 days for activity 1.1.3.1, another
for 10 days for activity 1.5.3.6 and yet another one for 15 days for activity 2.1.3.5, the
same unit cost figure should be used.
The tool can accommodate unit cost data at any level of detail, but it is recommended to
input cost data at the level of basic cost elements, such as one salary day for
consultants, one salary day or month for regular staff, one day for venue rental, one day
of per diem and allowances for workshop participants, one airfare, one vehicle, one dose
3
of medicines, and so on. This results a more accurate costing and also allows the cost
elements to be combined in different ways to build various activities.
As outlined above, the tool makes use of a chart of accounts that contains a list of
detailed activity components with corresponding unit costs. These are linked to the
activities so the chart of accounts provides inputs for: 1) a selection of possible detailed
activity components; and 2) standardized unit costs for each activity component.
The benefit of the chart of accounts approach is that it provides a smaller and more
uniform set of unit cost items upon which to build the cost estimate. It also requires a
careful examination of unit cost data and helps to ensure a certain amount of
consistency in unit costs across different implementing agencies or geographic locations.
A common method for constructing a proposal is to collect portions of the proposal from
various sub-recipients, implementing agencies, or geographic areas. This may result in
different unit cost estimates for the same components being received from different
implementing agencies or geographic areas.
In some cases these discrepancies may be justified. For example, the cost of renting a
venue for a workshop may vary based on its size, quality, or location and the choice of
venue may depend on the number of participants. Similarly, the cost of hiring an
international consultant may differ, depending his or her level of expertise, place of
residence, travel costs and so on. However, if the unit costs estimated by different subrecipients or implementing agencies differ substantially for no apparent reason, this may
indicate that errors have been made or that some cost estimates are unrealistic. In such
cases, users should carefully examine the cost data to identify and correct the source of
the discrepancies.
Accurately reflecting differences in unit costs in the chart of accounts presents a
challenge for users. The right balance must be struck between a legitimate differentiation
of components and keeping the set of components to a reasonable size. In most cases,
the preferred method is to arrive at an average unit cost that reflects the average cost of
the component based on the best available information. However, when there are
obvious and significant differences in cost based on quality, location, capacity or other
aspects of the component, these can be reflected by differentiating the activity
components. For example, there may be one entry for a "large" venue rental and
another for a "small" venue; or potentially it may be necessary to differentiate
components by location due to substantial cost differences between one location and
another.
In many cases unit cost data will be available through government accounts, based on
previous expenditures and actual cost data. In such cases a reasonably comprehensive
and accurate chart of accounts can be constructed from existing data, potentially
eliminating the need to rely on estimates from sub-recipients or implementing agencies.
1.3 Warnings and Caveats
Macros
This tool contains macros. It will not function correctly unless the macros are enabled.
To ensure macros are enabled, you must adjust the security settings to the appropriate
4
level before opening the workbook. To do this you must close the workbook then in excel
go to Tools > Macro > Security and set the security setting to "low" or "medium". If you
choose "Low" macros will be enabled automatically. If you choose "Medium" you will be
prompted to enable or disable Macros when you open the workbook.
If you are using Excel 2007, click on the office button,(the round button at the far
top most left corner of the spead sheet), and go to excel options > trust center
> trust centre settings > macro settings. Check enable all macros and finish
by clicking OK. The procedure needs to be repeated each time a workbook is
opened as macro settings sometimes change when the workbook is closed
Language
Currently the tool is only available in English. It may be translated into other languages
at a later date if it proves popular with users.
System requirements
This tool was written in Excel 2003 and it may not operate correctly on older versions of
Excel. The tool also requires a relatively large amount of memory and processing power
to operate. The tool was tested on a February 2002 computer with Windows XP (Service
Pack 2) and an Intel Pentium 4(R) processor operating at 1.69 GHz and with 512 MB of
RAM. It was tested with three versions of the tool and one additional (simple) workbook
running simultaneously. The tool worked correctly on this test, although some functions
were slow. It is recommended that the tool be used only on computers with at least this
capacity.
It is not recommended to run many versions of the tool in parallel on the same computer,
or to operate it together with other complicated software.
Protection
The tool contains numerous formulas and it will return incorrect results if these are
changed or deleted. The tool is protected to prevent inadvertent deletion or corruption of
formulas during data entry. This protection restricts the flexibility of the model and
imposes some limitations on users.
Formatting
Some of the macros refer to formats to determine what actions to take, and they will not
work correctly if formats are changed. Therefore, formatting is also protected and users
cannot change formats.
Copying and Pasting
Users may wish to cut or copy text from other spreadsheets and paste it into the tool.
The tool can accommodate this, but some difficulties may be encountered when using
this technique.
5
First, formats as well as text are imported when pasting data into an excel spreadsheet.
Therefore, cutting and pasting may result in a spreadsheet with various font types, sizes
and/or colors. Since the tool is protected, users will not be able to change the fonts
again once they are pasted into the tool.
The tool contains a macro to reformat cells when the budget and workplan are
generated, so this is not a major problem. Nevertheless, users may wish to take steps to
ensure that data is pasted into the tool only in the normal format, which is Ariel 10 point
and Black or Automatic in color. This can be accomplished in two ways:
1) Format the source data (the excel worksheet from which data is being copied) before
copying and pasting data into the tool; or
2) Use the "paste special" function to paste data. To do this, first copy the data from
the source sheet and then right click (or click on the "edit" function or type ALT+ES)
and select "paste special" which is located just under the "paste" button. In the dialog
box under the "paste" heading, select the "values" option button. Do NOT select the
"all" or "format" option buttons. Under "operations" heading, select the "none" option
button. Click on "OK" and the data will be pasted but without the formatting.
Second, users may experience difficulty when trying to copy and paste merged cells.
Excel cannot copy and paste data from one place to another if the size of the source and
destination cells are not identical. If the source data is located in a single cell it can
usually be copied and pasted into a destination that contains two or more merged cells.
But if data is copied from a block that contains two or more merged cells, it cannot be
copied into a block that contains a different number of merged cells. If this is attempted,
the following error message will appear:
In other cases (i.e. when data is copied from one or more single cells and several cells
are selected for the paste) excel may copy the same data in every cell in the merged
block (for an example, see the troubleshooting section at the end of this manual).
To avoid this, it is recommended that users copy and paste data one cell at a time. If
multiple cells are copied and pasted, users must ensure that the size of the source and
destination cells are identical - i.e. they must contain the same number of merged cells.
This is unlikely to be the case unless this tool is used to collect the data in the first place.
To copy and paste text from non-identical cells, double-click on the source cell, highlight
the text in the cell and copy. The text can then be pasted in the destination cell by
double-clicking to "enter" the destination cell and pasting the text within the cell.
2. Instructions
The tool is in an excel workbook which contains several worksheets. The worksheets are
6
color coded: the Orange tabbed worksheet contains basic information for users and a
setup button; Blue tabbed worksheets need to be filled by users with data on goals,
objectives, activities and unit costs; Green tabbed sheets are generated automatically by
the program and can be printed out to provide hard copies for submission to the GFATM.
To use the tool to cost a GFATM proposal, follow the steps below:
Step One: Mode
Go to the Instructions tab. Click on the "User mode" button to configure the tool for data
input. The user mode protects internal formulas from being inadvertently changed during
data input. The "Admin mode" requires a password and should only be used by
administrators.
User mode
Admin mode
Step Two: Title Sheet
1.
2.
3.
4.
Go to the "Title" tab.
Enter the proposal title and name of country.
Select the component (HIV/AIDS, TB or Malaria) from the drop-down list.
Choose the currency in which the proposal will be denominated (US$ or EURO) from
the drop down list. This is a critical step, as the budget calculations cannot be made
without this.
Step Three: Exchange Rate and Inflation Data
1. Go to the "Chart of Accounts" tab. Enter the current exchange rate (shaded in
yellow) for local currency against either the US Dollar or Euros, depending on the
currency in which the proposal will be denominated.
The exchange rate should be entered as the number of local currency units per USD
or Euro. If the exchange rate is entered the other way around (i.e. number of dollars
or euros per local currency unit) the model will yield incorrect unit costs. For example,
if one US dollar is worth 10 units of the local currency, the exchange rate should be
entered as 10, and not as 0.10.
2. In the "Chart of Accounts" tab, enter expected inflation rates into the table
including the inflation rate observed between the year of the base data and the first
year of the proposed program (shaded in yellow - please replace the "dummy" data
currently entered). Inflation rates should be based on the currency of account (US$
or €), and not on expected local currency inflation rates. The model assumes that
differences in inflation rates will be offset by changes in exchange rates.
Step Four: Chart of Accounts
The Chart of Accounts needs to be filled in with detailed activity components,
measurement units and actual or estimated unit cost data from the country. The "default"
chart of accounts contains more than 200 commonly used activity components. These
7
are for reference only and intended to guide users in the selection of activity components.
This list can be modified to make it more closely reflect the specific country situation.
Activity components can be modified, added or deleted to construct an appropriate chart
of accounts.
To complete the chart of accounts, complete the following steps:
1. Under Detailed Cost Component, fill in the detailed activity components that are
expected to go into activities. This can be done by modifying the existing chart of
accounts to more closely reflect the country's needs. With the exception of the far
right column, the contents of the cells in the chart of accounts are not protected. The
text can be deleted, modified, or replaced as necessary. If information is pasted over
existing information, the existing information in those rows will be replaced. If rows
need to be added or deleted, use of the "Add component" and "Delete component"
buttons at the top of the sheet. These are reproduced below for information. To add
a component, select a row just below where you wish to add a row and click on the
"add component" button. To delete rows, select the rows you wish to delete and click
on the "Delete component" button. Multiple rows can be deleted, by only one row at
a time can be added. Important: Do not add any rows or text below the red line at
the bottom of the chart of accounts.
Add component
Delete component
In some cases, countries may already have a comprehensive list of unit costs
available. In such cases it is possible to replace the "dummy" list entirely. The best
method of doing this is to create a chart of accounts in a separate spreadsheet and
paste it into the chart of accounts. When doing so, it is important to make sure that
there are enough rows above the red line in the chart of accounts to accommodate
all the items that will be included in the chart of accounts.
2. Under Units in the Chart of Accounts, enter the measurement unit for each cost
component. This should reflect the basic unit of measurement for the component in
question. For example, if the activity component is a local consultant and (s)he is
paid a daily rate, enter "per day". If the activity component is an antiretroviral
medicine and it is purchased in boxes of 100 capsules, enter "per box of 100" or
divide the cost by 100 and enter "per dose". It is generally preferable to break the
unit costs down to the lowest level in order to provide more flexibility in costing inputs
to activities.
3. Under Cost Category, select a cost category from the drop-down list. This list
contains the 13 cost categories used by the Global Fund. This is a critical step as
summary budget will not reflect the correct budget figures without this.
4. Under Detailed Assumptions, enter any relevant information or assumptions made
for establishing the unit costs. This could include the source of the unit cost estimate.
5. Under Unit Cost, enter the unit cost for each detailed cost component in terms of the
measurement unit included in "Measurement Units" column.
Price data will often be available from government accounts, denominated in local
8
currency. When data is entered in local currency, the program converts this
automatically to US Dollars or Euros. It is important to be consistent in the choice of
the denomination of unit costs. If unit costs are available in a mix of local currency
and other currencies, these must be converted into a standard local currency unit of
account before entry.
When calculating unit costs, it is extremely important that these reflect the units of
measurement indicated under the "Measurement Unit" column.
A common error is to include quantities of units required for specific activities in the
unit costs. For example, suppose a 5-day training course is being planned for 50
participants, and one of the activity components is a daily subsistence allowance
(DSA) of $30 for participants. The unit of measurement for DSA for participants is
indicated to be "per day". In this case, enter only the $30 DSA figure. Do not multiply
by 5 to get the total cost per participant. This information should be included when
entering quantities at a later stage.
Step 5: Master Workplan and Budget
This is the most complicated step in the process of costing a proposal. The Master
Workplan and Budget contains all the information required to cost the proposal in one
spreadsheet. It contains all the planning elements outlined under Section 1 of this user
manual as well as sections for indicators, activity numbers, funding sources and
implementing agencies.
The tool is constructed around the notion of different levels of planning elements as
illustrated in Figure 1. Each goal contains a number of objectives, which in turn contain
SDAs, which are in turn built on activities that contain detailed activity components. The
tool is originally set up to include two goals. Three objectives are included under each
goal, three SDAs under each objective, three activities under each objective, and ten
detailed activity components under each activity.
This structure is flexible and can be expanded, contracted or modified at the level of
each planning element to accommodate any proposal. Additional planning elements can
be included by clicking the appropriate button at the top of the worksheet. Buttons exist
to add goals, objectives, SDAs, activities and detailed activity components. The buttons
illustrated below are found at the top of the master Workplan and budget sheet.
Insert goal
Insert SDA
Insert det. activity
Insert objective
Insert activity
Delete cells
When any of these elements are added, the program automatically includes the
subordinate elements - e.g. adding one SDA also includes three activities and ten
detailed activity components per activity. Adding one goal automatically includes three
objectives with their subordinate planning elements (3 SDAs, 9 activities, and 90 detailed
activity components).
Where there are too many planning elements, these can be deleted by selecting the
9
planning elements you wish to delete and Clicking on the "delete cells" button at the top
of the sheet. Any number of planning elements can be deleted at the same time this way
simply by selecting multiple rows. When deleting an SDA don't forget to also include the
purple shaded summary row at the bottom.
It is possible to retain blank planning elements, but this is not recommended. Leaving
blank planning elements will not affect the total budget calculations, but it will result in an
untidy budget presentation. Users are encouraged to retain only those planning
elements that contain data.
To fill in the master workplan and budget complete the following steps:
1. Go to the Master Workplan and Budget worksheet. Fill in information on the first
goal and objective for the proposal. (Note that the first Goal, Objective and Activities
have been filled in with fictitious data for illustrative purposes only. Please delete or
replace the data when you are familiar with the tool.)
2. Under Service Delivery Area, select an SDA from the drop-down list. This list
contains all the 23 service delivery areas used by the Global Fund. This is a critical
step The summary budget will not reflect the correct budget figures without this.
3. Under Directly Related Indicator, fill in data on the indicators that will be used to
measure achievement of each objective/SDA. This column should normally indicate
only the number of an indicator in the strategic plan.
4. Under Activity Ref. Number create an activity reference number. The
recommended format is to assign a unique activity number based on the goal
number, objective number, SDA number, and activity number. Thus, the first activity
under goal one, objective one, SDA one, would be designated activity 1.1.1.1; the
second activity under goal 2, objective one, SDA three would be designated activity
2.1.3.2, and so on. This system is illustrated below.
Goal
1
1
1
1
---2
---2
---3
Objective
1
1
1
2
---1
---2
---1
SDA
1
1
2
1
---3
---2
---2
Activity
1
2
1
1
---5
---3
---4
Activity Number
1.1.1.1
1.1.1.2
1.1.2.1
1.2.1.1
---2.1.3.5
---2.2.2.3
---3.1.2.4
5. Under Activity Title fill in the name of the activity. As described above, an activity is
a set of actions designed to produce a primary output.
10
6. Under Previous Funding Sources fill in information on the source of any previous
funding for this activity.
7. Under Responsible for Implementation fill in the name of the organization
responsible for implementation of the activity
8. Under Implementing Entity Type choose the type of implementing entity from the
drop-down list. This list contains the implementing entity types specified by the
Global Fund. It is very important to select a type of implementing entity from the
drop-down list. The summary budget will not reflect the correct budget figures without
this.
9. Under Detailed Activity Component select the detailed activity components from
the drop-down list. This list is linked back to the chart of accounts, and the list
reproduces the detailed activity components included in the chart of accounts.
Once a detailed activity component is selected form the drop-down list, information is
entered automatically under Cost Category, Measurement Unit, Detailed
Assumptions, Currency, and Unit Cost. This information is taken from the chart of
accounts. The unit cost data is entered in the currency of account (US$ or Euros) of
the proposal.
It is important to choose detailed activity components from the drop down list rather
than typing or pasting the information directly into the cell. If the detailed activity
components are not chosen from the drop-down list the other categories (including
unit costs) may not be populated from the chart of accounts and the budget will be
incorrect
10. Insert the Quantities of each activity component that will be needed in the
appropriate cell under "quantity" by quarter or year, as appropriate. There are eleven
quantity columns corresponding to each of the four quarters of years 1 and 2, and to
total quantities for years 3-5. These are labeled Q1, Q2, and so on for years one and
two.
The quantities entered should reflect the quantities that will be needed in terms of the
measurement units and unit costs indicated in the chart of accounts. For example,
suppose ten training courses are planned, each of five days duration. A
consultant/trainer has been engaged to conduct these training courses. If the unit of
measurement is "per day" and the unit cost is $500, the quantity entered should be
50 (i.e. 5 days each for ten training courses). It should NOT be, for example, ten (one
per training course) or five (5 days for each training course).
Quantities should be entered only in columns corresponding to the timing of planned
activities. To continue with the above example, if one training course is scheduled for
November of year one, a quantity of 5 should be entered for the consultant/trainer
under Q4. For example, if activity 1.2.2.3 will take place in the first half of year 2,
quantities should be entered only in the two columns that correspond to the first two
quarters of year two.
Once quantity figures are entered, the tool automatically calculates the total cost of
individual activity components and sums these by activity and SDA. Sums are also
11
produced for each objective and goal. There may be slight divergences in the cost
figures due to rounding errors. These can be safely ignored, as the totals will reflect
the correct figures.
Step 6: Generate Workplan and Budget
The master workplan and budget is useful for collecting all data on one spreadsheet, but
it is unwieldy as a means of submitting a proposal. For that reason the tool is equipped
to separate this data into a workplan and a separate budget. The workplan shows the
practical elements that must be implemented in terms of quantities of specific inputs that
must be managed (including all activity components and quantities, but not budget
figures). The budget sheet shows the total costs of procuring those inputs (including
budgets by activities).
Once the master workplan and budget is complete, the separate workplan and budget
sheets must be generated. This is done by clicking on the "Generate Workplan" and
""Generate Budget" buttons at the top of the Master Workplan and Budget sheet.
Generate Workplan
Generate Budget
Running this macro will also correct any formatting discrepancies in the chart of
accounts or master workplan and budget sheet.
This step can be repeated as often as necessary. If further revisions are required after
the workplan and budget have been generated, this can be done simply by making
changes in the Master Workplan and Budget and then re-generating the workplan and
budget sheets. When doing this, care must be taken to enter any changes in the master
Workplan and Budget sheet and NOT in the separate workplan and budget sheets. Data
entered in the separate workplan and budget sheets will be lost when the sheets are
regenerated.
The data contained in the budget is also summarized by cost category, SDA and type of
implementing agency. These summaries are found in the last three green-tabbed
worksheets in the tool. These summaries are dynamic and change as information is
entered into the Master Workplan and Budget sheet. Users do not need to do anything
to generate these sheets.
Step 7: Print for Submission
Once the final version of the proposal is complete and the separate workplan and budget
sheets have been generated, they can be printed for submission to the Global Fund.
This can be done by the clicking on the green button labeled "Print sheets for
submission" which is found at the top of the Master Workplan and Budget sheet. This will
automatically print a workplan, a separate budget sheet, and summary budget tables by
cost category, SDA and type of implementing entity.
Print sheets for
submission
12
User should note that all the printout sheets are designed to be printed on A3 size paper.
They will also print on A4, but it is not recommended to print the workplan and budget
sheets in A4 size due to poor readability.
3. Troubleshooting
3.1. The program "freezes" or "crashes" when I try to use it.
This is most often caused because the macros are not enabled. To ensure macros are
enabled, you must adjust the security settings to the appropriate level before opening
the workbook. To do this you must close the workbook, and then in excel go to Tools >
Macro > Security and set the security setting to "low" or "medium". If you choose "Low"
macros will be enabled automatically. If you choose "Medium" you will be prompted to
enable or disable Macros when you open the workbook.
If you are using Excel 2007, click on the office button (the round button at the far
top most left corner of the speadsheet), and go to excel options > trust center
> trust centre settings > macro settings. Check enable all macros and finish
by clicking OK. The procedure needs to be repeated each time a workbook is
opened as macro settings sometimes change when the workbook is closed
This problem may also occur if you are running the tool in parallel with another
complicated spreadsheet, or a spreadsheet that is corrupted. Try shutting down other
spreadsheets and applications.
This problem could also be caused by insufficient system capacity. The tool has been
tested on an older computer with limited capacity, but may not work properly if your
computer does not have at least this capacity. To check, go to Start > Control Panel >
System. Click on system and check to see that your computer has at least the capacity
outlined below:
Item
Excel
Operating System:
Processor
Processor speed
RAM
Capacity Requirements
Excel 2003 or later
Windows XP or Vista
Pentium 4 or better
1.69 GHz or better
At least 512 MB
3.2. I get a #NA error in some of the cells in the master workplan and budget, the
budget or workplan sheets, or the summary budget sheets.
This error is caused by entering incorrect information into the detailed activity
components in the master workplan and budget. This is usually due to typing or pasting
detailed activity components directly into the master workplan and budget sheet, rather
than selecting them from the drop-down list. If data is entered manually, it may not
match data in the chart of accounts. In this case the program cannot find the unit cost
data and returns the #NA error. If this error is found in any cell, it is also returned for any
totals containing that error all the way up to the highest level.
13
To correct this problem go to the master workplan and budget sheet and find the #NA
errors in the far right hand column (Total Cost 5 years). Ignore any #NA errors in the
goal, objective and grey shaded activity totals rows, and find the errors in the detailed
activity component rows. When the error is found, go to the Detailed Activity Component
column (column H) and select the detailed activity component from the drop-down list.
3.3. I get a screen that repeats the same information several times as illustrated
below:
This can happen if you copy one or more cells and then select several cells to paste into.
Use the "undo typing" button or CTL+Y to correct this problem. If the undo typing
command is no longer available, delete the activity, insert a new activity and re-enter the
data.
3.4. The totals in the summary budget sheets do not match each other or do not
match the total budget in the budget sheet.
The summary budget sheets search for entries in Cost Category, SDA and Type of
Implementing Agency, and then return values for these in the budget sheets. Values
will not be returned if nothing is selected in these categories, and the budgets will
therefore be incorrect. To ensure the budgets are correct, take the following steps:
1. To ensure that the summary budget by cost category is correct, make certain that
you have selected a cost category for each detailed cost component in the chart of
14
accounts.
2. To ensure that the summary budget by SDA is correct, make certain that you have
selected an SDA name for each set of activities under an SDA in the master
workplan and budget.
3. To ensure that the summary budget by type of implementing agency is correct, make
certain that you have selected a type of implementing agency for each activity in the
master workplan and budget.
4. Technical Support
If you encounter difficulties using this tool please contact the WHO HIV help desk at
[email protected] with a description of the problem and contact details. We will try to
respond within 1 working day.
15