1
Commands:
•
•
The command "Compute”: to compute the Sen index. To compute the standard
deviation, choose the option for computing with standard deviation.
The command "Graph”: to draw the value of the index according to a range of poverty
lines z. To specify such a range for the horizontal axis, choose the item " Graph
Management ⇒ Change range of x " from the main menu.
Case 2: Two distributions
To compute the Sen index with two distributions:
1- From the main menu, choose the item: "Poverty ⇒ Sen index".
2- In the configuration of application, choose 2 for the number of distributions.
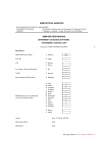
3- Choose the different vectors and parameter values as follows:
Indication
Vectors or parameters
Choice is:
Distribution 1
Distribution 2
Variable of interest
y1
y2
Compulsory
Size variable
s1
s2
Optional
Group Variable
c1
c2
Optional
Group number
Poverty lines
rho
k1
z1
ρ1
k2
z2
Optional
Compulsory
Compulsory
ρ2
4- To compute the normalised index, choose this option in the window of inputs.
The Bi-dimensional FGT index
The Foster-Greer-Thorbecke poverty index for a good g, Pg(k; z; α), for the
population subgroup k is as follows:
n
Pg (k; z g ; α) =
∑w
i =1
k
i
(z g − x ig ) α+
n
∑w
i =1
k
i
where zg is the poverty line for good g, and t + = max(t,0) . The normalised
index is defined by:
55