1
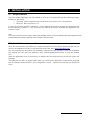
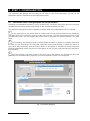
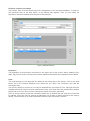
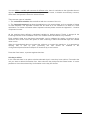
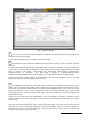
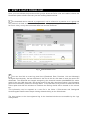
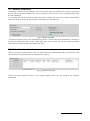
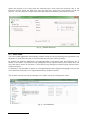
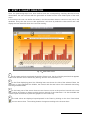
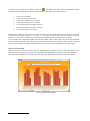
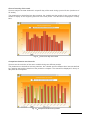
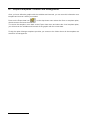
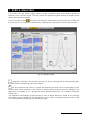
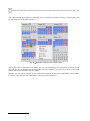
PECO-GRAPH Software for the graphical representation and mangement of counting data ENGLISH User Manual INDEX 1 INTRODUCTION ....................................................................................................................................2 2 INSTALLATION .....................................................................................................................................3 3 4 5 6 2.1 REQUIREMENTS ..............................................................................................................................3 2.2 INSTALLATION AND EXECUTION ........................................................................................................3 APPLICATION USE AND FUNCTIONALITY ........................................................................................4 3.1 FUNCTIONALITY ..............................................................................................................................4 3.2 PECO-GRAPH USE..........................................................................................................................5 STEP 1: CONFIGURATION ..................................................................................................................6 4.1 DEFINITION AND CONFIGURATION OF THE PREMISES .........................................................................6 4.2 GROUP DEFINITION ...................................................................................................................... 10 4.3 OPTIONS ..................................................................................................................................... 10 STEP 2: DATA DOWNLOAD ............................................................................................................. 12 5.1 MANUAL DOWNLOAD.................................................................................................................... 13 5.2 SCHEDULE DOWNLOADS............................................................................................................... 13 5.3 DATA FILES ................................................................................................................................. 14 STEP 3: CHART CREATION ............................................................................................................. 15 6.1 GRAPHIC TEMPLATES: CREATION AND MANAGEMENT. .................................................................... 20 7 STEP 4: ANALYSIS ............................................................................................................................ 21 8 STEP 5: EXPORT DATA .................................................................................................................... 23 9 HELP MENU ....................................................................................................................................... 24 APPENDIX 1- CREATION OF IMPORTED COUNTER ............................................................................ 25 User Manual - 1 1 INTRODUCTION The PeCo-Graph application allows obtaining, visualizing and analyzing the count data of any PeCo range unit and the count application AX-PeCo for AXIS cameras. The management of the data is done in an intuitive way through the organization in premises and groups, being able this way to study in detail the client traffic in the premises, and to establish any kind of comparatives between the establishments, between counters on the same premises or values of the same counter on different days. User Manual - 2 2 INSTALLATION 2.1 Requirements The PeCo-Graph application can be installed on a PC or on a Laptop that has the following program installed on previously: Operating System: Windows Vista, Windows XP with Service Pack 2 or Windows 7. Minimum: .NET Framework v 3.5 In case of not having the NET Framework v 3.5 the application will show a warning message and an Internet address to obtain it. If you don’t have an Internet connection available the application CD includes a copy. Note: If you have a previous version of PeCo-Graph, when installing the new version the existing count data is preserved. The premises data base and the configuration are converted to the new version. 2.2 Installation and execution Once the requirements are fulfilled you should download the PeCo-Graph application that can be found in the application CD and in the download area of the web: www.visual-tools.com. Run the setup.exe file and follow the installation instructions of the assistant. Once the installation has finished you can open the application from Start/Programs/PeCo-Graph or from the desktop icon. When the application runs for its first time a dialogue box will appear where you have to select the language. This dialogue box will not appear again when you execute the application; however the language can be changed when desired in the Configuration screen - Options tab selecting the Advanced menu. User Manual - 3 3 APPLICATION USE AND FUNCTIONALITY 3.1 Functionality The PeCo-Graph application is designed to simplify the analysis and management of the count data obtained from the PeCo and AX-PeCo units, the application is compatible with all the range models. These are the main functions that can be developed: Fluent interface: the PeCo-Graph application window can change its size to show further information on the screen. Premises definition: with one or more PeCo and AX-PeCo units. In every premise you can define variables with any of the unit counters. The application detects automatically the counters available in each unit. By default there is always a variable defined, that groups the count data from all the units’ counters that make up the premise. Downloaded data edition: Once the data has been downloaded it is possible to delete or clone selected days to avoid outliers. The data of each variable can be validated setting a maximum and a minimum value, there is an option to send a warning if within the selected days the variable value is zero. Creation of Groups to view information about the premises included, which simplify to gather the premises in thematic areas. It is created a group by default including all of the premises. You can import premises from other data bases, it is also available the option to export and print the list of the premises and groups defined on the data base. Downloads of the count data, both premises and groups. These downloads can be carried out manually at any time or through multiple scheduled downloads. The download speed has been improved, reducing significantly the time. The type of download can be incremental from the last download made or gathering the whole data from the last two years, except by the Peco1 units where the maximum data available is 6 months. Sending of an e-mail attaching the report of the download carried out, depending on the results. You can enclose the count files to the e-mail with the download report. Downloads detailed and accessible information, possibility to filter, sort and export the information. Creation of different types of Charts depending on the variables, the premises or the groups and the time intervals we wanted to use. Immediately change of the timescale in the chart, go to the current day with the TODAY button. Record and recovery of graphic templates. You can save the most used graphics and recover it when you needed. Graphic analysis of variables trends, with the selection of the time interval and the information level showed. The time periods can be selected or ignored to simplify the presentation and analysis of the data. User Manual - 4 Export and print the images of the generated charts, as well as the numeric data in CSV format. 3.2 PeCo-Graph use PeCo-Graph has a user-friendly interface with an easy navigation menu, which is placed on the upper part of the screen and allows you to access the different parts of the program: View Chart, Analysis, Download and Configuration. On the lower part of the screen there is a status bar that provides information about the system time. Also, to help the user there is a help icon, which will display this manual and information about the installed on version. Basic operation is as follows: STEP 1: CONFIGURATION First step is to create the premises from which you want to obtain information. A premise corresponds to an installation that has one or several units in which it is necessary to define the name, connection user and IP address, as well as the variables of the counters we want to use. Please remember that the application detects automatically the available counters in each unit, this way provides the variables creation. By default each unit has a variable named TotalIn that groups the data of the incoming counters. Next we can create groups of premises; this option is useful to simplify data downloading. A group named All is created by default and includes all the defined premises. STEP 2: DOWNLOAD DATA The following step is to download the counter data. It can be carried out for each premise individually or as a group. There are two types of downloads, all the data from the last two years (6 months for the Peco1 units) or the incremental download, from the last one made. Each download can be done manually or can be scheduled. Usually the first download from premises or from a group is the accumulated data from the last two years. Later incremental downloads can be scheduled that runs takes the last download executed as a starting point. STEP 3: GRAPICS Once the premises/groups count data has been obtained, in the View Chart tab several types of charts based on the variables and the chosen time intervals can be generated. STEP 4: ANALYSIS The Analysis chart is very useful to analyse the behaviour and evolution of a variable that belongs to a premises throughout a period. The results are displayed gathering similar values and creating behavioural groups. STEP 5: DATA EXPORTATION Finally, once the charts have been generated, they can be stored, exported (as an image or a data file) and printed for later processing with other applications. User Manual - 5 4 STEP 1: CONFIGURATION The premises and groups that are going to be used in the Chart generation, as well as the application options, are defined in the configuration menu. 4.1 Definition and Configuration of the premises Premises are installations formed by one or several Peco / AX-PeCo units range and one or several variables that have been defined depending on the counters that each unit has. The premises management screen appears by default when the configuration menu is selected 1 In the upper part of the screen there is a table where all the defined premises are displayed. The table fields can be sorted by clicking on the name column. To select a premises just click on the corresponding entry. You can export and print the list of premises and groups defined in the data base. 2 The searching and filtering tools are located beside the table. To search a premises write down the data you are searching in the key field, select the criteria and the field on which the search is going to be done and finally click the Search button. It will appear in the table the first premise that fulfils the established criteria. Click on the Filter button to see only the units that has been selected in the searching. 3 Once the selection has been made in the lower part of the window, the information about the premises into informative tabs, properties, units and variables of each unit is displayed 1 2 3 Fig. 1 Premises definition User Manual - 6 Premises creation and edition The buttons, New, Edit and Delete allow the management of the premises database. To define a new premises click on the New button, in the window that appears. Then you can define the properties, units and variables that comprise of the premises. Fig. 2 Premises creation Properties The properties of the premises are defined in the upper part of the screen: Name, Address (City, State, Zip) as well as the Comments field where additional data about the installation can be added. Units The units belonging to the premises are added in the central part of the screen. Click on the New button and in the window displayed next, define the unit name, the connection user and the connection data. The user by default to connect to a unit and to download the count data is Peco, although there are available as well the Supervisor and Administrator users. All of them have the passwords by default; please bear in mind in case you have change the original connection password. Click on the New button to add the connection data to the IP address list and enter the port and the IP address. When the unit has several IP addresses one of them is always selected to be used by default. The secondary IP is used automatically when the first one doesn’t connect. User Manual - 7 Fig. 3 Premises units Variables The variables that will be used to generate the Charts are defined in the lower part of the screen. To define a new variable click on the New button, introduce the name and select the unit. In the counters section the counters enabled appears in the checkboxes, the button Refresh counters updates its number. When you define a variable and it is not possible to connect to the unit the Force number of pecos button lets you define the number of unit’s counters. Fig. 4 Variable definition User Manual - 8 You can define a variable with counters of different units; there is a window on the right side where it appears all the counter’s premises sorted by the counter name, to disable unnecessary counters, select them and press the Remove selected button. There are two types of variables: 1.- The calculated variables that are defined with the counters of the unit. 2.- The imported counters that allow the application to join external data, such as number of tickets or sales numbers. The imported counters can be used as a unit variable or as data for a ratio calculation. For further information about imported counters please consult the Appendix 1- Creation of imported counter. All the premises have defined a calculated variable by default named TotalIn. It groups all the incoming counters of the installation units. This variable cannot be deleted, only modified. Each variable’s data once has been downloaded, can be validated by setting a maximum and a minimum value, there is also the option to send a warning if within the selected days the variable value is zero. When the downloaded data not exceed the minimum or exceed the maximum, it is generated a warning that is sent by mail, previously the mail should be enabled in the Configuration/Options/Advanced/Report of download by e-mail section. Press the Save button, to protect against data loss. Unit day’s edition In the units tab there is an option to delete selected days in case they have outliers. First select the unit you want to delete information from, then select the day and press the Delete button. It is also possible to clone the selected day’s information on the day we choose. User Manual - 9 4.2 Group definition Choose the option Groups in the Configuration menu to create unit groups and to simultaneously carry out actions on them (downloads or Chart representation of the comparison of total counts). 1 In the list on the upper side of the screen, all the defined groups are displayed. The table fields can be sorted by clicking on the name column. To select a group just click on the corresponding entry. 2 Like in the premises configuration menu, there is a panel to make searches and filters on the table that contains the group data. 3 Each group is defined by a name and the premises that are included in it. Optional commentaries can be added also. By default the application includes the group All, which inlcudes all the premises in the database. 1 2 3 Fig. 5 Group definition By using the buttons besides the table, you can add a new group to the database (New) modify its data (Edit) or erase it from the database (Delete). 4.3 Options The Options screen is placed inside the Configuration menu. You can modify the options of the application here. The window has two parts: General visible by default and Advanced only visible by clicking on the button Advanced placed in the lower part of the screen. User Manual - 10 1 2 3 Fig. 6 Options selection 1 You can set the number of levels displayed by default in the trend analysis and the starts of the working time (by default 00:00). In the Advanced option you can configure several concepts: 2 The advanced menu shows the database and count files location, and the interface language selection. By default the database application (countergraph.mdb) is stored, in Windows Vista and windows XP in the folder: C:\Documents and Settings\All Users\Program Data\Counter-Graph while the count file data is stored in the folder: C:\Documents and Settings\All Users\Program Data\CounterGraph\CountFiles. In Windows 7 the data base is stored in C:\ProgramData\CounterGraph\countergraph.mdb and the count file data in C:\ProgramData\Counter-Graph\countfiles. Inside the menu the following option is the selection of the interface language. Click on the drop down menu and select the language you want to use. 3 The application can send an e-mail with every download. In the Report of download by e-mail option, you can configure the sender e-mail’s address, the recipient’s address and the SMTP server. If the SMTP server needs authentication you should provide additional data. The e-mail can be sent with any downloads or only in case of warning or failure. The Show detailed info in report option shows the result for each unit. Besides the report, you can enclose the count files including the downloaded counts. Finally, once the data has been downloaded, it can be validated by setting a maximum and a minimum value, there is also the option to send a warning if within the selected days the variable value is zero. Once the modifications have been made, click on the button Apply if you want to keep them, bear in mind that you need to restart the application to apply the changes. If you have made a change, in the general menu and in the advance menu, that you don’t want to save, click on the button By Default to come back to the initial values. User Manual - 11 5 STEP 2: DATA DOWNLOAD Once you have defined the premises and/or groups where the PeCo units are installed, choose the Downloads option to define and carry out the counting data download. 1 The download can be manual or programmed, can be referred to a premise or to a group and can obtain all the data accumulated in the premise or the group during the last two years (6 months for Peco1 units), or only the incremental data from the last download. 1 2 Fig. 7 Download data screen 2 You can also find an event log panel here (Download, Date, Premises, Unit and Message) arranged chronologically, the last download is the first in the list, with data to track the carried out downloads. The download are showed arranged by the download number (AAAMMDDXXX, where AAAA is the year, MM the month, DD the day and XXX the daily download number), the information panel can be sorted by columns or through filters. To use the filters, first you have to select the Show Filters option and then the windows to introduce the filtering criteria will be created on the column top. This information can be exported as a text file in the folder: C:\Documents and Settings\All Users\Program Data\Counter-Graph or being deleted clicking on the Clean button. The logs previous to the last registered log in the download window are accessible by the Logs history button. User Manual - 12 5.1 Manual Download Performing a manual downloading the user can retrieve, from any defined unit or group, the data of the last two years accumulated in the unit (6 months for Peco1 units) or the incremental data from the last download. In the upper part of the screen is placed the area to define and execute a manual downloading. Select the local or the group and the type of download you wanted to do. Fig. 8 Manual download To start the process click on the Download Now button, you can cancel the download by clicking on the Cancel download button. At the upper right side of the screen you can find also information about the last download made (premises and date) 5.2 Schedule downloads With the schedule downloads the user can periodically and automatically make a download of the accumulated or incremental data of a premises or a group. Fig. 9 Schedule download Press in the Add download button a new window appear where you can configure the schedule downloads. User Manual - 13 Select the premise or the group and the download type, then select the frequency and in the Execution section select the Start hour and the Limit hour, press the Accept button to end the process. You can schedule multiple downloads with different timetables, premises and groups. Fig. 10 Schedule download 5.3 Data files The PeCo-Graph application automatically creates a folder for each premises/group registered in the database. In each folder the files of the download that has been made are stored By default the database application (countergraph.mdb) in Windows Vista and Windows XP, is stored in the folder: C:\Documents and Settings\All Users\Program Data\Counter-Graph while the count file data is stored in the folder: C:\Documents and Settings\All Users\Program Data\CounterGraph\CountFiles. In Windows 7 the data base is stored in C:\ProgramData\Counter-Graph\countergraph.mdb and the count data files are stored in C:\ProgramData\Counter-Graph\countfiles. The location of these files can be changed in the Option tab of the Configuration menu. Fig. 11 Count data files User Manual - 14 6 STEP 3: CHART CREATION Once the premises/groups have been defined and the corresponding counting data have been downloaded, the user can start with the generation of charts from the View Chart option of the main menu. In this screen the user can define the actions, view the resultant charts or connect to any unit in the database. Every time the user runs the application it will show by default the chart screen and it will display the last chart with which the user was working. 1 4 2 3 Fig. 12 View Chart screen 1 In the upper part bar are placed the working Chart icons, the list of all the premises that appears in the chart and the units to which they belong, and the unit connection icon. 2 In the Chart displaying panel, the following items are shown: the title of the selected Chart, the premises or group selected the variable, the interval and the total value of the selected data along with the generated Chart. 3 In the lower part of the screen there are two icons to move to the previous interval to the next and a series of buttons to change quickly the time interval of the chart data. It is also available the TODAY option that allows to place the graphic on the current day. 4 The total values are displayed superimposed in the Chart by clicking on the icon View Labels you can remove then. The working buttons changes according to the chosen chart. User Manual - 15 To define a chart, click on the Select chart icon . The application has 7 different predefined types of charts that are displayed in the drop down menu at the upper part of the screen: Chart of one variable. Chart of one day of the week Comparison between two intervals Comparison between two variables Accumulated data of multiple premises Accumulated data of multiple variables Accumulated data of all groups Each chart is defined by the selection of the variables and the chosen time interval. The time interval is defined by a certain length (1 – n days, 1 – n weeks) or by the start and end date of the time period. For each of the charts you can select the timetable range you want to get data from. The evolution and comparison charts can show the data in bar or lines form. The chart Accumulated data of multiple premises can choose the presentation between pie and bar chart, and the last two types of accumulated, multiple variables and all the groups, can be displayed only in bar charts. Chart of one variable Chart to see the evolution of the data of a variable during a period of time. The parameters to be defined are the premises or groups, the variables to be used and the period of time to be showed. The data will be displayed in hourly bars or in daily bars depending on the time interval chosen. Fig. 13 Chart of one variable User Manual - 16 Chart of one day of the week Chart to analyse the data obtained in a specific day of the week during a period of time (maximum of 52 weeks). The parameters to be defined are the premises, the variable and the period of time: total number of weeks to display or the beginning and end of the time period. The data will be displayed in weekly bars. Fig. 14 Chart of one day of the week Comparison between two intervals Chart to see the evolution of the same variable during two different periods. The parameters to be defined are the premises, the variable and two different time intervals defined by a starting date and the duration of the periods to compare. The data will be displayed in hourly or daily bars as corresponds. Fig. 15 Comparison between two periods User Manual - 17 Comparison between two variables Chart to compare two different variables in a time interval. You have to define the premises and the variables to be compared, the time interval and its day duration. The data will be displayed in hourly or daily bars as appropriate. Fig. 16 Comparison between two variables Accumulated data of multiple premises This chart is exclusive for groups. It compares the accumulated data of a premises group during a period of time. You have to select a group, a variable common to all of them and a time interval. The data will be displayed in a pie-chart with as many divisions as premises are in the group, differentiated with colours and with their corresponding values or in a bars chart. Fig. 17 Accumulated data of multiple premises User Manual - 18 Accumulated data of multiple variables This chart allows you to see the accumulated data of multiple variables from a premise or group. You must select a premise or group and a time interval. The data will be displayed with as many divisions as variables from the group or premise, differentiated with colours and with their corresponding values. Fig. 18 Accumulated data of multiple variables Accumulated data of all groups This chart is exclusive for groups. You can see the accumulated data of all groups. You have to select a variable common to all groups (Ex: TotalIn) and a time interval. The data will be displayed with as many divisions as groups defined. Fig. 19 Accumulated data of all groups User Manual - 19 6.1 Graphic templates: creation and management. Once you have defined a graphic with the variables and intervals, you can save this information as a template and recover it when you needed. Press on the Export data icon , on the drop down menu select the Save as template option, choose a name and save the selection. To recover the template, come back to the Export data menu and select the Load template option, you will recover the variables and intervals of the graphic with the current data. Finally the option Manage templates provides you access to the folder where all the templates are stored for its management. User Manual - 20 7 STEP 4: ANALYSIS In the main menu the analysis option allows to make a statistical study of the data to analyse its behaviour over a period of time. The daily results are gathered together when they display similar values and behavioural profiles. Click on the Select Chart icon and in the following window select the premises, the variable and the time interval. The interval is established by a starting and ending date or by its monthly duration 1 2 3 Fig. 20 Analysis screen 1 It appears a calendar in the left side of the screen, where are displayed 12 months starting from the date chosen as beginning date of the analysis. 2 On the right-hand side, there is a graph that displays the trend curves corresponding to the selected data, which depends on the number of different behavioural groups to be displayed. The application can display up to 7 groups that reflect different behaviours. For example: weekends, closing days… The application automatically groups the days in sets of similar behaviour, based on the counting data. Each group is identified in the calendar by a colour, which corresponds with the colour of the curve that represents graphically the data being sought. User Manual - 21 3 In the lower part of the screen there are two icons to move from the previous time interval to the next. The chart data can be adjusted by selecting days or groups to visualize in detail or ignoring days and groups that have an atypical behaviour. Fig. 21 Adjustment of data in the analysis Chart Placing the right mouse button over a day, you can select this day or the group that it belongs to and see how the curve displays the corresponding values in detail. If you want to go back to the initial status, click on the Remove selection option. Similarly you can ignore this day or the group that it belongs to and get a recalculated Chart without its values. To go back to the initial status, click on the Restore button. User Manual - 22 8 STEP 5: EXPORT DATA The application can keep and export the information relative to the counting data and the generated charts. Click on the Export data button placed in the upper part of the window to open the available options. These options change depending on if they are in the view charts or in the analysis screen. For a chart these are the following options: Open: to open a stored chart definition (*.cgf) Save: to save the current chart as a chart definition file (*.cgf) Export to CSV: to save chart data as CSV format. Export to image: to save the current chart as a .jpeg file. Copy to clipboard: to copy the current chart (as .bmp) to the clipboard. Print preview: to preview the chart before printing. Page setup: to modify the print options (margins, paper, etc.) Print: to print the current chart on the selected printer. In the Analysis screen the export options are the following: Copy to clipboard: to copy the calendar and the trend curves to the clipboard Print preview: to preview the chart before printing. Print: to print the current chart in the selected printer. User Manual - 23 9 HELP MENU In the main menu there is a Help icon where besides the user manual (this document), the user can find the option About, which contains information about the version of the installed on application. Fig. 22 Installed version The user manual in Windows XP and Windows Vista must be in this directory: C:\Documents and Settings\All Users\Program Data\Counter-Graph\ In Windows 7 should be in this directory: C:\ProgramData\Counter-Graph\ The format of the user manual name is the following: CounterGraph_UserManual_XX.pdf Where XX corresponds to the language acronyms (ES, EN, FR, IT, PT, PL, SI, HR AND NL) User Manual - 24 Appendix 1- Creation of imported counter The PeCo-Graph application offers the option to define imported counters. These counters contain external data and can be used to complete the information supplied by the calculated variables. Once the data that it’s going to be imported is selected (sales figures, etc.) the process to create and import these counters is manual, for further information about the creation and use of imported counters please contact us by the web www.visual-tools.com User Manual - 25 ENGLISH PECO-GRAPH User manual DOCPECOGRAPHUMEN_140414v300