1
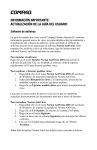
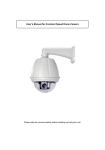
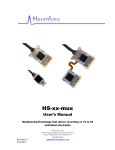
ATST Site Survey Phase Two
Instrument User Manual
Revision Date
4/28/2004
Mark Komsa
NSO Sac Peak
[email protected]
505-434-7118
1
Table of Contents
1.0
Scintillometer System
1.1 System Components
1.1.1
Sensor Assembly…………………….………...….…3
1.1.2
Scintillometer Data Logger…………..……………...4
1.2 Setup…………………..……………………………….………4
1.3 Operation ...……………………………………………………5
1.4 Maintenance……………………………………………………5
2.0
Sonic System
2.1 System Components
2.1.1
CSAT3 3D Sonic Anemometer……………………..7
2.1.2
KH-20 Hygrometer………………………………….8
2.1.3
Prometheus Single Board CPU……………………...9
2.2 Setup…………………………………………………………...9
2.3 Operation .……………………………………………………11
2.4 Maintenance………………………………………………….12
3.0
Motor Control System
3.1 System Components
3.1.1
Encoder Assembly…………………………………13
3.1.2
Sensor Boom Assembly……………………………13
3.1.3
Motor Controller…………………………………...14
3.2 Setup………………………………………………………….14
3.3 Operation……………………………………………………..16
3.4 Maintenance………………………………………………….17
4.0
System Logbook Database………………………………………...18
5.0
Appendix
5.1
5.2
5.3
A.
B.
C.
Scintillometer System……………………………...…20
Sonic System………………………………………….21
Motor Controller………………………………………22
2
1.0 Scintillometer System
The Scintillometer System consists of three diode sensors mounted at three different
heights and electronics to extract both the steady signal (the solar intensity) and the rapid
variations of the signal (the scintillation). The diode sensor signals are routed to an
amplifier board for amplification and bandpass filtering. The output of the amplifier
board is routed to an A/D converter located in the PCMCIA slot of a laptop Windows PC.
This PC runs s custom windows application that processes the signals and then saves
them to disk for latter analysis. This laptop PC also runs another windows program to
display the sonic system sensor position angles.
1.1
System Components
1.1.1
Scintillometer Sensor Assembly
The sensor used is a UDT PIN10 DP photodiode. Figure 1
shows the spectral response of this photodiode. In front of the
photodiode is a green CVI CG-BG-18-1-3 filter. In front of the
green filter is a ground glass diffuser. A fully adjustable sensor
mount allows a wide range of pointing position adjustment.
Figure 1
The assembled sensor hardware is shown in Figure 2.
3
Figure 2
1.1.2
Scintillometer Data Logger
The Scintillometer Data Logger is housed in a small weathertight metal enclosure. Inside this enclosure is a Compaq
Presario laptop, 6 channel amplifier card, Encoder interface
and three power supplies.
1.2
Setup Procedure
1.2.1
The scintillometer sensor at each level is pointed due south
along the meridian and an altitude that matches the suns
average altitude during the deployment period.
1.2.2
Refer to the scintillometer cabling diagram in Appendix A of
this manual.
1.2.3
Connect a long RG59 coaxial cable to the BNC connector
located at the back of each scintillometer sensor assembly.
1.2.4
Plug the other end of this coaxial cable to the 6 connector
Breakout Box that is located at ground level. The lowest level
plugs into the BNC connector labeled 1. The middle level
plugs into connector number 2. The top level plugs into
connector number 3.
4
1.3
1.4
1.2.5
Connect the 12 pin connector scintillometer cable into the
Breakout Box connector J7.
1.2.6
The other end of the 12 pin connector scintillometer cable
plugs into J3 located on the side of the Scintillometer Data
Loggers metal enclosure.
1.2.7
Connect the AC power cable to J1.
Operation
1.3.1
The Scintilometer System should be run for about three hours
before and after the sun crosses the local meridian, ie. 10 am –
4 pm DST.
1.3.2
Open the Scintillometer electronics enclosure lid and power up
the laptop PC by pressing the power switch. It is located in the
top left corner above the keyboard. The PC will now boot to
the desktop after a minute or two.
1.3.3
At the Windows Desktop, click on the Scintillometer Data
Logger icon to start the application.
1.3.4
A setup window appears that allows changes to be made to the
program settings. Click on the ‘No Changes’ button’.
1.3.5
The main screen then loads and displays the Scintillometer
signals graphically. Click on each channel’s selection control
to verify that each channel is producing a valid signal (not
flatlined).
1.3.6
The DC gain of the signal amplifiers has been adjusted to
prevent saturation (signal>10vdc) when the scintillometers are
pointing directly at the sun.
1.3.7
Close the enclosure lid until it is time to power down the PC.
(Adjust the sensor positions before closing the lid. See the
Motor Controls section of this manual)
Maintenance
1.4.1
The Scintillometer System requires very little maintenance.
1.4.2
If one of the Scintillometer’s DC signals drops considerably
from the previous days level, this may indicate that this sensor
5
may have dirt or other foreign matter covering the sensor
aperture. Clean the aperture with a swab and distilled water.
6
2.0 Sonic System
The sonic system consists of a Campbell Scientific 3D Sonic Anemometer and a KH20
Hygrometer sensor mounted at three different heights and electronics to extract Cn²(h)
from the sensor data. A single board computer receives the raw sensor data and digitizes
it. This single board computer is connected to another laptop PC dedicated to this task via
a LAN. This laptop collects the data a saves it to disk for latter analysis. Both of these
computers use the Linux OS.
2.1
System Components
2.1.1
CSAT3 3D Sonic Anemometer
The sonic anemometer must be mounted in a vertical position when in use
as shown in Figure 3.
Figure 3
The CSAT3 3-D Sonic Anemometer has a 10 cm vertical measurement
path, operates in a pulsed acoustic mode, and withstands exposure to harsh
weather conditions. Three orthogonal wind components (ux, uy, uz) and
the speed of sound (c) are measured and output at a maximum rate of 60
Hz. Analog outputs and two types of digital outputs are provided.
Measurements are triggered from a PC generated RS-232 command.
Figure 4 shows the sensors dimensions.
7
Figure 4
2.1.2
KH20 Hygrometer
The KH20 is a highly sensitive hygrometer for measuring rapid
fluctuations in atmospheric water vapor. It outputs a dc voltage
proportional to the humidity. It requires a 12 volt dc power source for
operation. Figure 5 shows the incorrect mounting orientation. The
Detector Tube (shorter tube) must be pointing away from the Sun, ie.
normally to the north and down, to minimize solar radiation errors.
Figure 5
8
2.1.3
Prometheus Single Board CPU
2.1.3.1
Figure 6 shows the CPU and it’s 5 volt power
supply mounted in a weather-tight enclosure. The
large 12 volt power supply shown provides power
to the sensors.
Figure 6
2.2
2.1.3.2
The small 4 terminal connector block is used to
bring out the 12 volts to a convenient point for
connecting to the sensor cable.
2.1.3.3
An RS232 connector is used for each sensor.
Comm2 is not used for this application.
Setup Procedure
2.2.1
Refer to the sonic systems cabling diagram in the appendix of
this manual.
2.2.2
Connect the braided cable from the CSAT 3 sensor to the
Transducer Head Connector on the CSAT 3 electronics
interface box.
9
2.2.3
Connect a 100 foot cable that has the 12 pin connector to the
CSAT 3 electronics interface box RS-232 Connector.
2.2.4
Plug the other end of this cable to the appropriate modular
connector on the Prometheus CPU Box. Note the sensor height
labels for each level.
2.2.5
Attach the black (ground) and brown (+12vdc) pigtail wires to
their respective colored wires on the terminal block inside the
Prometheus CPU Box.
2.2.6
Connect the 4 pin connector sensor cable from the KH20
sensor to the KH20 electronics interface box.
2.2.7
Carefully connect the small coaxial connector cable from the
KH20 sensor to the sensor coaxial connector on the KH20
electronics interface box.
2.2.8
Connect the short 7 pin to 6 pin Connector Adapter Cable to
the KH20 connector labeled ‘Power Supply and Signal
Output’.
2.2.9
Connect the signal and power cable to the other end of the
Connector Adapter Cable.
2.2.10
Connect the other end of signal and power cable to the CSAT 3
electronics interface box connector labeled ‘+12V SDM’.
2.2.11
Plug the 150 foot long LAN crossover cable into the modular
Ethernet connector on the Prometheus CPU box.
2.2.12
Plug the other end of this LAN cable into the network
connector located on the back panel of the Linux Compaq
Presario laptop. This laptop is to be located indoors.
2.2.13
Plug one end of a short standard network cable into the Linux
laptop’s 3Com PCMCIA network adapter.
2.2.14
Plug the other end of this short network cable into the
observatory sites Ethernet network.
10
2.3
Operation
2.3.1
Power up the Linux Sonic System Compaq Presario Laptop
that is located indoors and connected to the network. Enter the
username and password.
2.3.2
After the Sonic System Laptop has finished booting and is at
the Linux Desktop, apply power to the Prometheus CPU box.
The green power LED will now illuminate.
2.3.3
After about 45 seconds the Sonic Data System graphical user
interface application should start automatically. This
application is called ‘Cockpit Cosmos’.
2.3.4
To verify that the system is operating normally, observe the
graphical displays (It takes about 60 seconds after power-up to
see the first data samples).
2.3.5
Each sensor level has eleven small graphical displays. The
legend for each display has the level appended to it.
2.3.6
If there is a major problem with a sensor the graph will be
replaced with a ‘RIP’ graphic.
2.3.7
The Sonic System sensors must be maintained at vertical
orientation. Refer to the Motor Controls section of this manual.
2.3.8
The Sonic System data is written to the disk automatically. The
3Com Ethernet link is used to access the disk data for analysis
from a remote location.
2.3.9
The Sonic System will run 24/7. Therefore, it is not necessary
to power the system down each day. Only power down the
system if major maintenance is required.
2.3.10
If it is necessary to power down the system, perform the
following steps:
2.3.11
Shut down the Sonic Program by clicking on the ‘Quit’
button.
2.3.12
Power down the Linux laptop.
2.3.13
Power down the Sensors and Prometheus CPU last.
2.3.14
Make a new logbook entry.
11
2.3.15
2.4
To restart the system, perform the following steps:
2.3.15.1
Power up the Linux Compaq laptop. Wait for the
Desktop screen to appear before proceeding to the
next step.
2.3.15.2
Power up the Sensors and Prometheus CPU.
2.3.15.3
About 45 seconds after the previous step, the
Cockpit Cosmos application should load it’s
graphical display on the laptop’s screen.
2.3.15.4
Make a new logbook entry.
Maintenance
2.4.1
The Sonic System requires very little short-term maintenance.
2.4.2
If the Hygrometer sensor signal voltage drops below a
specified level, the sensor windows may have developed
scaling deposits. This can be removed with distilled water
applied gently with a soft cotton swab. The system can be left
running while this is performed. Be sure to make a long entry
at the time that this procedure was done.
2.4.3
The Sonic sensor signal voltage will drop if the sensors
surfaces get wet from rainfall. The signal levels will return to
normal after the sensor surfaces dry out.
12
3.0 Motor Control System
The motor controller system consists of a long boom, DC gearmotor and DC linear
actuator mounted at three different heights and electronics to allow tip tilt position
adjustment of the sensor heads. Digital Inclinometers are used to provide position
measurements. A sensor tip tilt position accuracy of one degree or better is required with
respect to vertical.
3.1 System Components
3.1.1
Encoder Assembly
The Encoder Assembly consists of two US Digital absolute position
encoders mounted at right angles to each other. The encoders use a
modified RS-485 scheme called SEI. Each encoder has a unique address
and serial number assigned to it. All of the encoders are wired in a parallel
configuration. The encoder signal cabling is daisy-chained at each level.
The encoder signals are routed to the Scintillometer electronics enclosure
via connector J3. An adapter inside this box converts the signals to a RS232 format. The output of this adapter connects directly to the Windows
laptop PC’s serial port.
A software application developed for this project reads the data from the
encoders and displays the sensor angles to the nearest one-tenth degree
with respect to vertical.
3.1.2
Sensor Boom Assembly
The Sensor Boom Assembly consists of three sensors mounted on a 10
feet long boom. A DC gearmotor is coupled to the rotation axis via a
rotating disk and lever arm. A DC linear actuator is configured to raise and
lower the boom. The entire assembly is designed to attach to a crane boom
or other flat surface using threaded rods and backplates. Refer to Figure 7
for more information.
13
Figure 7
3.1.3
Motor Controller
The motor controller consists of a 12 volt DC power supply and motor
control switches. A battery charger is used as the power source. This
charger has a voltage select switch to lower the voltage to 6 volts to
provide for slower motor speeds. A High/Low motor speed switch was
also incorporated that switches a large power resistor inline to provide for
even slower motor speeds if required. The power supply output is also
short circuit protected. The power input is derived from a 120 VAC
connection. This entire assembly is mounted in a rugged weather-tight
metal enclosure.
3.2
Setup
Attach the sensor boom assemblies to the support structure (crane or tower) at the
heights shown in Figure 8. Front and back mounting plates are used. Large nuts
on threaded rods draw the mounting plates tightly to the support structure.
Tighten the nuts to 180-200 in/lbs.
14
Figure 8
15
3.3
3.2.1
Attach a 100 foot long heavy duty motor control cable to each
motor.
3.2.2
Attach the other end of each motor cable to the appropriate
motor controller connector for each level.
3.2.3
Connect the encoder cables to the encoder boxes. The three
encoder cables use a 8 pin connector at each end. Three
different lengths of encoder cables are used. Refer to the
encoder cabling diagram in Appendix C of this manual for
more information.
Operation
3.3.1
Use the power switch to turn the supply on and off as required.
3.3.2
The sensor positions should be checked in the morning and
after lunch.
3.3.3
An application on the Compaq Presario Windows laptop
displays the sensor position angles. Click on the Sensor Angles
icon to start this application.
3.3.4
Beginning at the lowest level, observe the sensor angle
displays. A sensor assembly is vertical if the sensor angle
display reads ‘0’.
3.3.5
If the sensor angle displayed is not within one degree of
vertical it will be necessary to adjust the position of the sensor.
3.3.6
A double throw toggle switch is provided to adjust each
sensor’s position. Push the toggle switch up to move in one
direction and down to move in the opposite direction.
3.3.7
Try to adjust the sensor position until it reads close to ‘0’ on
both axis’.
To prevent a possible overload condition only
one motor should be activated at a time.
3.3.8
Make a logbook entry any time the sensor positions are
adjusted.
3.3.9
The Linux laptop has a logbook program that is to be used for
making log entries. Refer to Logbook section of this manual
for information on how to use this program.
16
3.4
Maintenance
Short-term maintenance of the motor control system is not required.
17
4.0 System Logbook Database
A custom application that runs on the Linux laptop PC is to be used to provide a
logbook database of the operational status of the Site Survey Phase Two
instruments. This Linux application is called ‘Logbook’.
4.1
Double-click on the LOGBOOK icon to start this program.
4.2
A window will appear that lists all of the logbook entries starting with the
last entry. The title bar text for this window is ‘tklog’.
4.3
A command toolbar with 10 selections appears at the top of the logbook
window. These toolbar commands are used to perform specific actions.
4.4
A full description of all of these commands is beyond the scope of this
manual. Just enough detail will be provided to allow the instrument
operator to make log entries.
4.5
Click on the ‘New’ toolbar button to make a new log entry into the
logbook database. A new window will appear. The title bar text for this
window is ‘entry’.
4.6
Click on the Author toolbar command button to select your name from the
author list. If your name does not appear on the list you can use the
Options-Edit Author List toolbar command on the ‘tklog’ window to enter
it.
4.7
Next, click on the ‘Type’ toolbar button to bring up a list of entry types.
Select ‘Log’ if this is a normal log entry. If there is a specific problem,
select an appropriate type from the list.
4.8
Next, click on the ‘Site’ toolbar button and select your site.
4.9
Finally, move the mouse cursor to the gray text entry area under the Title
legend. Enter the title text that will appear when you return to the main
screen.
4.10
Now you are ready to enter the text for your log entry. Move the mouse
cursor to the large gray text entry area and type your log entry.
4.11
Click on the large gray ‘Done’ button when you have finished typing your
log entry to return back to the main display screen.
4.12
Click on the File-Save and Exit toolbar button to save your new log entry
and exit the program.
18
4.13
The log data for this program is stored with the following file path:
/usr/local/aster/projects/atst/logbook. This log file will be accessed
remotely via the Internet.
19
5.0 Appendix
5.1
A.
Scintillometer System
20
5.2
B.
Sonic System
21
5.3
C.
Motor Controller
22