1
Squidy
A Zoomable Design Environment for Natural User Interfaces
Master Thesis for the degree
Master of Science (M.Sc.) in Information Engineering
Universität Konstanz
Department of Computer and Information Science
by
Roman Rädle
(01/546759)
1st Referee: Prof. Dr. Harald Reiterer
2nd Referee: Prof. Dr. Marc H. Scholl
Konstanz, September 2010
ii
iii
I dedicate this master thesis to my parents and siblings for their constant support in
all my endevours.
Meinen Eltern und meinen Geschwistern, die mich in meinen Vorhaben stets
unterstützt und ermutigt haben.
iv
Abstract
Today’s interaction between humans and computers does not significantly differ from
the interaction that was provided through the early “personal computers” in the 1980s.
Hence, keyboard and mouse are still predominant in standard computer products regarding
the consumer market. Nevertheless, the popular gaming console Wii manufactured by
Nintendo has proven the feasibility of new input device technologies employing full body
interaction, which furthermore were exceedingly accepted by known gamers as well as
casual users all over the world. This example shows the favor for new interaction techniques
that feature a high usability as they are easy to use, easy to remember, and last but not
less important enjoyable.
In the next section, we briefly introduce the nature of such interfaces and interaction techniques by giving a history of user interfaces. We present an overview of, user interfaces
like the first “command-line interface”, “graphical user interface”, and novel interfaces
underlying the concept of a “natural user interface”. Such natural user interfaces offer an
entirely free space to equip the human-computer interaction with further devices beyond
keyboard and mouse. Nevertheless, interaction designers are not well supported by current
toolkits and frameworks although the awareness of the necessity of a more natural interaction is widely accepted. The main contribution of this thesis is the provision of concepts
for a design environment, Squidy, that supports interaction designers in the creation of
more natural interaction techniques. Therefore, we establish eleven criteria necessary for
an interaction design tool to specify the needs and requirements of users responsible for
the interaction design. These criteria can furthermore be used to compare tools available
for the development of interaction techniques. In contrast to existing frameworks and
toolkits, which aim at the support of interaction designers only, Squidy offers a single
user interface for all users involved in the interdisciplinary process of interaction design.
Since the intention of an interaction designer is to create an interaction technique to allow
end-users a more usable and enjoyable interaction, these users form an important group
as well as interaction developers integrating device drivers and implementing novel filter
techniques. The interaction library Squidy faces the challenges of an interaction design
toolkit as well as the heterogeneous groups of users by implementing several user interface
concepts and software engineering patterns.
An important aspect of Squidy is the ability to visually define interaction techniques.
This is realized by a visual programming language combined with dataflow programming
that form a dataflow visual programming language. Thus, users with less or no programming experience are supported by such a visual programming language. Furthermore,
the dataflow programming allows the usage of the ”pipe-and-filter” software design pattern, which provides a simple dataflow metaphor to the users of Squidy. Squidy is based
v
vi
on the concept of semantic zooming to provide details on demand and thus keeps the
threshold at a minimum for beginners but offers high ceiling for more advanced users.
Additionally, as Squidy provides a homogeneous design environment to all users, these
users stick to a single application and do not need to switch to another application when
gaining more knowledge and expertise and thus can build upon pre-existing knowledge.
Because the design of interaction techniques is a highly iterative process, Squidy offers an
interactive mode where adjustments on properties of input/output devices and filters are
applied immediately to the interaction technique. Thus, interaction designers instantly
comprehend the cause and effect of property changes. Furthermore, users are able to
rapidly switch filter techniques of an interaction technique on and off in order to test and
evaluate different approaches. The rapid prototyping can be very error-prone, however,
Squidy supports users with a visual debugging facility that gives insights into the current
dataflow. Furthermore, a visual glow effect notifies users about the status of nodes and
pipes (e.g. red color indicates an error). Squidy offers the ability to develop new filter
techniques within the design environment and as a result, users do not need to switch
between different IDEs1 . The interaction library also offers the possibility to reduce large
interaction techniques into smaller compositions and at the end assemble these partially
solved solutions to a complete interaction technique by providing hierarchical pipelines.
This is useful since dividing problems into smaller sub-problems has been proven as very
useful concerning large problems. Additionally, we questioned interaction designers in
order to identify design flaws that are critical for the usability. For the same reason, a
focus group was conducted and ten participants with a background in interaction design
were asked in a discussion to give advice. Additionally, a formative evaluation study has
been carried out to analyze the usability of the interaction library Squidy. This study
has been conducted with 10 participants at a one-day workshop. The participants had to
solve pre-defined tasks with rising difficulty. The qualitative and quantitative results of
the evaluation are presented in this thesis as well as the claimed tasks (e.g. measured task
completion times, questionnaires and interviews).
Aside from the usability study, the usage of the interaction library Squidy is exemplified by an implementation of an interaction technique to control Microsoft PowerPoint
presentations using a laser pointer as input device.
This thesis concludes with future work and an outlook. The substance of the future work
results from the formative evaluation study, which can improve the usability of Squidy.
Additionally, the outlook exemplifies the transferability of the implemented concepts of
Squidy to the field of databases and information systems, which helps users to visually
define relational algebra.
1
IDE – Integrated Development Environment (e.g. Microsoft Visual Studio)
Zusammenfassung
Die heutige Interaktion zwischen Mensch und Computer unterscheidet sich nicht signifikant von der Interaktion, die in den 80er Jahren durch die frühen “Personal Computer”
zur Verfügung gestellt wurden. Daher sind Tastatur und Maus noch immer vorherrschend
in den derzeit auf dem Verbrauchermarkt verfügbaren Standard Computer Produkten.
Dennoch zeigt die beliebte und von Nintendo produzierte Spielekonsole Wii, dass GanzkörperEingabetechniken (z.B. Gesten) möglich sind und auf der ganzen Welt von eingefleischten
Spielern wie auch gelegentlichen Spielern angenommen wurden. Dieses Beispiel verdeutlicht die Machbarkeit von neuen und post-WIMP Interaktionstechniken und zeichnet sich
durch die Eigenschaften “einfach zu bedienen” (easy to use), “leicht zu merken” (easy to
remember) und nicht zuletzt “Spaß an der Bedienung” (enjoyable) aus.
Im nächsten Abschnitt werden Interaktionstechniken von Benutzerschnittstellen entlang
ihrer Historie erläutert. Dadurch kann der Leser sich einen Überblick über konventionelle Benutzeroberflächen verschaffen, wie z.B. das erste “Command-Line Interface”, die
grafische Benutzeroberfläche, und neuartige Schnittstellen die den Konzepten der “natürlichen Benutzeroberfläche” unterliegen. Solch natürliche Benutzeroberflächen bieten völlig
neue Möglichkeiten die Mensch-Computer-Interaktion mit weiteren Geräten – über Tastatur und Maus hinaus – anzureichern. Dennoch werden Interaction Designer von aktuellen Toolkits und Frameworks hierin unzulänglich unterstützt, obwohl das Bewusstsein
und die Notwendigkeit für eine natürlichere Interaktion besteht. Der Kernpunkt dieser
Arbeit bildet die Entwicklung von Konzepten für die Design-Umgebung Squidy. Diese
Konzepte sollen Interaction Designer bei der Entwicklung von natürlichen Interaktionstechniken besser unterstützen. Es werden elf Kriterien ausgearbeitet die Bedürfnisse und
Anforderungen solcher Anwender aufzeigen. Außerdem können diese Kriterien verwendet
werden, um Werkzeuge für die Entwicklung von Interaktionstechniken gegenüberzustellen
und zu vergleichen. Im Gegensatz zu den bestehenden Frameworks und Toolkits, die
lediglich Interaction Designern Hilfe leisten, bietet Squidy eine einzige Benutzeroberfläche für alle in den interdisziplinären Prozess des Interaction Design involvierten Benutzer. Das Ziel eines Interaction Designers ist es Interaktionstechniken zu schaffen,
welche Endnutzern ein bessere und angenehmere Interaktion mit Computern ermöglichen.
Diese Endnutzer bilden zusammen mit den Interaction Designern und den Interaction
Entwicklern eine wichtige Benutzergruppe und werden deshalb in der Interaktionsbibliothek Squidy berücksichtigt. Ein Interaction Entwickler ist verantwortlich für die Integration von Gerätetreibern und die Entwicklung von neuartigen Filtertechniken. Die
Interaktionsbibliothek Squidy stellt sich den Herausforderungen an ein Interaktion Design Toolkit sowie den heterogenen Gruppen von Benutzern dadurch, dass verschiedene
Benutzerschnittstellen-Konzepte und Software Engineering Patterns entwickelt und implevii
viii
mentiert werden.
Ein wichtiger Aspekt in Squidy ist die Möglichkeit Interaktionstechniken visuell zu definieren.
Dies wird durch eine visuelle Programmiersprache in Kombination mit Datenflussprogrammierung realisiert. Somit kann Squidy in die Gruppe der Dataflow Visual Programming Languages kategorisiert werden. Benutzer mit wenig oder gar keiner Programmiererfahrung werden von einer visuellen Programmiersprache besser unterstützt.
Darüber hinaus ermöglicht die Datenflussprogrammierung die Nutzung des ”Pipe-andFilter” Software-Design-Patterns und bietet den Nutzern von Squidy eine einfache DatenflussMetapher. Des Weiteren basiert Squidy auf dem Konzept des semantischen Zoom, wobei
Details erst auf Nachfrage des Benutzers dargestellt werden und dieser nicht mit unwichtigen Informationen überfordert wird. Aufgrund dessen ist die Einstiegshürde für Anfänger
geringer. Dennoch können mit Squidy sehr anspruchsvolle Interaktionstechniken entwickelt werden und es werden somit auch erfahrenere Interaction Designer unterstützt. Eine
homogene Design-Umgebung für alle Benutzer fördert deren Wissens- und Kompetenzaufbau, da diese nicht zwischen mehreren Anwendungen wechseln müssen und dadurch
auf ihren bereits gewonnenen Erfahrungen aufbauen können. Des Weiteren stellt Squidy
einen interaktiven Modus zur Verfügung und erleichtert hiermit den iterativen Prozess des
Interaction Design. Mit diesem können zur Laufzeit Anpassungen an den Eigenschaften
von Input/Output-Geräten und Filtern einer Interaktionstechnik vorgenommen werden
und sind dabei unverzüglich in der Interaktion spürbar. So können Interaction Designer
sofort die Ursache und Wirkung der veränderten Eigenschaft nachvollziehen. Darüber
hinaus sind Anwender in der Lage, schnell Filtertechniken einer Interaktionstechnik anund ausschalten, um verschiedene Ansätze zu testen und zu evaluieren. Dieses rasche
Prototyping kann sehr häufig zu Fehlern in der Interaktionstechnik führen, deshalb assistiert Squidy den Benutzern mit einer visuellen Debugansicht, welche Einblicke in den
aktuellen Datenfluss ermöglicht. Darüber hinaus benachrichtigt ein visueller Leuchteffekt
den Benutzer über den Status von Nodes und Pipes (z.B. ein rot leuchtender Hintergrund deutet auf einen Fehler hin). Squidy bietet die Möglichkeit neue Filtertechniken
innerhalb der Design-Umgebung zu entwickeln, wodurch Benutzer nicht gezwungen sind
zwischen verschiedenen IDEs2 zu wechseln. Weiterhin ermöglicht die Interaktionsbibliothek umfangreiche Interaktionstechniken in kleinere Kompositionen aufzuteilen, isoliert
zu behandeln und gelöste Teilprobleme am Ende zu einer hierarchischen Pipeline zusammenzufügen. Hierbei bekräftigt die Erkenntnis, dass eine Aufteilung eines komplexen
Problems in kleinere Teilprobleme, aus Sicht der Lern- und Gedächtnispsychologie, positive Auswirkungen auf das Result haben kann. Während der Entwicklung von Squidy
wurden regelmäßig potentielle Anwender befragt, um Designfehler zu identifizieren und
diesen vorzubeugen. Zusätzlich dazu wurde eine Fokus-Gruppe durchgeführt. Die 10 Teilnehmer der Fokus-Gruppe, alle mit einem Hintergrund in Interaction Design, gaben in
einem Diskurs Ratschläge für das Design der Benutzerschnittstelle von Squidy. Des Weiteren wurde die Bedienfreundlichkeit der Interaktionsbibliothek Squidy in einer formativen
Evaluationsstudie gemessen. Diese Studie wurde mit 10 Teilnehmern in einem “Ein-TagesWorkshop” durchgeführt. Die Teilnehmer mussten vordefinierte Aufgaben mit steigender
Schwierigkeit lösen. Die qualitativen und quantitativen Ergebnisse sowie die Aufgaben der
Evaluation werden in dieser Arbeit vorgestellt (z.B. gemessene verbrauchte Zeit für eine
2
IDE – Integrated Development Environment (e.g. Microsoft Visual Studio)
ix
Aufgabe, Fragebögen und Interviews).
Ferner wird die Anwendbarkeit der Interaktionsbibliothek Squidy anhand einer implementierten Interaktionstechnik zur Steuerung von Microsoft PowerPoint exemplarisch demonstriert.
Diese Arbeit schließt mit einem Ausblick auf Verbesserungen sowie der Übertragbarkeit
der in Squidy implementierten Konzepte in eine andere Domäne ab. Der Inhalt der zukünftigen Arbeit besteht aus den Ergebnissen der formativen Evaluationsstudie, welche die
Benutzerfreundlichkeit von Squidy verbessern können. Die in Squidy implementierten
Konzepte werden beispielhaft auf die Domäne der Datenbanken und Informationssysteme
übertragen. Hierbei sollen Anwender während der Beschreibung von Relationaler Algebra
visuell unterstützt werden.
x
Publications
Parts of this thesis were published in:
Roman Rädle, Werner A. König, and Harald Reiterer. Temporal-Spatial Visualization of
Interaction Data for Visual Debugging. Poster Session. 2009.
Werner A König, Roman Rädle, and Harald Reiterer. Interactive Design of Multi- modal
User Interfaces - Reducing technical and visual complexity. Journal on Multimodal User
Interfaces, 3(3):197–213, February 2010.
Werner A. König, Roman Rädle, and Harald Reiterer. Squidy: A Zoomable Design Environment for Natural User Interfaces. In CHI 2009 Extended Abstracts on Human Factors
in Computing Systems, New York, NY, USA, 2009. ACM.
xi
xii
Conventions
Throughout this thesis the following conventions are used:
• The plural “we” will be used throughout this thesis instead of the singular “I”, even
when referring to work that was primarily or solely done by the author.
• Unidentified third persons are always described in male form. This is only done for
purposes of readability.
• Links to websites or homepages of mentioned products, applications or documents
are shown in a footnote at the bottom of the corresponding page.
• Throughout this thesis the definition of human-computer interaction is a synonym
for human-machine interaction as well as man-machine interaction.
• Throughout this thesis the terms interaction library and design environment are
used equivalently.
• References follow the ACM citation format.
• The whole thesis is written in American English.
• A DVD, attached to this thesis includes an electronic version of this document,
sketches, low- and high-fidelity prototypes, binaries and source code of the developed
interaction library Squidy, evaluation documents, and videos
xiii
xiv
Contents
1 Introduction
1.1 Motivation . . . . . . . . . . . . . . . . . . . . . . . . . . . . . . . . . . . .
1.2 Outline . . . . . . . . . . . . . . . . . . . . . . . . . . . . . . . . . . . . . .
2 Introduction of User Interfaces
2.1 Command-Line Interface . . . . . .
2.2 Graphical User Interface . . . . . .
2.3 Natural User Interface . . . . . . .
2.3.1 Human Modalities . . . . .
2.3.2 Three Zones of Engagement
1
1
5
.
.
.
.
.
.
.
.
.
.
.
.
.
.
.
.
.
.
.
.
.
.
.
.
.
.
.
.
.
.
.
.
.
.
.
.
.
.
.
.
.
.
.
.
.
.
.
.
.
.
.
.
.
.
.
.
.
.
.
.
.
.
.
.
.
.
.
.
.
.
.
.
.
.
.
.
.
.
.
.
.
.
.
.
.
.
.
.
.
.
.
.
.
.
.
7
8
10
12
12
13
3 Challenges
3.1 Criteria on a Design Environment . . . . .
3.1.1 Application Programming Interface .
3.1.2 Ready-to-use components . . . . . .
3.1.3 Reuse of components . . . . . . . . .
3.1.4 Manageable complexity . . . . . . .
3.1.5 Component suggestion . . . . . . . .
3.1.6 Multi-platform support . . . . . . .
3.1.7 Expandability / extensibility . . . .
3.1.8 Embedded source code . . . . . . . .
3.1.9 Direct manipulation . . . . . . . . .
3.1.10 Versioning . . . . . . . . . . . . . . .
3.1.11 Multimodal interaction . . . . . . .
3.2 User Roles . . . . . . . . . . . . . . . . . . .
3.2.1 End-User . . . . . . . . . . . . . . .
3.2.2 Interaction Designer . . . . . . . . .
3.2.3 Interaction Developer . . . . . . . .
3.2.4 Framework Developer . . . . . . . .
.
.
.
.
.
.
.
.
.
.
.
.
.
.
.
.
.
.
.
.
.
.
.
.
.
.
.
.
.
.
.
.
.
.
.
.
.
.
.
.
.
.
.
.
.
.
.
.
.
.
.
.
.
.
.
.
.
.
.
.
.
.
.
.
.
.
.
.
.
.
.
.
.
.
.
.
.
.
.
.
.
.
.
.
.
.
.
.
.
.
.
.
.
.
.
.
.
.
.
.
.
.
.
.
.
.
.
.
.
.
.
.
.
.
.
.
.
.
.
.
.
.
.
.
.
.
.
.
.
.
.
.
.
.
.
.
.
.
.
.
.
.
.
.
.
.
.
.
.
.
.
.
.
.
.
.
.
.
.
.
.
.
.
.
.
.
.
.
.
.
.
.
.
.
.
.
.
.
.
.
.
.
.
.
.
.
.
.
.
.
.
.
.
.
.
.
.
.
.
.
.
.
.
.
.
.
.
.
.
.
.
.
.
.
.
.
.
.
.
.
.
.
.
.
.
.
.
.
.
.
.
.
.
.
.
.
.
.
.
.
.
.
.
.
.
.
.
.
.
.
.
.
.
.
.
.
.
.
.
.
.
.
.
.
.
.
.
.
.
.
.
.
.
.
.
.
.
.
.
.
.
.
.
.
.
.
.
.
.
.
.
.
.
.
.
.
.
.
.
.
.
.
.
.
.
.
17
18
18
19
19
20
20
20
21
21
22
22
22
28
30
31
32
32
.
.
.
.
.
35
37
38
40
42
44
.
.
.
.
.
.
.
.
.
.
.
.
.
.
.
.
.
.
.
.
4 Squidy – A Zoomable Design Environment
4.1 Focus Group . . . . . . . . . . . . . . . . .
4.2 Visual Programming Language . . . . . . .
4.3 Dataflow Programming . . . . . . . . . . .
4.3.1 Generic Devices and Data Types . .
4.3.2 Pipe and Filter . . . . . . . . . . . .
xv
.
.
.
.
.
.
.
.
.
.
.
.
.
.
.
.
.
.
.
.
.
.
.
.
.
.
.
.
.
.
.
.
.
.
.
.
.
.
.
.
.
.
.
.
.
.
.
.
.
.
.
.
.
.
.
.
.
.
.
.
.
.
.
.
.
.
.
.
.
.
.
.
.
.
.
.
.
.
.
.
.
.
.
.
.
xvi
CONTENTS
4.3.3 Node Actions . . . . . . . . . . . .
4.3.4 Node Linkage . . . . . . . . . . . .
4.4 Details on Demand . . . . . . . . . . . . .
4.4.1 Zoomable User Interface . . . . . .
4.4.2 Automatic Zoom . . . . . . . . . .
4.4.3 Semantic Zooming . . . . . . . . .
4.4.4 Interactive Configuration . . . . .
4.4.5 Semantic Scrolling . . . . . . . . .
4.5 Node Repository . . . . . . . . . . . . . .
4.5.1 Data Filter . . . . . . . . . . . . .
4.6 Visual Debugging . . . . . . . . . . . . . .
4.6.1 Dataflow Debugging . . . . . . . .
4.6.2 Status Report . . . . . . . . . . . .
4.7 On-the-fly compilation and integration . .
4.8 Visual Clutter Prevention . . . . . . . . .
4.9 Software Engineering Aspects and Metrics
4.9.1 Filter and Device Integration . . .
4.9.2 Processing . . . . . . . . . . . . . .
4.10 Formative Evaluation Study . . . . . . . .
4.10.1 Results . . . . . . . . . . . . . . .
5 Use Cases
5.1 Presenter Tool . . . . . . . . . .
5.2 Augmenting Everyday Objects .
5.2.1 The Advising Key Holder
5.2.2 The TakeCare Flower Pot
5.3 Artistic and Exhibit Installations
.
.
.
.
.
.
.
.
.
.
.
.
.
.
.
.
.
.
.
.
.
.
.
.
.
.
.
.
.
.
.
.
.
.
.
.
.
.
.
.
.
.
.
.
.
.
.
.
.
.
.
.
.
.
.
.
.
.
.
.
.
.
.
.
.
.
.
.
.
.
.
.
.
.
.
.
.
.
.
.
.
.
.
.
.
.
.
.
.
.
.
.
.
.
.
.
.
.
.
.
6 Conclusion
6.1 Outlook and Future Work . . . . . . . . . . . .
6.1.1 C# Bridge . . . . . . . . . . . . . . . .
6.1.2 Logical Data Routing . . . . . . . . . .
6.1.3 Advanced Dataflow Visualization . . . .
6.1.4 Versioning . . . . . . . . . . . . . . . . .
6.1.5 Remote Control . . . . . . . . . . . . . .
6.1.6 Visually Formulating Relational Algebra
.
.
.
.
.
.
.
.
.
.
.
.
.
.
.
.
.
.
.
.
.
.
.
.
.
.
.
.
.
.
.
.
.
.
.
.
.
.
.
.
.
.
.
.
.
.
.
.
.
.
.
.
.
.
.
.
.
.
.
.
.
.
.
.
.
.
.
.
.
.
.
.
.
.
.
.
.
.
.
.
.
.
.
.
.
.
.
.
.
.
.
.
.
.
.
.
.
.
.
.
.
.
.
.
.
.
.
.
.
.
.
.
.
.
.
.
.
.
.
.
.
.
.
.
.
.
.
.
.
.
.
.
.
.
.
.
.
.
.
.
.
.
.
.
.
.
.
.
.
.
.
.
.
.
.
.
.
.
.
.
.
.
.
.
.
.
.
.
.
.
.
.
.
.
.
.
.
.
.
.
.
.
.
.
.
.
.
.
.
.
.
.
.
.
.
.
.
.
.
.
.
.
.
.
.
.
.
.
.
.
.
.
.
.
.
.
.
.
.
.
.
.
.
.
.
.
.
.
.
.
.
.
.
.
.
.
.
.
.
.
.
.
.
.
.
.
.
.
.
.
.
.
.
.
.
.
.
.
.
.
.
.
.
.
.
.
.
.
.
.
.
.
.
.
.
.
.
.
.
.
.
.
.
.
.
.
.
.
.
.
.
.
.
.
.
.
.
.
.
.
.
.
.
.
.
.
.
.
.
.
.
.
.
.
.
.
.
.
.
.
.
.
.
.
.
.
.
.
.
.
.
.
.
.
.
.
.
.
.
.
.
.
.
.
.
.
.
.
.
.
.
.
.
.
.
.
.
.
.
.
.
.
.
.
.
.
.
.
.
.
.
.
.
.
.
.
.
.
.
.
.
.
.
.
.
.
.
.
.
.
.
.
.
.
.
.
.
.
.
.
.
.
.
.
.
.
.
.
.
.
.
.
.
.
.
.
.
.
.
.
.
.
.
.
.
.
.
.
.
.
.
.
.
.
.
.
.
.
.
.
.
.
.
.
.
.
.
.
.
.
.
.
.
.
.
.
.
.
.
.
.
.
.
.
.
.
.
.
.
.
.
.
.
.
.
.
.
.
.
.
A Evaluation Documents
A.1 Agreement . . . . . . . . . . . . . . . . . . . . . . . . . . . . . . . . . . . .
A.2 Tasks . . . . . . . . . . . . . . . . . . . . . . . . . . . . . . . . . . . . . .
A.3 Questionnaires . . . . . . . . . . . . . . . . . . . . . . . . . . . . . . . . .
Bibliography
.
.
.
.
.
.
.
.
.
.
.
.
.
.
.
.
.
.
.
.
46
50
52
52
52
53
55
60
62
64
64
65
66
67
68
70
70
71
76
79
.
.
.
.
.
83
83
93
93
94
96
.
.
.
.
.
.
.
99
101
101
101
102
102
103
104
117
. 117
. 119
. 128
130
Chapter 1
Introduction
Contents
1.1
1.1
Motivation
. . . . . . . . . . . . . . . . . . . . . . . . . . . . . . .
1
1.2
Outline . . . . . . . . . . . . . . . . . . . . . . . . . . . . . . . . . .
5
Motivation
“Imagination is more important than knowledge. For knowledge is limited,
whereas imagination embraces the entire world, stimulating progress, giving
birth to evolution.”
— Albert Einstein
Since the early stages of machine-aided working, the interface between man and machine
has gained in importance. For example, a motor-powered vehicle such as an automobile
allows the driver to control the driving direction by turning the steering wheel in relation
to the intended driving direction and further adjusting the velocity by either pushing the
gas pedal or the brake pedal. This example illustrates the simplicity of such an user interface that controls complex mechanical functionality, such as the gas pedal controls the
carburetor and this in turn controls the power of the automotive engine automatically.
Thus, most people can drive cars even though they have less or no knowledge of car mechanics.
The upcoming availability of electronic components and electro technology, entailed partially replacements of machines’ mechanical components with electronic components but
the man-machine interface (MMI) has remained indispensable. This evolution of technology cleared the way for the first generation of electronic computers. For instance the Z3
built in 1941 by Konrad Zuse1 , which was an electromechanical computer and the world’s
first programmable and fully automatic machine. This computer could carry out certain
primitive computations by feeding the machine with punched film stocks. Such a punched
film stock represents sequential and machine-readable instructions. After the machine has
1
Konrad Zuse was a German engineer and computer pioneer. He was born on June 22nd 1910 in Berlin
and died on December 18th 1995 in Hünfeld.
1
2
CHAPTER 1. INTRODUCTION
read the input and finished computation according to the instructions the machine then
again output the result as a punched film stock. Therefore, one could say a punched film
stock is the first input and output device that allowed communication between humans
and computers. Despite the groundbreaking computational power of such a mainframe in
both construction as well as in interpretation of punched cards was an exhausting task for
humans. To operate the machine and to perform automatic computations expert knowledge was strictly required. Furthermore, these experts had to comply a diligent sequence
of operations to receive reliable results.
A relief and utilization for everyone was offered by personal computers (PC) which have
been manufactured since the late 1970s and early 1980s and led to a proliferation to
almost every household. The first complete personal computer was the Commodore PET
and consisted of a monochrome display and a single piezo “beeper” for signal output as
well as a keyboard for a more direct user input compared to the mainframes. Moreover, a
built-in Datassette2 still allowed data exchange; more precisely data input as well as data
output similar to punched cards in mainframes.
Figure 1.1: The first prototype of a computer mouse invented and developed by the Californian
scientist Douglas Engelbart.
Later these desktop computers were equipped with further input devices such as joysticks
and mouses. The inventor of the latter was the Californian scientist Douglas Engelbart.
The first computer mouse was quite simple but it was revolutionary to freely navigate a
black dot by hand-eye coordination in a relative manner. Since then items in a graphically
displayed list could be selected more directly using the mouse in contrast to previous
approaches where users needed to identify an item’s number and press that number on a
2
The Commodore Datassette was Commodore’s tape recorder to persist data durable based on a magnetic
technology. Its naming was composed of data and cassette to Datassette.
1.1. MOTIVATION
3
keyboard afterwards. The prototype shown in a demonstration was packaged in a primitive
wooden case with two outlets – a key button and a cord with a connector (Figure 1.1).
When using his mouse a user simply moves the wooden case relatively towards a list item
and presses a button to select it. This mouse device was introduced to the public at the
convention center in San Francisco on December 9th , 1968.
42 years later keyboard and mouse are still predominant in daily computer usage. However,
the form factor of these devices have changed in the course of time for ergonomic reasons
and technology is more precise than it was in its early beginnings. The technology for
physical interaction has not changed significantly for about half a century or as Bill Buxton
puts it:
If Rip Van Winkle woke up today, having fallen asleep in 1984, already possessing a driver’s license, and knowing how to use a Xerox Star or Macintosh
computer, he would be just as able to use today’s personal computers as drive
today’s cars. [13, p. 39]
Nevertheless, in 1984, the group around Bill Buxton at the University of Toronto was
already working on multi-touch input3 ; but why did it take 22 years to be presented in
consumer products?
In contrast to the physical input devices, algorithms underlying human-computer interaction have been steadily improved. Despite improvements in control-to-display interaction
(e.g. CD gain), research scientists such as Barton A. Smith [73] are aware of the complexity of the hand-eye coordination resulting of an indirect interaction (e.g. mouse input or
keyboard input).
“The mapping between cursor motion and input device is often a complex
transfer function, which may further increase the complexity of the hand eye
relationship in target acquisition tasks with a computer cursor.” [73]
As a result, improvements of the software algorithms did already help to reduce this
complexity, such as non-linear acceleration schemes for computer mouse interaction. Nevertheless, current input devices and upcoming novel input devices (e.g. Microsoft Kinect,
Sony Playstation Move Motion Controller) can be integrated into existing systems but
already existing filter algorithms need to be adjusted to the new input techniques. Therefore, developing novel input devices goes hand in hand with acquiring knowledge that
has been researched by others. The awareness of such a complexity and the lack of tool
support leads to the conclusion that it is far more complex to be solved separately. An
important conclusion that comes to one’s mind and can be transferred to many domains
arise from Deborah Mayhew. She describes it in the domain of usability engineering.
“[...] not impossible, but unusual, for a single person to have a high degree
of skill in more than one usability role.” [53, p. 491]
The previous paragraphs indicate the need of both hardware devices such as input and
output devices as well as complementing software that enables communication between
3
http://www.billbuxton.com/multitouchOverview.html
4
CHAPTER 1. INTRODUCTION
hardware devices and applications. Basically, the interaction between humans and computers requires at least one input device to achieve human-machine interaction (HMI) or
human-computer interaction (HCI). Such an input device can be a physical knob or a
computer mouse. Thus, the performance of a machine or computer depends on a user’s
input and further depends indirectly on the software filter techniques and input device
adaptability to human’s pre-existing knowledge. For instance a CD gain 1:20 (1 unit of
mouse movement cause 20 units of cursor movement) can be counterproductive although
in some cases a fitting CD gain can improve a user’s performance [16]. Commonly, workers are instructed in special training courses on how to operate the machines to achieve
a desired output. That time scheduled for training is typically restricted due to the factor of cost and time. In order to still achieve best education results considering the less
period of education such user interfaces need to be more “graspable”. In today’s research
community such interfaces are summarized in the notion of natural user interfaces, which
spans a wide area of user interfaces. This thesis provides a summary of user interfaces as
well as an introduction in the terminology of natural user interfaces. It further defines a
more concrete definition of “natural” and “naturalness”, which helps to secure concepts
while discussion.
The responsibility of interaction designers is to design a comprehensible facility for HMI or
HCI. However, interaction designers lack in tool support. Especially, the development of
user interfaces supporting a user’s pre-existing knowledge is not supported well by current
integrated development environment. The de- facto standard of input devices are usually
keyboard and mouse. A more convenient input is only supported by a few programming
languages such as C#/.NET 4.0 that enables developers to integrate stylus and touch
input. Nevertheless, a human being has more than these input modalities and interaction
designers can think of full body interaction or speech input. Indeed an interaction designer
has occupational skills to develop post-WIMP user interfaces offering sophisticated input
modalities he might lack in programming expertise. This impedes the progress of natural
user interface development. However, a design environment that provides a simple visual
language can lower the threshold and empower interaction designers in their conception
and development phases. Thus, it enables unexperienced programmers to design novel interaction techniques beyond keyboard and mouse. Because an easy comprehendible visual
language is needed the “pipe-and-filter” software engineering pattern was chosen, which
provides a simple interface between computer instructions and human’s mental concepts
of dataflow.
In a nutshell, it is cumbersome to integrate new devices to existing applications as this
process is not supported well by software development environments. Especially, for users
that are indeed hardware talented but have little or no skills in device driver development
or device driver integration. This might lead to the fact that new and useful interaction
techniques might be discarded before completion although an availability of development
environments for the design of interaction techniques can support all previously named
factors. For example, designers conceptualize more natural interaction techniques, developers integrate device drivers and implement filter techniques, and of capital importance
the end-users employ sophisticated interaction techniques in different domains of their
everyday life.
1.2. OUTLINE
1.2
5
Outline
Having explained the research motivation and objectives in the introduction, the second
chapter provides an overview of user interfaces. It starts with the early command-line
interfaces where users need to interact by keyboard with the computer. The increased
computational power of CPUs as well as graphic cards led to the next generation of user
interfaces, which are commonly known as graphical user interfaces. In that case, a user
manipulates visual objects either by keyboard input or computer mouse input. However,
in the last decades an added range of input and output devices coined the novel term of
natural user interfaces. The term of natural user interfaces is not well-defined but this
thesis attempts to elicit the word natural in the sense of natural user interfaces.
The third chapter introduces the scientific domain of interaction design toolkits along
with established criteria for those toolkits. It further describes relevant users working
and interacting with those toolkits and with help of user roles. These user roles are
characterized independently.
The fourth chapter proceeds with an introduction into dataflow programming languages
and visual programming. The design rationals and concepts are described with the help
of the design environment Squidy. Hence feedback of real users is essential to eliminate
design flaws and make Squidy more usable, a formative evaluation study has been conducted. The study and evaluation results are presented at the end of Chapter 3.
In Chapter 5 selected projects show the feasibility of Squidy as an interaction library for
the design of natural user interfaces. The use cases evolve of distinct domains and arise
from artistic and exhibit installations, academic courses and research perspectives.
The work concludes with the sixth Chapter, which sums up the main results of the research
conducted and beyond that provides an outlook and gives examples for the future work.
6
CHAPTER 1. INTRODUCTION
Chapter 2
Introduction of User Interfaces
Contents
2.1
2.2
2.3
Command-Line Interface . . . . . . . . . . . . . . . . . . . . . . . 8
Graphical User Interface . . . . . . . . . . . . . . . . . . . . . . . 10
Natural User Interface . . . . . . . . . . . . . . . . . . . . . . . . 12
“A picture is worth a thousand words. An interface is worth a thousand
pictures.”
— Ben Shneiderman
The primary goal of interaction designers is to create an easy to use, easy to remember
and enjoyable user interface. Therefore, a rough explanation of user interfaces is given in
the following paragraphs and after that a brief overview of early computer user interfaces
up to modern user interfaces will be presented within this chapter.
A user interface is one part of a system that allows users to interact with the system behind
the interface. Early user interfaces consisted of several hardware parts, such as physical
knobs, buttons, and levers. In modern user interfaces and since the upcoming of computers
such user interfaces beyond hardware can consist of software parts, which form a logical
component. Basically, user interfaces combine two channels. The first channel is used to
receive messages from the surrounding world and the second channel communicates states
to the surrounding world. In human-computer interaction the following enumeration will
be more precise:
• Input – allowing a user to manipulate a system’s state
• Output – allowing a user to perceive the effects of a user’s manipulation
Generally, the engineering process of human-computer interaction has its emphasis on
providing an efficient, easy to use, and enjoyable way of interaction with a computer.
The interaction paths into and out of system let the user achieve his intended goal and
moreover provide necessary, desired, and reliable feedback. To be more precise, a user
interface constituting the interface between human and computer and most of them allow the effective operation of a computer and at the same time receiving the computer’s
7
8
CHAPTER 2. INTRODUCTION OF USER INTERFACES
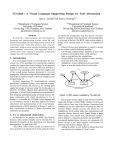
feedback that allows a reliable decision-making. The human factors interpretation of the
human-machine interface done by Scott MacKenzie emphasizes this argument (see Figure 2.1). They simplify the components involved in human-computer interaction. Firstly,
the human produces output through modalities (e.g. finger, hand movements and voice
input). Secondly, computer (machine) receives this output as input. Lastly, an interaction
between human and computer takes place at the interface. It provides a set of components
that can be understood by both human as well as the computer [49].
Figure 2.1: The human-machine interface. Input devices are the controls humans manipulate to
change the machine state. [49]
Several distinct types of alike user interfaces have evolved since the early beginnings of
human-computer interaction. Three of them will be presented in more detail as they are
the most important representatives. The first type of user interfaces are the command-line
interfaces that are based on textual input and output (e.g. keyboard input and output).
The second type of user interfaces is represented by the graphical user interfaces that
provide a graphically enriched interface to users and further supersede the command-line
interfaces. Lastly, natural user interfaces trying to enrich the interaction between humans
and computers beyond the usage of keyboard and mouse.
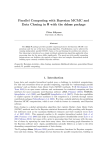
The Figure 2.2 abstractly relates the three user interfaces to their origination time and
denotes their main characteristics (from left to right: eldest user interface to most recent
terminology). To mention in advance, their appearance mostly correlates to the technical
restrictions at the time they have been developed.
2.1
Command-Line Interface
At the very beginning of human-computer interfaces a command-based approach provided
the user a specific set of commands. These commands were typed by the user using a
physical keyboard as input device and superseded the punched film stocks used for the
interaction with mainframes. The textual input commands were afterwards interpreted
by the system. Mostly these commands consist of a command name followed by one or
more arguments (see Listing 2.1).
2.1. COMMAND-LINE INTERFACE
9
Figure 2.2: The chart represents the historical appearance of user interfaces (from left to right).
It first began with command-line interfaces and later on supplemented with graphical user interfaces. Lately the emergent field natural user interfaces have coined
the term of ubiquitous computing [83], tangible interaction [77], and reality-based
interaction [32].
Listing 2.1: A simple “echo” command echos given arguments to the bash. Here, the two arguments “Hello” and “World!” are printed to the output stream of the bash command
frame after the user hits the enter key.
bash -3.2 $ echo Hello World !
Hello World !
bash -3.2 $
A major drawback of such command-line interfaces (CLI) is that a user has to know
the commands and admissible arguments in advance. Eligible commands are the “echo”
command, which echoes arguments to the command line or the “crontab” command to add
a time-triggered job to the operating system’s cron table. In a scenario where a user wants
to print out the content of a file he needs to know the print command, the command’s
arguments, the appropriate argument order, the logical address of the printer and the path
to the document itself (see Figure 2.2).
Listing 2.2: This command sends the textfile.txt to a printer connected on parallel port LPT2.
C: \ > print /d:LPT2: C: \ textfile . txt
A typing error in the command causes a system error and the command will not be
executed by the system. However, a user has to find and resolve the error manually
otherwise no data will be sent to the printer spooler.
10
2.2
CHAPTER 2. INTRODUCTION OF USER INTERFACES
Graphical User Interface
Instead of burden the user with manual command input, graphical user interfaces (GUI)
provide a richer set of graphical output exceeding mere textual output. Most GUIs are
based on the desktop metaphor and try to emulate a physical desktop. These are familiar to most users. Developers of such systems expect that users build upon’ pre-existing
knowledge and thus imply that this desktop metaphor is easy to use and easy to remember. In 1983, when Apple released Apple Lisa1 , it was shipped with Lisa OS, which is a
user interface that is mentioned to be the first GUI (see Figure 2.3). In comparison with
previous CLIs, the novel graphical interfaces increased productivity by making computers
easier to work with.
Figure 2.3: A screenshot of Lisa OS, a graphical user interface that was shipped with Apple’s
first personal computer, named Lisa.
These graphically enriched systems and applications are based on the WIMP2 paradigm.
Here, users do not have to memorize commands in fact because commands are represented
graphically. For instance, a user wants to print the content of a specific text file; he simply right-clicks on the icon representing the text file to open the context menu. Then he
navigates to the “Send To” menu item and then clicks the “Printer” menu item, which
then activates the print command automatically (see Figure 2.4). In summary, such GUIs
are set on top of CLIs and moreover provide visual and cues and actions, which in turn
can trigger CLI commands. Despite that it was a great leap forwards and some developers
carried such metaphors to success (e.g. Microsoft Bob or MS Bob).
MS Bob was developed by Microsoft and declared as “social interface”. Social interfaces
augment the graphical interfaces with an aspect of “personality”, which constitutes a more
humanoid computer [55] (e.g. Rover, a yellow dog answering to a user’s questions) . The
two-dimensional representation of MS Bob was copied in an one-to-one matching from
the real world such as the home office or the living room as it can be seen in Figure 2.5.
1
2
Apple Lisa was Apple’s first personal computer.
WIMP is an acronym and stands for Window, Icon, Menu, Pointer
11
2.2. GRAPHICAL USER INTERFACE
Figure 2.4: In standard WIMP user interfaces the content of a file can be easily printed by calling
the context menu on an icon and send to printer.
Several virtual objects within the graphical user interface give access to office applications.
For instance, a click on a virtual mail box opens the mail application (see Figure 2.5 (b)).
Furthermore, digital characters (avatars / agents) are communicating with the user if help
seems to be needed. These agents provide hints or guide users through the social and
graphical user interface.
(a)
(b)
Figure 2.5: Screenshots of Microsoft Bob: (a) The living room providing access to MS Bob
applications, (b) BOB Mail is an email application integrated in MS Bob.
The project leader was Karen Fries and the project was managed by Melinda Gates3 . MS
Bob needed more computing power than it was available to ordinary consumers at that
time. For that reason and due to the low sales volume the project was discontinued finally.
Hence, graphical user interfaces that are based on the desktop metaphor are still dominant
in modern computers (e.g. Microsoft Windows 7, Apple OS X, or Gnome for Unix).
Similar to the input and output devices’ history introduced in Chapter 1, nothing has
been changed dramatically in the world of graphical user interfaces for about 30 years.
Users of such interfaces still cope with files and folders, diverse programs only applicable
3
Melinda Gates is the wife of Microsoft co-founder Bill Gates.
12
CHAPTER 2. INTRODUCTION OF USER INTERFACES
for specific file types, a single manipulator (cursor), and manifold enabled or disabled
actions (menus).
2.3
Natural User Interface
Natural user interface, or NUI, is the common phrasing used by designers and developers
of computer interfaces to refer to a user interface that is effectively invisible or becomes
invisible with successive learned interactions to its users. The word natural is used because
most computer interfaces use artificial control devices whose operation has to be learned.
A NUI relies on a user being able to carry out natural motions, movements or gestures and
let them quickly discover how to control the computer application or to manipulate the
on-screen content. The most descriptive identifier of a NUI is the displacement of physical
keyboards and mouses where these devices are inappropriate for usage.
A statement expressed by Steve Ballmer (CEO of Microsoft) gives future prospects on the
importance of natural user interfaces.
I believe we will look back on 2010 as the year we expanded beyond the mouse
and keyboard and started incorporating more natural forms of interaction such
as touch, speech, gestures, handwriting, and vision – what computer scientists
call the "NUI" or natural user interface.
In consequence of natural interaction any human sense can be used to interact with a
system. These senses are abstracted as modalities. In today’s user interfaces touch, seeing,
and hearing are the most utilized modalities. Therefore, if one would ask a computer how
a human would look like, the descriptive illustration would be Figure 2.6.
Figure 2.6: How the computer sees us. [61] (the author transformed the original bitmap image
to a vector graphic)
2.3.1
Human Modalities
A research paper by Dumas et al. established principles for multimodal user interfaces [22].
They identified important aspects of such multimodal user interfaces on the basis of cognitive science. Furthermore, they addressed the fusion of heterogeneous data resulting
2.3. NATURAL USER INTERFACE
13
from user’s input at a certain time period and further classified architectures for real-time
processing (e.g. ICARE [10] and OpenInterface [71]) using self-established and distinct
characteristics.
Although the theoretical foundation and architectures for the design of multimodal and
more natural user interfaces exist, the common interaction with computers is still performed by keyboard and mouse whereas the user captures a monitor’s digital output and
listens to sounds. Other human modalities are scantly supported as there are haptic,
proprioception (perception of body awareness), thermoception (sense of heat and cold),
nociception (perception of pain), taste (gustation), smell (olfaction) or equilibrioception
(perception of balance).
Despite the fact that humans have much more modalities than used in common user
interfaces it needs to be clarified what “natural” means. Is it natural to write something
with a mouse instead of using a pen? Referring to a comment of Bill Buxton.
NUI exploits skills that we have acquired through a lifetime of living in the
world.
A related citation put by Robert Jacob et al. [32] tries to interpret such acquired skills
for post-WIMP interfaces emerging from virtual, mixed and augmented reality, tangible
interaction, ubiquitous and pervasive computing, context-aware computing, handheld, or
mobile interaction, perceptual and affective computing as well as lightweight, tacit or
passive interaction.
[...] all of these new interaction styles draw strength by building on users’
pre-existing knowledge of the everyday, non-digital world to a much greater
extent than before.
2.3.2
Three Zones of Engagement
When observing people that are introduced to unknown commodities and interacting in
the real world some similarities in their behavior can be determined. This is also an
important aspect to interaction design, more precisely for the design of gestural interfaces
which comes from Dan Suffer [68]. He observed users and put the results in a strategy
of the “Three Zones of Engagement”. Interfaces are not just the experience a user gains
from interacting with a specific application.
It is a more natural form of interaction that is not just involving the “interaction” itself.
The Figure 2.7 gives a coarse overview on two further but not less important aspects of
engagement. In the following the three zones are depicted briefly.
Attraction
Before an object becomes actively involved in the interaction it needs to attract passing
creatures. In this case several radii and senses of creatures are involved and thus are of
more or less of importance. To gain attention by visual cues the visual instrument have to
be attracted by light signals. A further channel of attraction can convey acoustic signals
that do not need to be in a line of vision. The olfactory channel has not been used very
often to gain attraction because for human beings it is the most complicated sense and
14
CHAPTER 2. INTRODUCTION OF USER INTERFACES
Figure 2.7: The “Three Zones of Engagement” as Dan Suffer puts it. It covers the wide range of
attraction, the intermediate observation and the interaction as central point.
not yet well understood by psychologists [54, p. 73ff]
Observation
Comparable to the animal kingdom, humans mostly observe unknown objects carefully
before an interaction begins. In most cases this happens by observation of other creatures
currently operating with an object. Furthermore, this is a process of learning how to possibly use an object and interact with it. It depends on the diversity of functionality how
long it takes a user to comprehend the purpose of an object. For natural user interfaces it
implicates that the phase of observation or learning is marginal because the user should
build upon pre-existing knowledge [32].
Interaction
The main aspect of the three zones of engagement is the interaction, which is the central
point and allows to change the status of objects. Interaction is performed either by direct
interaction between subject and object or by automatic status changes of an object. In
the context of natural user interfaces and human-computer interaction, the subject will be
a person who initiates changes to the system by using given modalities such as his voice
or trained motor skills (e.g. moving a mouse).
As mentioned before, these three zones are assignable quite simply to humans’ natural
behavior. Before a human knows with whom or what and how to interact, he has to be
attracted beforehand. Otherwise he would not know that there is something interesting
on his radar. If the user puts his mind on the object of interest he needs to have context
information on the options on how the thing can be used practicably. Most of the time
this step is done by observing potential other people or creatures attracted beforehand.
The last part of Dan Suffer’s three zones is the core zone which is the interaction itself.
From a psychological perspective, these zones as a form of “natural behavior” apply to
2.3. NATURAL USER INTERFACE
15
the theoretical foundations of behaviorism developed by Edward Thorndike, John Watson,
and Burrhus Frederic Skinner. These researchers argue that human activity is based on
stimulus-response like hunger and eating or curiosity and looking [54].
In addition to the stimulus-response model the tacit and explicit knowledge of humans
play an important role in knowledge establishment. Here, knowledge-based networks can
help to distribute explicit knowledge among several human beings such as the knowledge
of feasible interaction. Communicating how to control a machine either by dialog or by a
user manual, which corresponds to the observation introduced previously for instance. In
contrast to the explicit knowledge, the tacit knowledge cannot be transferred by human
language or gestures but rather by training human skills. A tacit knowledge for instance is
the knowledge of how to ride a bicycle and can be learned through imitation. [59, p. 71ff].
Nevertheless, both tacit and explicit knowledge can be employed for human-computer
interfaces like natural writing with a digital pen, which most people have learned in playschool and primary school.
A remarkably critique point on NUIs by Donald Norman was mentioned in an article [60]
that describes the current situation and experience with novel input devices indicating
themselves as natural interfaces. The example Donald Norman puts in his article is the
Wii Remote control of Nintendo’s famous game console Wii playing a bowling game. Early
users playing this bowling game have naturally released the controller when the bowling
ball comes close to the floor like in the real world bowlers release the bowling ball. This
led to broken television screens or consequently injured teammates. This “interaction in
the wild” [13] entailed Nintendo’s strategy to equip Wii Remote controllers with bracelets
to avoid accidentally throwing away the controller. Donald Norman further put out the
following statement:
Are natural user interfaces natural? No. But they will be useful.
Although this point of view criticizes the denotation of “Natural User Interfaces”, he indeed
assigns eligibility to such kind of user interfaces. As the terminology of NUIs is well known
it will be used as synonym to useful interfaces that allow users to build upon pre-existing
tacit and explicit knowledge learned either in the real or a digital world. Ranging from a
research perspective to the fact that user interfaces form an essential ingredient in humancomputer interaction, there is enough room to equip such interfaces with further input
technology other than keyboard and mouse.
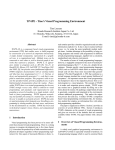
In 2008, Harper et al. illustrated the changing eras of computers starting from the early
beginning of the mainframes in 1960 [29]. Comparing their prediction of being a human in
the year 2020 and beyond with Weiser’s “The computer for the 21st century” a congruent
foundation is found. In the 90s, Weiser arguments that pads, tabs, and boards will augment
reality in the 21st and are further available everywhere to support humans in their daily
life. In analogy to Weiser’s prediction the “Mobility Era” and “Ubiquity Era” of Harper
et al. are based on mobile phones, larger handhelds, and even larger displays.
These congruent visions are becoming more and more reality and reveal the need for
interaction techniques beyond keyboard and mouse. Nevertheless, keyboard and mouse
input devices are still predominant and current existing toolkits and frameworks thereby
16
CHAPTER 2. INTRODUCTION OF USER INTERFACES
Figure 2.8: A sketch of Harper et al. [29] emphasizing past decades of computing and giving a
short prediction of ubiquitous computing in the year 2020.
support poorly users in the development of natural user interfaces. In the next chapter
the challenges to a more supportive interaction design toolkit is given.
Chapter 3
Challenges
Contents
3.1
3.2
Criteria on a Design Environment . . . . . . . . . . . . . . . . . 18
User Roles . . . . . . . . . . . . . . . . . . . . . . . . . . . . . . . . 28
“A person who never made a mistake never tried anything new.”
— Albert Einstein
Several frameworks and toolkits that support users when developing novel and more natural interaction techniques have emerged during the last decades (e.g. Microsoft Windows
Touch1 , Microsoft Surface Toolkit Touch Beta2 , Apple iOS3 , or Android4 ). Nevertheless,
these frameworks and toolkits do not offer high-level programming, rapid prototyping,
debugging, highly iterative testing, and manifold ready-to-use components in an all-in-one
tool suite. For example, a user developing an application for the Apple iPhone needs
to cope with three distinct development applications, which are XCode to program the
application logic, the Interface Builder to design its user interface as well as Instruments
to debug it. Thus, users need to handle multiple development environments to achieve
their goal, which is the development of interaction techniques. For instance, an interaction
technique that is developed in Java and deployed on a test server for evaluation purposes
at least involves an integrated development environment to implement the interaction
technique on the developer’s machine (e.g. Eclipse IDE for Java) and a text editor on the
test server to adjust filter properties and thus adjust the interaction techniques to a given
environment (e.g. Microsoft Notepad). In addition, if a test conductor in preparation of
an experiment needs to adjust the interaction technique he needs to obtain information
on appropriate property values and therefore does either consult a website by using a
web browser or a text document such as a pdf using a pdf reader. This simple example
introduces the complexity of the domain of interaction design. Because users with heterogeneous knowledge primary need to master diverse tools in order that they are able
1
http://msdn.microsoft.com/en-us/library/dd562197(VS.85).aspx
http://www.microsoft.com/downloads/details.aspx?FamilyID=801907A7-B2DD-4E63-9FF38A2E63932A74
3
http://developer.apple.com/technologies/ios/
4
http://www.android.com/
2
17
18
CHAPTER 3. CHALLENGES
to conceptualize and implement novel interaction techniques. This hinders interaction
designers in the first instance as they are usually unfamiliar with programming languages
and thus the corresponding tools. Hence, a single design environment reduces learning
efforts when integrating both the tools necessary for the development of post-WIMP interaction techniques as well as the possibility to cope with very heterogeneous user groups.
Nevertheless, this bares challenges that are tackled within this thesis.
In order to depict the requirements of such a design environment we identified the criteria
necessary to constitute a homogeneous all-in-one tool suite. This list of criteria is based
on “Characteristics of different tools for creation of multimodal interface” by Bruno Dumas et al. [22, p. 17] and the “Criteria to Interaction Design Toolkits: Next Generation
Interaction Library” by the author of this thesis [65]. Furthermore, user groups employing such interaction design toolkits and frameworks are highlighted applying user roles
according to Deborah Mayhew [53]. The listing of criteria and the user roles will point out
the challenges and necessary aspects needed for the development of a design environment
superior to existing toolkits and frameworks.
3.1
Criteria on a Design Environment
The following criteria reflect requirements necessary for a design environment that should
support the development and evaluation of post-WIMP interaction techniques. Each criterion is described in detail in the following paragraphs. In addition, these criteria can
provide a guideline for the comparison of tools enabling interaction design and thus were
used to classify and rate existing tools and frameworks employed in the context of interaction design [65].
3.1.1
Application Programming Interface
An Application Programming Interface (API) hides complex algorithms behind a simple
programmable interface. This interface is approachable to programmers and at the same
time provides several entry points to access the core functionality. Thus, it aims for
a simple usage of complex and “hidden” algorithms. Moreover, these entry points can
completely differ in diversity of underlying functions, complexity to access these functions,
and overall feasibility when comparing different APIs.
In interaction design, such an API can support interaction designers in distinct phases such
as prototyping or evaluation. Of course, these APIs require implementation of interaction
techniques in a procedural or declarative programming language (e.g. Swing5 or WPF6 ),
which could be done basically by using standard text editors (e.g. Microsoft Notepad,
UNIX vi or Apple TextEdit). Considering a deep knowledge of an API’s corresponding
programming language and the required steps to compile the source code into binaries,
this approach to design interaction techniques is limited to experienced programmers with
levels of skill and expertise.
5
Swing belongs to the Java Foundation Classes (JFC), which is a collection of Java libraries for the
programming of graphical user interfaces.
6
Windows Presentation Foundation (WPF) is part of the Microsoft .NET framework and uses XAML
(based on XML) to declaratively define graphical user interfaces.
3.1. CRITERIA ON A DESIGN ENVIRONMENT
19
Figure 3.1: Code completion provided by Eclipse IDE Java supplies users with possible methods
that can be called on the corresponding object.
On top of these APIs, the Integrated Development Environments (IDE) supply both advanced and experienced programmers with additional functionality when writing code
(e.g. Microsoft Visual Studio for C#/.NET and Eclipse IDE Java). For instance, code
completion functionality in object-oriented programming languages. It offers method and
function calls suitable to a current object variable (see Figure 3.1). Additionally, documentation is provided in an ad-hoc manner and helps the programmer to understand a
function’s underlying operation.
Hence, IDEs try to minimize a user’s cognitive load when providing only suitable functions
and methods compared to a needed research when using plain text editors as mentioned
beforehand. Although these kinds of graphical user interfaces support the user while programming interaction techniques, they only support interaction designers with programming expertise. Therefore, the human-API interface needs to be very easy to understand,
provide a low threshold, and target for high ceiling [56].
3.1.2
Ready-to-use components
Users with less or no programming experience are doomed in the process of interaction
design if they have to implement interaction techniques programmatically. Thus, readyto-use components are a requirement for such a toolkit to start “out-of-the-box” or for
a minimized programming effort to the interaction designer. These components support
inexperienced users and allow them to begin the interaction design on a very low and
basic level. Furthermore, the toolkit should provide an online repository where a user
can publish newly created components and interaction techniques. Then, other users can
access and use these components without the need to implement the same functionality
repeatedly. Already designed interaction techniques can be consulted online for evaluation,
comparing them to novel interaction techniques. Moreover, evaluation tasks and metrics
provide a mechanism to measure performance of components and interaction techniques
objectively [74].
3.1.3
Reuse of components
Online repositories, like the one introduced in the previous section, can congest when users
intensely publish new components or components that possess fractional changes. This
20
CHAPTER 3. CHALLENGES
can also exacerbate the maintenance of the components and the repository. Therefore,
components that possess common features should be condensed in a generic way that
aims for a high reuse input adaptability and thus does not require repeated implementation overhead [82]. A Kalman filter for instance, is a component based on a HMM to
predict two-dimensional movements. This filter can either be used to reduce a human’s
natural hand tremor when using a laser pointer for interaction from distance [40] or to
assign unique session identifiers to a human’s fingers when interacting on a multi-touch
surface. Also, such generic components can be improved iteratively, increasing the reliability of particular filters and their corresponding algorithms. Additionally, the amount
of components can be reduced to a minimum which increases the possibility for a user to
overlook the whole collection of components.
3.1.4
Manageable complexity
Generally, programming can be a very complex task if the source code increases to a dimension that is not manageable for humans. Indeed the object-oriented approaches reduce
this complexity by encapsulating similar functionality into objects; it still overwhelms a
programmer by providing the complete diversity of functions and methods at a glance.
Thus, a user should be able to adjust complexity to current needs and knowledge such as
the decision whether he wants to implement new interaction components or just needs to
change a few properties of an interaction technique. For instance, to change properties a
user does not need insight into the source code and thus does not need to be overstrained
by irrelevant information.
3.1.5
Component suggestion
Similar to code completion, component suggestion can reduce errors and helps interaction
designers to define reliable and non-frustrating human-computer interaction by recommending further beneficial components. For example, interaction designers benefit from
the suggestion of a Kalman filter to reduce humans’ natural hand tremor when designing
an interaction technique based on laser pointer interaction. In contrast to the positive component suggestion, it is far off to assemble an input device that produces two-dimensional
data and a filter that calculates the intersection to a planar surface. The latter filter
requires at least three-dimensional data to be able to calculate an intersection (e.g. threedimensional data produced by a data glove [25]). Therefore, users should be notified by
the system about such an incoherent assembly.
3.1.6
Multi-platform support
Proprietary devices and toolkits are mostly bound to a certain operating system or strictly
require certain system resources provided by an operating system. For instance, both the
Apple iPhone and the Motorola Droid are based on an ARM processor. However, they
differ in their supported programming language as the iPhone executes Objective-C and
the Droid executes Java binaries. It is a challenge for the interaction designer to support
interaction techniques across multiple platforms and processor architectures (e.g. Java or
C/C++). Interaction toolkits that support multiple platforms in advance can reduce this
complexity by minimizing implementation effort and entailing reliability of interaction.
3.1. CRITERIA ON A DESIGN ENVIRONMENT
3.1.7
21
Expandability / extensibility
In today’s operating systems the behavior of mouses and keyboards can be manipulated
by adjusting preset parameters, such as tracking speed, double-click speed and button
configuration (see Figure 3.2). Advanced options such as mouse gestures are not provided
but could improve a user’s performance.
Figure 3.2: This dialog shows a dialog to change behavior of a mouse connected to the operating
system Mac OS X.
However, several tools, either proprietary or open source, can provide such optional behavior but this demands a programmer’s profound knowledge on operating system level. For
instance, the interaction of Apple’s Magic Mouse is amplified with multi-touch gestures
provided through BetterTouchTool7 . Disregarding an operating system’s standard input
(mouse, keyboard or stylus) it is not designated by operating system manufacturers to
enhance interaction with further devices. If the user likes to add new modalities or filter
techniques, the toolkit should support that task and not make any restrictions or conceal
bottlenecks.
3.1.8
Embedded source code
The development of interactive applications based on toolkits and frameworks requires
writing source code in at least one programming language. This task is well-supported by
existing integrated development environments such as Microsoft Visual Studio, and Apple
7
BetterTouchTool – http://blog.boastr.net/
22
CHAPTER 3. CHALLENGES
XCode. However, each time the source code needs to be changed by the programmer it
involves closing the toolkit or application beforehand. This hinders interaction designers in the highly iterative process of developing reliable interaction techniques. Other
approaches bypass this issue using scripting languages to apply changes on-the-fly (e.g.
Groovy, JavaScript). As these scripts are interpreted at runtime, they can never reach the
performance of compiled programs. Besides, this can lead to interaction latency and thus
provokes user frustration while interacting with an application. In addition, Eclipse IDE
for Java allows hot deployment8 of changed code and in some cases does not necessarily
require a restart of an application. However, introduction of new Java classes (e.g. new
filters) still requires the user to restart an interaction technique. Nevertheless, an integrated source code view lets the user quickly overlook embedded algorithms and apply
changes to that source code rapidly.
3.1.9
Direct manipulation
In some cases “ready-to-use” components and their set parameters are not sufficient to
the interaction designer and thus require tweaking these parameters to achieve a better
index of performance [74]. For instance, humans’ natural hand tremor varies from person
to person and thus standard parameter values of a Kalman filter do not apply to all
humans. Therefore, users should be able to adjust these parameter values quickly and,
moreover, apply such changes directly to the algorithm of the associated component. As
these changes are instantly adopted by the interaction behavior, the user gets a direct
feedback due to his changes. Thus the user is able to correlate adjustment and interaction
behavior, which reduces the cognitive load [30].
3.1.10
Versioning
Within the highly iterative refinement of interaction behavior, a user can change parameter
values or algorithms very often and at some point he impairs behavior. Therefore, the user
should be able to go back to a previous best set of parameters. An approach in standard
WIMP user interfaces is to undo and redo changes but this is inappropriate; in fact
those changes on the techniques are made frequently and throughout several components
disorderedly. Furthermore, the user might switch quickly between distinct parameter sets,
e.g. in order to adapt an interaction technique to a particular user.
3.1.11
Multimodal interaction
With the emergent availability of small and large high resolution displays an interaction
techniques beyond keyboard and mouse become more important. Furthermore, multiple
input devices using different channels such as humans’ perception or motor activity can
synchronously increase humans’ performance for specific tasks hence the weaknesses of
one modality are offset by the strengths of another. Consider a holistic workspace or a
Powerwall9 where users can annotate a map of geographical information system (GIS)
8
9
Hot deployment describes a mechanism to change Java classes during application run-time.
The Powerwall at the University of Konstanz is a large high-resolution display with a display size of 5.20m
x 2.15m and a maximum resolution of 4640x1920 pixels
3.1. CRITERIA ON A DESIGN ENVIRONMENT
23
Figure 3.3: Multimodal interaction using freehand gestures and speech input to control
NipMap [24] at the Powerwall.
using natural language while pointing with a finger to specify the location of the note
(Figure 3.3).
However, various frameworks and toolkits tried to impair tool support, such as ICON Input
Configurator [20], Papier-Mâché [38], ICARE [11], and OpenInterface [46]. These toolkits
and frameworks are based on a high-level API where ready-to-use components, including
input and output devices, can be assembled programmatically or partially through a visual
language. The previously mentioned frameworks and toolkits are explained briefly in the
following paragraphs. In conclusion, the former are opposed to the established criteria on
a design environment to illustrate the state-of-the-art of interaction design tool support.
ICON Input Configurator
The ICON Input Configurator is a toolkit with a focus on interactive applications that
achieve a high level of input adaptability. In 2001, Pierre Dragicevic and Jean-Daniel
Fekete have published it for the first time and promoted it as a novel editor for input
device configuration. Assemblies of input devices and their connections to each other aim
for the usage within graphical interactive applications (see Figure 3.4).
The visual output and input ports of a device are based on primitive values (e.g. boolean,
integer, String). Thence, a user has to route each single output of a node to an input of
another node and each time has to decide whether a linkage makes sense or not. Furthermore, the configuration interpreter and thus the processing itself uses a clock tick approach
and triggers calls of the changed method each time a tick occurs instead of calling it directly after a value has changed. This is a major disadvantage of ICON because already
processed data has to wait for an upcoming tick. This can result in a delayed interaction
Papier-Mâché
The Papier-Mâché toolkit is an open-source API for building tangible interfaces using
computer vision, electronic tags, and bar codes. This research was carried out by Scott
Klemmer et al. at the University of California Berkeley. It introduces a high-level event
model tearing apart the hardware layer from high-level interaction design to realize tangi-
24
CHAPTER 3. CHALLENGES
Figure 3.4: The graphical user interface of the ICON Input Configurator. An assembled interaction techniques needs the user to route primitive data types from one device to
another.
ble user interfaces. Furthermore, it facilitates technology portability, e.g. an application
can be prototyped with computer vision and deployed with RFID technology.
The primary intention of the authors was to design interaction techniques for tangible
user interfaces using phobs (physical objects) for interaction. Therefore, an input layer
(input types) acquires sensor data, interprets it, and generates phob events. A developer is
responsible for the selection of input types such as RFID or vision but he is not responsible
for discovering devices, connect to them and generate events from the input. Currently
supplied input types are vision, RFID, and barcode but they could easily be enhanced by
experienced programmers. On the one hand, the framework could be enhanced easily by
a programmer but on the other hand, a user needs advanced programming skills even to
develop simple interaction techniques (e.g. controlling a phyiscal knob).
ICARE
ICARE stands for Interaction-CARE (Complementarity Assignment Redundancy Equivalence) and is a high-level component-based platform for building multimodal applications.
It was introduced in 2004 by Jullien Bouchet and Laurence Nigay [11] and based on previous attempts of the CARE principles, which was also done by Laurence Nigay [58]. Before
starting with ICARE a brief introduction in the four principles of CARE is provided.
Complementarity
Modalities complement each other if they are used together for the same task – not mandatory synchronously – and one modality supplements the others. For instance a user is
3.1. CRITERIA ON A DESIGN ENVIRONMENT
25
Figure 3.5: The graphical user interface of Papier-Mâché allows debugging of an interaction technique.
26
CHAPTER 3. CHALLENGES
articulating “put that there” while he is selecting an object similar to Richard A. Bolt’s
“Put-that-there” [9].
Assignment
An interaction is assigned to an action if no other interaction equivalent exists for a particular task. For example, a user can move a window several pixels to the left using the
mouse only.
Redundancy
Different modalities used synchronously cause the same action and thus result in the same
outcome. For instance, a user presses an accept button while articulating the phrase/sentence “accept input”.
Equivalence
Modalities are equivalent if the action triggered by two or more devices causes the same
result. For instance, a user typing words using a keyboard is equivalent to a user spelling
words using speech recognition.
Based on these principles the ICARE toolkit provides a language to define interaction for
multimodal applications especially throughout the Complementarity principle. Two kinds
of components are provided by ICARE. First the elementary components and second the
composition components. The elementary components are split into device components
and interaction language components whereas former builds the interface to physical devices that inquire information (e.g. mouse, microphone, and tablet). Latter interaction
language components define a set of well-formed expressions that convey meaning of an
input modality (e.g. grammatical rules for speech input). Furthermore, the CARE principles are wrapped in the composition components and are in contrast to elementary
components generic in the sense that they are not dependent on a particular modality.
Although a visual designer for the design of multimodal interaction is planned, it has not
been released to date. Thus, users have to programmatically design interaction techniques
and therefore need an expertise in programming.
The OpenInterface Framework & SKEMMI
The OpenInterface Framework is a component-based tool for the design of so-called postWIMP user interfaces and supersedes the ICARE toolkit. It offers a flexible software
framework and integrates several devices and toolkits for providing better ways of developing multimodal interaction techniques. Furthermore, it supports an iterative design
during prototyping phases to build a more intuitive interaction for post-WIMP applications.
The framework itself is decoupled from the runtime-platform and the design tools. It
consists of the OI Kernel that is responsible for data processing and accomplishes interaction between humans and computers. Interaction designers are supplied with two
independently suitable graphical user interfaces that both support the iterative design of
3.1. CRITERIA ON A DESIGN ENVIRONMENT
27
interaction techniques – SKEMMI (see Figure 3.7) and its predecessor OIDE (see Figure 3.6).
OIDE – OpenInterface Development Environment
The OIDE is built on top of the platform-runtime and uses abstraction by isolating users
from low-level programming details and enables them to plug and play with modalities.
This is very beneficial when reusing work that has been done in previous stages extending
or altering it with other input modalities. It allows users to assemble modalities using
drag and drop and link them to pipelines. Such pipelines are components interpreted by
the kernel.
Figure 3.6: The OpenInterface Development Environment (OIDE) supports users visually in the
design of post-WIMP interaction techniques.
Despite being supported by such a visual language, the user has to to route each data individually from one nodes output to another nodes input. Furthermore, the integration of
new modalities requires a developer to command C or Java, XML, and the OpenInterface
specific formats CIDL and PDCL.
SKEMMI – Sketch Multimodal Interaction
SKEMMI supersedes the OIDE as graphical user interface for the OI Kernel. It offers users
a homogeneous design environment to run and quickly modify multimodal interaction Ð
there is no need to switch to a further IDE because it is integrated into the Eclipse
IDE as a plugin. Furthermore, the creative process of interaction design is supported by
three different levels of “interaction sketching”. An interaction designer can start simply
by defining involved components such as mouse input, Wii Remote, and mouse output.
These components are conveyed then to the next level automatically where the interaction
designer links these components primitively. At the last level, the user can link components
28
CHAPTER 3. CHALLENGES
finally and further adjust properties of the components.
(a)
(b)
(c)
Figure 3.7: The three layers of “interaction sketching”: (a) an abstract linking of involved interactive components, (b) conceptualizing a component’s output and input, and (c)
adjusting properties and route a component’s output to another component’s input.
Although, design and development of interaction techniques is integrated into a single IDE
the user still needs to have expertise in diverse programming languages and formats (e.g.
C or Java, XML, CIDL, and PDCL). In addition, a running interaction technique needs
to be stopped and restarted before adjustments on the component’s properties are applied
to the interaction.
In conclusion, to lower the threshold but keep a high ceiling a user should be faced with
only one programming language. Furthermore, the user should be supported by a visual
programming language that allows fast development iterations (e.g. adjusting a filter’s
properties) and minimizes a user’s cognitive strain by not overwhelming him with unnecessary functionality.
Today’s toolkits support high-level development and evaluation of novel interaction techniques. Most of these toolkits inherit dataflow programming embedded in a design environment based on a visual cable patching metaphor. Although the toolkits for interaction
design are well-known, there is no objective measure to classify or rate the usability of
such systems. Therefore, by means of interaction design, we establish criteria that constitute essential features to such a toolkit and thus assist users in their design process.
Additionally, these criteria serve as valuable input for developers of such an interaction
design tool. In the following section we apply these criteria on existing toolkits and show
how these criteria match or mismatch on implemented features of the toolkits.
These criteria are similar to “Characteristics of different tools for creation of multimodal
interface” put by Bruno Dumas et al. [22, p. 17]. Nevertheless, the focus of the criteria
above is to support a user in his design and not the design done by a user. Therefore,
different roles involved in the creative process of interaction design have been identified to
provide a tailored design environment that supports the design of natural user interfaces.
3.2
User Roles
The development of interaction techniques engages several distinct users performing very
heterogeneous tasks. For example, an end-user employing an interaction technique has
other requirements than an interaction designer developing an interaction technique –
Application
Programming
Interface
Ready-to-use components
Reuse of components
Manageable complexity
Component suggestion
Multi-platform support
Expandability / extensibility
Embedded source code
Direct manipulation
Versioning
Multimodal interaction
+
+
+
+
+
+
+
+
+
ICARE
ICON Input Configurator
+
+
+
Papier-Mâché
+
+
+
+
+
+
+
+
+
OpenInterface
Table 3.1: The conclusive enumeration of toolkits linked to the established criteria. The (+) sign indicates a matched criterion and the empty
space indicates room for improvements.
3.2. USER ROLES
29
30
CHAPTER 3. CHALLENGES
running an interaction technique versus writing source code programmatically to be more
precise. However, to offer a single design environment that matches the claims we needed
to identify all users that are involved in an interaction design process. Therefore, the
theoretical model of user roles by Constantine and Lockwood serves as foundation to
organize users according to their pragmatic needs.
A user role is an abstract collection of needs, interests, expectations, behaviors, and responsibilities characterizing a relationship between a class or kind
of users and a system. [18]
In order to clarify the requirements of a design environment that supports interaction
designers in their daily work, several user roles have been identified. The theoretical foundation to these user roles have been abstracted from two usage-centered design approaches.
First the usability engineering approach by Mayhew [53] and secondly a compendium of
usability that is the “Leitfaden Usability [19]” of the “Deutsche Akkreditierungsstelle Technik”. Similar to Mayhew’s four roles of usability engineering [53, p. 483], a set of four
distinct user roles has been established. This set of user roles consists of:
• End-User
• Interaction Designer
• Interaction Developer
• Framework Developer
The literature mentioned above describes in more detail models to generate user roles.
Nevertheless, these models either do not match the requirements to such a design environment or are of such an abstractness that a relationship between real users and one or more
user roles cannot be established adequately. For instance, the doctrine of Jacobson in his
approach of object-oriented software engineering rather refers to the terminology of actors.
An actor could either be a real user or refer to the hardware or software counterparts such
as an application process [33]. This project, with considerations to the usage-centered
design, focuses and emphasizes on the real users and computers play a less important role.
The next sections characterize each user role textually and furthermore offers distinctive
characteristics of each role according to the role modeling approach by Constantine and
Lockwood [18, p. 81]. In addition, these roles are ordered to the principle of incremental
learning of programming languages that have been researched by Myers et al. [57].
3.2.1
End-User
At the very end of an interaction design cycle, there is the End-User user role. The
intention of an interaction designer is to provide a simple yet powerful interaction to users
with a user role like that.
End-User
frequent use; rapid, easy operation; unsophisticated uses;
unaware of usage; task-based, activity-based usage
fluent changes; many transitions.
3.2. USER ROLES
31
These users do not want to be aware of the underlying design environment or even the
preliminary development efforts. They will use diverse input devices and output devices
to frequently interact with their analogue or digital counterparts. Furthermore, excessive
learning efforts regarding a specific device can signify its off and if it is the only input device
it can lead to an unusable application. A major aspect in more natural applications is
the ability given to users to change input devices and output devices fluently or augment
current input with further devices according to their current needs or preferences. For
instance, a user pointing with the index finger of the right hand towards an object from a
distance may want to complement interaction seamlessly with naturally speaking [9].
3.2.2
Interaction Designer
The term “Interaction Design” relates to two domains in the discipline of shaping interactive products and services as Lowgren puts it [48]. First, interaction design can be
regarded as a design discipline, e.g. for sketching, building models, and expressing ideas in
other tangible forms. Several working disciplines such as industrial design, graphic design
and architectural design are affected hereby. Secondly, it can be seen as an extension of
the HCI where it builds a complement to the area of field study and evaluation. Basically, field studies and evaluations pointing out usability issues and reveal design flaws.
The interaction design tackles issues identified by such studies and provide constructive
solutions.
Interaction design – To determine the feedback and effects of the system
based on human behavior. [68, p. 132]
From the perspective of an interaction designer who is responsible for the design of natural
user interfaces, the latter forms the main requirements concerning the design environment
described in this thesis.
Interaction Designer
casual use; rapid, easy operation; low threshold;
standard usage; implementing designed concepts;
frequent testing; fast iteration.
The role of an interaction designer is characterized by casual usage of interaction design
toolkits. Additionally, the design of an interaction technique is a highly iterative process of
defining input devices, output devices, and filter techniques. Subsequent refinements and
adjustments to the settings of filters require an interface that is prominent in the aspects
of “ease of use” and “easy to learn”. Hence, expert users as well as novice users should
be supported in equal measure, which points out the low threshold [56]. Furthermore, a
simple language needs to be found to provide a basic level for concept design discourses
among several instances of interaction designers. This is visual language is preferably, as
research findings by Pandey and Burnett [62] showed empirically, that programmers were
more successful in constructing programs when using a visual language compared to its
textual counterpart. Especially, when programmers have different pre-existing knowledge
in textual programming languages and had to to find a common denominator. Indeed,
interaction designers often have limited experience and skills in programming device driver
32
CHAPTER 3. CHALLENGES
integration in particular, which demands an expertise in operating system and kernel
coding.
3.2.3
Interaction Developer
The more proficient role of an interaction developer compensates the interaction designer’s
lack of programming expertise. A user who has an assigned interaction developer role possesses in-depth experience in device drivers and their integration into operating systems,
interface and network protocols, software design patterns and anti-patterns [75], complex
algorithms, and not least one or more programming languages.
Interaction Developer
infrequent use; long time; high ceiling; experienced;
expert; focus on stability; algorithm affine.
Moreover, the interaction developer makes infrequent use of the design environment as
novel input and output devices as well as improvements on filters are sporadic and do
not rely on a periodic time schedule. However, if such an integration is necessary the
development process can take up much more time than the iterative development of an
interaction technique. Even if the development threshold should be at a minimum, the interaction developer needs most of the flexibility and power of the underlying programming
language, which leads to a high ceiling in analogy to Myers analysis [56]. In summary,
a smooth transition between interaction designer and interaction developer is desired to
achieve the maximum range between low threshold and high ceiling.
3.2.4
Framework Developer
Less important to an interaction design toolkit but worth mentioning is the framework
developer. The challenge of this user role is to proffer a design environment both to visually
design interaction techniques as well as an easy textual admission to allow integration of
novel toolkits and frameworks programmatically.
Framework Developer
infrequent use; long time; high ceiling; experienced;
expert; focus on stability.
Compared to the interaction developer, the framework developer will not use the design
environment in such a way that he implements techniques usable for interaction design.
This user role is rather aims at stabilizing the existing core and further amplifying the
framework with tools to provide a more comfortable basis for all of the three previously
introduced user roles.
In contrast to the related work, we differentiate further users employing the design environment or more precisely the interaction library although the primary user role is stated
by the interaction designer role. This enables users who constitute different user roles
to work with the same user interface regardless of which development phase they reside
(e.g. implementing novel filter techniques, iteratively testing filter settings, or employing
3.2. USER ROLES
33
an interaction technique). Indeed, the previously established criteria and the elaborated
user roles pose challenges for the development of an interaction design environment but
implementing such a design environment that faces these challenges can help to design
more reliable, enjoyable, and more natural user interfaces. In the next chapter we present
implemented concepts on the basis of the interaction library Squidy.
34
CHAPTER 3. CHALLENGES
Chapter 4
Squidy – A Zoomable Design
Environment
Contents
4.1
Focus Group . . . . . . . . . . . . . . . . . . . . . . . . . . . . . . 37
4.2
Visual Programming Language . . . . . . . . . . . . . . . . . . . 38
4.3
Dataflow Programming . . . . . . . . . . . . . . . . . . . . . . . . 40
4.4
Details on Demand . . . . . . . . . . . . . . . . . . . . . . . . . . 52
4.5
Node Repository . . . . . . . . . . . . . . . . . . . . . . . . . . . . 62
4.6
Visual Debugging . . . . . . . . . . . . . . . . . . . . . . . . . . . 64
4.7
On-the-fly compilation and integration . . . . . . . . . . . . . . 67
4.8
Visual Clutter Prevention . . . . . . . . . . . . . . . . . . . . . . 68
4.9
Software Engineering Aspects and Metrics . . . . . . . . . . . . 70
4.10 Formative Evaluation Study . . . . . . . . . . . . . . . . . . . . . 76
“Software suppliers are trying to make their software packages more
’user-friendly’ [...] Their best approach so far has been to take all the old
brochures and stamp the words ’user-friendly’ on the cover.”
— Bill Gates
In this chapter we explain the design rationales of the implemented interaction library
Squidy with help of the criteria and user roles of the previous chapter (see Chapter 3).
Squidy combines several tools into one homogeneous design environment. This design
environment offers a simple visual language to interaction designers, which in fact assists
users with less or no programming experience during conception and design phases. It
integrates very heterogeneous device drivers, frameworks, and toolkits in a single interaction library and is based on a visual dataflow programming language where no textual
programming is needed and thus the visual design process is highly supported
These integrated drivers, toolkits, and frameworks are provided by visual nodes that process a dataflow independently. This data originating from input device nodes can be routed
later to further nodes using the visual “pipe-and-filter” metaphor. Such links are created
35
36
CHAPTER 4. SQUIDY – A ZOOMABLE DESIGN ENVIRONMENT
by the interaction designer, highlighted visually again. In summary, the dataflow is created by adding nodes to a processing composition or more precisely to a pipeline and by
connecting these nodes with pipes to establish a dataflow. All of this is achieved by simple
drag and drop operations. Further concepts such as semantic zooming, details on demand,
interactive properties, filter adjustments, and on-the-fly compilation and integration try
to support the highly iterative process of interaction design.
The most important challenge is the ability to provide a single and homogeneous design
environment supporting all engaged user roles presented in the previous chapter (see Section 3.2). Furthermore, the design environment should support the visual design of interaction techniques, the programmatic extensibility of input and output devices and filters
as well as an integrated runtime environment to run interaction techniques dedicatedly.
The denotation Squidy is deduced from the English noun squid and constitutes the belittlement of the same. It is used as a metaphor for the nodes, the pipes and the dataflow
applied in the interaction library. Here, the nodes can be seen as the acetabulum, the
pipes are the tentacles, and the dataflow is the ink “flowing” through the little squid.
(a)
(b)
Figure 4.1: Early sketched low-fidelity and high-fidelity prototypes of the design environment: (a)
a sketch already constituting visual dataflow programming, and (b) an interactive
prototype created with the prototyping tool iRise constituting interaction concepts
of Squidy.
Before any source code was written to implement the interaction library Squidy, early
sketches and mockups were created to identify design flaws and thus increase the usability of the end-product. The first low-fidelity and sketched prototype already illustrates
the visual language based on a “pipe-and-filter” metaphor (see Figure 4.1 (a)). Another
high-fidelity and interactive prototype implemented with the prototyping tool iRise1 allowed observers to perceive the interaction concepts used for the interaction library Squidy
(see Figure 4.1 (b)). In 1996, Robert A. Vizri et al. indicated the importance of prototyping as:
1
iRise empowers stakeholders to test drive and fully interact with proposed business software before any
coding which eliminates confusion about what to build, cuts project cost and accelerates delivery –
http://www.irise.com/
4.1. FOCUS GROUP
37
[...] using a carefully constructed low-fidelity prototype, the designer should
be uncovering the same types of problems as if a high-fidelity prototype were
used. [78]
Hence, the prototypes allowed us to illustrate concepts to a professional audience that
has experience in interaction design and thus helped to identify design flaws during the
conception of Squidy. As it is not the scope of the thesis only two prototypes are illustrated (see Figure 4.1). The complete collection of sketches, low-fidelity and high-fidelity
prototypes, and screen mockups can be found on the attached DVD.
In order to enhance Squidy’s usability with further user interface concepts and to upgrade
the stability with approved software engineering patterns, we regularly arranged small
meetings of experts comprised of three to four interaction designers and software engineers.
Beyond that, a focus group was conducted several times after the first stable release of
Squidy was available.
4.1
Focus Group
For the reason of conducting a focus group we released and distributed a version of the
interaction library Squidy as a standalone application among members of the HumanComputer Interaction Group at the University of Konstanz. The concepts implemented
in that version of Squidy are described in a research paper by Werner A. König et al [43].
Moreover, the profession of the group members applied to the interaction designer user
role and in thus constituted potential users of Squidy. In order to receive the feedback
of these users, we conducted a formal focus group to discuss its practicability, to discover
design flaws, and types of problems during usage. This focus group was accomplished in
June 2009 and guidelines such as the “Using Focus Groups in Program Development and
Evaluation”2 helped to control the discussion since it states five rules essential to focus
groups:
• composed of six to twelve people,
• who are similar in one or more ways, and
• are guided through a facilitated discussion,
• on a clearly defined topic,
• to gather information about the opinions of the group members.
Usually results of evaluation studies are presented at the end of an experiment introduction. In this thesis individual results of the focus group will be presented in the paragraphs
corresponding to the surveyed concepts. This tight coupling of concepts and results enables readers of this thesis to comprehend superiorly idea and impact. Nevertheless, this
different approach of presenting evaluation results still requires a brief introduction into
the experimental setup beforehand.
2
http://www.ca.uky.edu/Agpsd/focus.pdf
38
CHAPTER 4. SQUIDY – A ZOOMABLE DESIGN ENVIRONMENT
Ten participants with a background in interaction design and user interface design formed
the group (see Figure 4.2). The conductor, who was also a member of this working group,
guided the discussion by defining current topics. Another group member was recording
the essence of the discussion, which overall lasted about 4 hours.
(a)
(b)
(c)
Figure 4.2: The conducted focus group: (a) the group of participants discussing, (b) digitally
persisted results, and (c) paper-based notes made during execution.
In the following part, the design rationals of Squidy are presented in detail and if possible
it will be back referenced to the results of the conducted focus group. Moreover, proposals originating from the conducted focus group have already been applied in further
implementation phases of the interaction library Squidy.
4.2
Visual Programming Language
If pen and paper – or similar facilities – are available, people communicating to each other
often use intermediate or meta-level languages to visually illustrate problems, solutions or
simply directions (e.g. waypoints and walking directions). Especially when it comes to
picture directions or flows, such drawings are similar to visual graphs.
Since this kind of visual language is already used in discussions and meetings it can be
transferred simply to other domains such as computer and information science. For instance, in textual programming languages a user needs to have knowledge about the syntax
of a programming language, which can be compared to a grammatical syntax in a natural
language. Furthermore, he has to cope with the underlying API such as classes and functions by only using basic functionality. A research paper by Clayton Lewis and Gary Olson
takes this problem into consideration focusing on fundamental issues that relate to people
themselves, such as why programming is hard to learn and hard to perform [47]. In that
case the authors notice that users with less or no programming experience are not well
supported by textual programming languages. In the field of interaction design users often
do not have well-established programming skills. However, interaction designers already
use sketching techniques to design user experiences [13]. These kind of users are familiar
with such visual languages anyway. Even though they use it for different purposes, the
underlying idea remains the same: iteratively design user experience. The assumption
is that a visual language can empower interaction designers and lower the threshold of
designing interaction techniques without having an expertise in textual programming.
39
4.2. VISUAL PROGRAMMING LANGUAGE
Despite the positive effects of such visual programming languages (VPLs) (see Figure 4.3)
Thomas R. Green and Marian Petre have shown on the basis of LabVIEW3 and Prograph4
that every visual notion has drawbacks among all assets [27]. For instance, the abstraction
gradient of visual components is sometimes incoherent to human thoughts.
LabVIEW is a platform and visual programming environment for measurement engineering, control engineering, and automation engineering (see Figure 4.3 (a)). National Instruments released the first version of LabVIEW in 1986. Prograph is an application that
substitutes textual object-oriented programming with a visual approach. There, objects
are represented by small iconic symbols (see Figure 4.3 (b)). It was developed at the
Acadia University in Canada and were published in 1983 for the first time.
(a)
(b)
Figure 4.3: Visual programming languages surveyed by Green and Petre: (a) LabVIEW developed by National Instruments, (b) Prograph developed at the Acadia University in
Canada.
Furthermore, Green and Petre established a “Cognitive Dimensions” framework that forms
thirteen characteristics essential to visual programming languages considering the cognitive strains of users, such as “Abstraction Gradient”, “Error-proneness”, “Progressive
evaluation”, or “Viscosity”. They used the framework to analyze LabVIEW and Prograph
(see Figure 4.3), which state two representative applications providing a VPL [27]. In
summary, VPLs provide substantial advantages over conventional textual languages but
need further research in terms of to the HCI perspective. Furthermore, enhancements
in visual notion, editing capabilities, and an improved searching facility will increase the
usability of VPL based applications.
Nevertheless, Alan F. Blackwell et al. have used the “Cognitive Dimensions” framework
to empirically evaluate textual versus diagrammatic programming from a psychological
perspective. Their research paper concludes with previously conducted studies that have
found unconvincingly evidence concerning the benefits of VPLs [8].
However, both evaluations support VPLs since applications based on a visual language outperform textually based programming applications. Therefore, the fundamental concept
3
4
LabView is an acronym and stands for Laboratory Virtual Instrumentation Engineering Workbench
Prograph is an application that substitutes textual object-oriented programming with a visual approach.
40
CHAPTER 4. SQUIDY – A ZOOMABLE DESIGN ENVIRONMENT
of the design environment is based on a visual programming language. The challenge is to
solve outstanding issues concerning such VPLs and augmenting the design environment
with further concepts like dataflow programming, which can empower visual programming
languages. The concept of dataflow programming and its challenges will be described in
the next section.
4.3
Dataflow Programming
Dataflow programming is based on a different computing architecture compared to objectoriented programming, procedural programming, and declarative programming. Dataflow
programming features its own dataflow language and was originally developed in order
to ease the development of parallel programming on non-von Neumann architectures.
Similar to state machines, the language consists of several states and allows operations on
the dataflow occurring between the states. These states are commonly known as nodes. In
contrast to functional programming and instead of calling functions sequentially, atomic
data is sent along an edge of two adjacent nodes. This data routing enables “real” parallel
processing as nodes are acting independently of each other and are further free from side
effects. William B. Ackermann [1] established a list of best features that appear to be
essential to dataflow languages. This list was refined by Paul G. Whiting and Robert S.
V. Pascoe [84] and Simon F. Wail and David Abramson [80]. Wesley M. Johnston et al.
comprised these insights to six features constituted in the following list [35]:
1. freedom from side effects,
2. locality of effect,
3. data dependencies equivalent to scheduling,
4. single assignment of variables,
5. an unusual notation for iterations due to features 1 and 4,
6. lack of history sensitivity in procedures.
On basis of these features several methods of dataflow programming evolved over the years.
The best known approaches are token-based dataflow and data-driven dataflow. These
approaches are based on the same concept, which on the one hand is a data structure
conveying significant information and on the other hand are nodes processing incoming
data and providing computed results on the output. Nevertheless, they differ in the manner
of data delivery that is either data requesting or data sending. The latter is pushing data
to next connected nodes. However, back in 1980 most computers were working with von
Neumann processors and could not process data in parallel. Then, new approaches using
threading technology such as threaded dataflow and hybrid dataflow evolved. This allows
virtually parallel processing on von Neumann-based processors and ,for instance, is used
for digital signal processing.
A well-known substitute of dataflow programming languages forms Lucid developed by Bill
Wadge and Ed Ashcroft [79, 4]. It is designed to experiment with “non-von Neumann”
programming models and is based on a demand-driven model for data computation. The
4.3. DATAFLOW PROGRAMMING
41
demand-driven model published by Lucid uses several processors combined as network of
processors whereas these processors request data if computational power is available. The
dataflow is programmed textually as it can be seen in Listing 4.1 [79, p. 124]. This example
shows how prime numbers can be computed by such a textual dataflow programming
language.
Listing 4.1: A program written with the Lucid dataflow programming language that computes
prime numbers.
prime
where
prime = 2 fby ( n whenever isprime ( n ));
n = 3 fby n + 2;
isprime ( n ) = not ( divs ) asa divs or prime * prime > N
where
N is current n ;
divs = N mod prime eq 0;
end ;
end
Nevertheless, programmers of Lucid manage complexity by visually defining the dataflow
during conception phases and translating the visual outputs to textual dataflow programming afterwards (see Figure 4.4). This visual notion provides a more illustrative representation of a similar prime number computation.
Figure 4.4: A flow graph that conceptualizes a Lucid program computing prime numbers.
42
CHAPTER 4. SQUIDY – A ZOOMABLE DESIGN ENVIRONMENT
Even if a user knows how to copy his mental modal to Lucid’s dataflow driven approach,
he first has to learn the language and then requires to transfer it textually to an underlying
programming language. In 1966, William Sutherland combined the two approaches of a
visual programming language and dataflow programming into a dataflow visual programming language (DFVPL). As a result, he enriched the dataflow programming paradigm
with the aspect of graphical visibility. This was one of the first DFVPL [76] that is basically
somewhat like logic circuit diagrams. In contrast to textual dataflow programming, such
visual programming copes in most cases with users’ mental model of dataflow programming. Furthermore, an empirical study conducted by Ed Baroth and Chris Hartsough [5]
has shown that LabVIEW is favored by users in projects compared to developing the same
system in C, which argues in favor of a visual dataflow programing language supporting
interaction designers with less or no programming expertise. Moreover, the development
of a common language poses a challenge that needs to be solved in order to enable a
dataflow between the hardware devices and filters involved in an interaction technique.
The concepts of a common language will be described in the next section.
4.3.1
Generic Devices and Data Types
As previously mentioned, unifying heterogenous devices, toolkits, frameworks, and filters
in a homogeneous design environment requires an unique language or, more precisely, a
database that allows data exchange between components (e.g. a computer mouse controls
a mouse cursor). Such a unification is similar to the generalization of graphic input devices
based on their semantics by Victor L. Wallace [81].
[...] a set of virtual devices which appear to be complete and “machineindependent”, and to simultaneously allow reasonable preservation of device
and program power, efficiency, and flexibility. [81]
These semantics of graphic input devices consist of five distinct virtual devices: the valuator, the locator, the button, the keyboard, and the pick (see Figure 4.5). Moreover,
these distinct virtual devices evolved in the consensus of a good symbiosis between man
and machine conversation.
Figure 4.5: The semantics of graphics input devices developed by Wallace [81]. This set consists
of five distinct types of virtual devices.
Furthermore, such distinct values are able to reflect a humans’ behavior in everyday life
such as explicit knowledge (e.g. pointing, grabbing, speech, and gestures), tacit knowledge
(e.g. balance), and further characteristics of the surrounding environment (e.g. blinking
light).
4.3. DATAFLOW PROGRAMMING
43
A designer of conversational graphic systems should be concerned with:
guaranteeing complete and efficient discourse, reducing the psychological distance by avoiding unnecessary trauma, improving the naturalness of the discourse by improving syntactic regularity on the action language (notably, sentence structuring and continuity); using the local equivalences among action
devices to exploit their psychological differences and choosing implementation
of action language constructs to suit the context. [26] (emphasis added by the
author)
The bottom line of the quotation above relies on the authors’ efforts of providing a discourse (corresponds to the previously named language and database) between the opponent
and unreflecting machine that should be as much natural to the human as possible. In
the following parts each distinct virtual device will be introduced shortly.
Valuator
A valuator is a one-dimensional value within the real vector space. For example, rotating a
potentiometer sends discrete values whereas the vector increases when rotating clockwise
and decreases when rotating counter-clockwise. A linear prototype would be a linear slider
component.
Locator
A locator reflects a unique position and orientation in a vector space. This can be a twodimensional vector in its primitive representation (e.g. a location of a cursor on a planar
display). Furthermore, multi-dimensional values are possible such as a 6DoF5 vector including x-, y-, and z-axis value plus the three rotational values pitch, yaw, and roll around
the 3d location.
Button
A button as a primitive device that can represent boolean states and the like. Values such
as true/false, 0/1, and on/off are potential values of a button device . The most popular
device equipped with button devices is the computer mouse. Several mouse buttons response to user input such as “press” or “release”.
Keyboard
A keyboard device is a sequence of ASCII characters. Each sequence can be terminated
by a particular character sequence such as the zero-byte in a null-terminated string. The
prototype of a keyboard device is the keyboard as input device. In addition, a modem can
provide a serial of characters too.
Pick
The device type “pick” developed by Victor L. Wallace (see Figure 4.5) cannot be projected yet onto the generic data type hierarchy due to the lack of unavailable element
references of visual components of the user interface. A possible solution on how such
visual object references can be projected onto the generic data types of Squidy will be
5
6 Degrees of Freedom including a vector in three-dimensional space (x, y, z) and rotation axis (pitch, yaw,
roll)
44
CHAPTER 4. SQUIDY – A ZOOMABLE DESIGN ENVIRONMENT
introduced in Section C# Bridge (see 6.1.1, page 101).
As a consequence of the full-fledged preliminary work provided by Victor L. Wallace, you
are able to unify very heterogeneous devices, toolkits and frameworks into a generalization of various kinds of input and output data to a hierarchy of well-defined data types
(see Figure 4.6). This data hierarchy in Squidy is thus based on the previously introduced
primitive graphic devices. Any data processed in Squidy consists of single or combined
instances of these basic data types generic data types (see Figure 4.6). Furthermore, the
work of William Buxton [14], Stuart K. Card et al. [15], and Jingtao Wang and Jennifer
Mankoff [82] has been conducted to achieve a reasonable data model. Each generic data
type consists of a type-specific aggregation of atomic data types such as numbers, strings
or Boolean values bundled by their semantic dependency. This is a quite different approach compared to some of the aforementioned frameworks such as the ICARE [10] and
OpenInterface [71, 45]. These frameworks use atomic data types defined in the particular
programming language and assign them visually by connecting result values with function
arguments in their specific user interfaces. In order to use the functionality of a module
in these frameworks, the user has to route each of these low-level data types manually.
Each x-, y-, and z-value of a three-dimensional data type has to be routed separately,
for example. This is a procedure that needs additional effort and can be error-prone,
especially when designing complex interaction techniques. Furthermore, this approach requires detailed knowledge about the functionality of each node and its arguments. Routing
low-level data types, therefore puts high cognitive load on the user and leads to visually
scattered user interfaces, particularly as the number of connected nodes increases.
Squidy, on the other hand, does not require the interaction designer to visually define every
value manually. The interaction data is grouped in semantically bundled data containers
consisting of multiple generic data types as mentioned before. Squidy therefore offers
the abstraction and simplicity of a higher-level dataflow management and reduces the
complexity for the interaction designer without limiting the required functionality.
To sum up, we have established a basis for a visual programming language which is based
on dataflow programming. In contrast to textual dataflow programming languages such
as Lucid, the dataflow in Squidy is designed visually. Furthermore, the database necessary
to perform dataflow and thus route data from one processing node to adjacent nodes have
been established using a hierarchy of generic data types based on the semantics of graphic
input devices by Victor L. Wallace [81]. In the next section, we will introduce how these
concepts apply to the “pipe-and-filter” software engineering pattern.
4.3.2
Pipe and Filter
The importance of parallel data processing introduced previously builds up a challenging
task in the software engineering part of the design environment. A pattern needs to be
found that matches the requirements and allows both visually define a dataflow as well as
parallel signal processing. The software design pattern named “pipe-and-filter” [12, 69] or
synonymy “Data Flow Architecture”6 matches these criteria needed to a dataflow visual
programming language. The pattern comprises filters and pipes. A filter is a processing
6
http://msdn.microsoft.com/en-us/library/ff647419.aspx
4.3. DATAFLOW PROGRAMMING
45
Figure 4.6: The data type hierarchy according to the semantics of graphic input devices developed
by Wallace [81]
unit similar to a CPU that computes a result from a given input. A pipe links two nodes
together and routes computed output from one node to the input of another. Concretized
types of filters are sources and sinks. Basically, a source generates data originating from
devices such as the mouse input device. In contrast, a sink dumps data in a serialized or
any other forms to devices such as a vibrant motor. Although, filter is the superordinate
concept of the software design pattern in the remaining paragraphs, node is used as a synonym to avoid confusion when referring to filter. A roughly sketched prototype illustrates
the concept of visual dataflow programming and consists of five squared nodes (including
three filters, a source, and a sink) that are connected to each other through pipes (see
Figure 4.7).
Furthermore, nodes and pipes can be comprised to a higher-level component that aggregates complexity (see Section 3.1.4 – Manageable complexity) in a single pipeline. Such
a pipeline can be understood as a similar concept to the manufacturing process of gasoline. Here, sources conform to oil platforms, sinks to refineries and filters to chemical
treatments. Pipes link these components subsequently together and result in a cohesive
topology. This topology is also known as pipeline.
One of the major requirements of the design environment is to visually support the design of interaction techniques. The visual design reduces complexity (see Section 3.1.4 –
Manageable complexity) and enables direct manipulation (see Section 3.1.9 – Direct manipulation) on an interaction technique. A node base supplies users with particular nodes
augmenting an interaction with further facilities. The node base can be seen as generic
node contributor and will be exemplified in Section 4.5 in detail but until then nodes are
taken for granted. Such a node composition is sketched in Figure 4.8 whereas the white
background constitutes the composition area for designing interactive pipelines (in the
middle of the sketches). The user simply drags a node out of the node base and drops it
46
CHAPTER 4. SQUIDY – A ZOOMABLE DESIGN ENVIRONMENT
Figure 4.7: A pipeline consisting of a source (laser pointer), several filters, and a sink (cubes)
that are connected to each other through pipes. This sketch of a pipeline reflects a
user’s mental model of a signal data processing chain.
on the pipeline (a, b). By dropping further nodes on the pipeline and successively link
these nodes with pipes an interaction pipeline emerges (c, d).
Although the “pipe-and-filter” concept was well understood by the participants of the
focus group, they argued that the clean white background of the pipeline does not convey
a prototyping environment for interaction design. Therefore, a visual representation of a
pipeline implemented in the Squidy interaction library has a checkered background instead
of a clear white background to be suggestive of a sketchy paper (see Figure 4.9). Moreover, it is silhouetted against the application background and thus defines the interaction
designer’s playground.
In convenience, node is also a synonym for pipeline as the following concepts such as
object-oriented actions apply to both nodes as well as pipelines. These actions that can
be performed on nodes and pipelines (e.g. start an interaction technique) are described in
the following paragraphs. Furthermore, nodes can be zoomed in and out and thus have
two visual representations. First, the zoomed out state displays a representative node
name and a symbolic icon (see Figure 4.10) and second the zoomed in state reveals more
node details on demand (see Figure 4.9). These zooming concepts will be described in
more detail in Section 4.4.
4.3.3
Node Actions
In standard WIMP user interfaces, actions are provided graphically by menus and contextual menus. Such an action is invoked on an object that needs to be selected beforehand.
For instance, a user first has to select a file before he chooses the delete action. Objects
47
4.3. DATAFLOW PROGRAMMING
(a)
(b)
(c)
(d)
Figure 4.8: The “pipe-and-filter” metaphor on which Squidy is based on: (a) An empty pipeline,
(b) two nodes that have been dragged from the node base on the pipeline: Laser
pointer and Kalman filter, (c) the two nodes are linked to each other by a pipe, (d)
an entire pipeline with source, sink, and filter nodes.
and actions are spatially separated most of the time and coherence between action and
reaction can be a demanding task for users. According to the benefits of direct manipulation interfaces, this can be compared as “The Gulf of Execution” examined by Hutchins
et al. [30].
The relationship between the user’s intention and the organization of the instructions given to the machine is distant, complicated, and hard to follow. [30,
p. 323]
The term direct manipulation was originally coined by Shneiderman [72] denoting a continuous representation of objects (e.g. while dragging), rapid and reversible actions as
well as incremental feedback. Today’s GUIs including WIMP user interfaces make use
of direct manipulation, e.g. resizing a window constantly updates the window shape and
thus provides incremental feedback. Nevertheless, the concept of Squidy is going beyond
the concept mentioned above and provides object actions directly at the location of an
object (see Section 3.1.9 – Direct manipulation). By means of that, distinct actions stick
to the object and can differ according to the type of an object.
The actions that can be triggered on a node will be described in the following enumeration
and is further illustrated in Figure 4.10.
48
CHAPTER 4. SQUIDY – A ZOOMABLE DESIGN ENVIRONMENT
Figure 4.9: The visual representation of pipeline implemented in the Squidy interaction library
with a checkered background.
49
4.3. DATAFLOW PROGRAMMING
1. Start: Starts the implemented algorithm of a node, allocates required processing
resources and activates the node as ready for processing.
2. Stop: Stops the algorithm, tears down any allocated resources and sets the node
status as not processing.
3. Delete: Deletes a node from the pipeline and frees all previously allocated resources.
4. Duplicate: Duplicates a node by copying all of its properties, which then is an
equal clone besides it is a distinct object instance.
5. Publish: Publishes the node and all of its properties to a common repository of
nodes. All users of Squidy have access to this repository and thus can use such
published nodes.
6. Update: If a node is originating from the repository this action updates this node
to a recent version.
(a)
(b)
Figure 4.10: A node, e.g. a node to control Powerpoint presentations reveals its actions on
mouse over: (a) The Powerpointer node with the mouse cursor besides the node,
(b) the Powerpointer node with the mouse cursor over the node and the four essential actions start processing, stop processing, duplicate node, delete node (counterclockwise starting from the top left).
In order to not overwhelm the user with unnecessary options, these actions are only provided on mouse over at the zoomed out state of a node. In addition to not overloading
the user interface, only four actions are provided at a glance (see Figure 4.10 (b)). For
instance, a node to control Powerpoint presentations reveals its essential actions on mouse
over. These actions correspond to actions 1-4 in counter-clockwise order starting from top
left. How the actions 5 and 6 can be executed will be described in the next paragraphs.
The zoomed in state of a node reveals a navigation bar, which is providing additional
information related to the node. This navigation bar is located at the top of a node and
provides actions, node naming, and a navigation breadcrumb at a glance (compare Figure 4.9 and Figure 4.11). Furthermore, the actions enumerated previously are altogether
visible in the order 1-6 starting from the left.
50
CHAPTER 4. SQUIDY – A ZOOMABLE DESIGN ENVIRONMENT
Figure 4.11: The navigation bar is displayed at the head of each node. It provides actions
to control the node and inside nodes (only pipelines), the node naming, and a
navigation breadcrumb.
Performing the same action on multiple nodes within a single pipeline, this action has to
be performed on each node separately. For example, if a user wants to start all nodes in
the pipeline of Figure 4.8 (d) he has to click the start button on each node repeatedly in
order to start the complete pipeline. Since a pipeline is a composition of several nodes
and pipes, an action to start all processing units at once will reduce needed interaction
steps. Therefore, each action provided in the navigation bar is executed on all nodes of
a pipeline whereas in the example above a single click is sufficient to start all nodes at once.
In order to generate a more customized and readable pipeline, the names of nodes and
pipelines can be changed. Therefore, a user double-clicks on the name of a node or pipeline
when it is zoomed in. In consequence of direct manipulation [30] the label is replaced by
a text field component. The user then enters a new name and confirms the change by
hitting the enter key whereas the text field is replaced by a label again and the name
change takes place immediately. If the node name has too many characters displayable at
a current graphics space it is going to be cropped. In contrast to standard WIMP user
interfaces, where labels are cropped at the end, here the name is cropped in the middle if
necessary. For instance a labeled “Gesture Recognizer 2D” will be cropped to “Gestu...zer
2D” as in most cases users label nodes of the same type differently either at the beginning
(e.g. “1. Kalman”) or at the end (e.g. “Kalman LP”) and thus essential information is
preserved.
In the early releases of the interaction library the start was replaced by the stop button
when an interaction technique was started. In turn, the stop button was replaced by the
start button when an interaction technique was stopped. A participant of the focus group
argued that it is not easy to recognize the change and repeated clicks on the button are
the consequence, which leads to an undetermined application behavior. Therefore, both
buttons have been separated as it was introduced before.
Up to now, a user can drag and drop nodes on a pipeline and further start either disjointed
nodes or the complete pipeline . Nevertheless, an interaction dataflow is not yet performed
as these nodes need to be linked to each other to allow an exchange of data objects.
4.3.4
Node Linkage
A significant ingredient in dataflow visual programming languages is the graphical representation of the underlying visual language. The “pipe-and-filter” software design pattern
introduced in Section Pipe and Filter (4.3.2, page 44) dictates the visual appearance
(see Figure 4.8). Furthermore, nodes are dragged and dropped on a pipeline and each
51
4.3. DATAFLOW PROGRAMMING
node constitutes a processing unit having impact on a dataflow. These nodes need to be
linked to each other in order to achieve a directed dataflow from sources through filters to
sinks. Hence, nodes need handles to allow such a linkage. Since it is common in DFVPL
that filters provide input ports and output ports for node linkage this concept is assumed
to be well understood and is adopted in Squidy. A black circle with an arrows underneath
constitutes a port (see Figure 4.10). On the left side each node receives the dataflow as
input whereas on the right side each node places computed data as output. Moreover, the
arrows provide additional clues on whether a port is an input port or an output port.
(a)
(b)
(c)
Figure 4.12: The drag and drop interaction needed to link two nodes by a pipe: (a) press and
drag on an output port, (b) drag towards an input port of another node, and (c)
drop intermediate pipe on an input port.
Similar to the drag and drop concept of nodes, the Figure 4.12 illustrates how a user can
link one node’s output to another node’s input. (a) First, he clicks on the output port
of one node and holds the mouse button pressed. (b) Second, while dragging the mouse
towards the input port of another node a pipe feedback is given instantly. (c) At last he
releases the mouse button on the input port of the target node, which then instantly links
the two nodes by a pipe.
The concept of node linkage was understood well by the participants of the focus group
and in contrast to other DFVPL, it is sufficient to route data objects with a single pipe. On
this level interaction designers can assemble pipelines and control the dataflow by routing
data objects from one node to another. Most interaction techniques despite require further
adjustments such as changing variables of a filter technique (e.g. reducing noise level of
a Kalman filter). How users can apply such adjustments will be explained in the next
sections.
52
4.4
CHAPTER 4. SQUIDY – A ZOOMABLE DESIGN ENVIRONMENT
Details on Demand
In the related work [11, 21, 45] indeed basic zooming is existent but is restricted to a
geometrical zoom only. Adjustments to interaction techniques are made through dialogs
and additional windows. Thereby, many of these windows can clutter the user interface
and a user needs to organize the interface manually at which an interaction designer’s
performance can fall off significantly. Such windows are used to provide additional information, e.g. information and descriptions of filters, or output results. Furthermore, when
changing properties of multiple filters in side by side the user needs to assign the windows
to their corresponding filters. Squidy in contrast minimizes window overhead by using
further concepts of a zoomable user interface.
4.4.1
Zoomable User Interface
In conventional user interfaces users can keep track of all information provided through
an application or can get detailed information if desired. Nevertheless “Paging” or “Windowing” strategies hinder users to receive information embedded in a specific context as
Igarashi [31] puts it. In consequence, “Zooming” is a fundamental technique to freely
navigate in multi-dimensional spaces. It further maintains the context while zooming is
performed or lets the user decide whether an overview or detailed information is needed [17]
. Thus, the user can either keep track of all information by zooming out of the information space or get a more detailed view of an object if zooming into the information space
towards a specific target point. Such interfaces are commonly known as zoomable user interfaces (ZUI). These ZUIs mostly relying on geometric zoom operations. Representative
ZUIs are Pad++ [6] and its predecessor Pad [63] or Seadragon7 developed by Microsoft
Live Labs. Furthermore, the frameworks JAZZ8 , Piccolo, and Piccolo2D9 to rapidly develop ZUIs have been engineered by Bederson at the Human-Computer Interaction Lab10
at the University of Maryland.
As “Overview+Detail” is especially useful when the amount of objects exceed humans’
memory capabilities and “Focus+Context” concentrates on a specific object while its contextual information is preserved. However, free geometric zooming has a drawback because
the user has to decide constantly if an object is illustrated optimally.
4.4.2
Automatic Zoom
In conventional ZUIs, the user is occupied additionally with the challenge to decide the
optimal graphical representation of an object while zooming. Here, an automatic zooming
approach can produce affirmative relief. When using automatic zoom, a subordinate of a
goal-directed zoom as described by Woodruff et al. [86], a constant zoom action is omitted
and thus the user can focus on the primary task. Furthermore, unlimited zoom can lead
to the “Desert Fog” effect introduced by Jul and Furnas [36], where absent landmarks
hinder a user to zoom back to a previous level or even lead to an unusable application
7
http://www.seadragon.com/
http://www.cs.umd.edu/hcil/jazz/
9
http://www.piccolo2d.org/
10
http://www.cs.umd.edu/hcil/
8
4.4. DETAILS ON DEMAND
53
state. Consequently, a user is concerned with the recovery of an applicable zoom extent
by zooming back and forth; this increases his cognitive load to a cumbersome capacity
and constrain task management. Also, automatic zoom can outright prevent the desert fog.
The zoom functionality in Squidy is based on automatic zoom. When a user double-clicks
on a node, pipe or pipeline the application zooms into the object automatically and to
such an extent that its content is represented optimally to the user. In spite of the solved
problems when using automatic zoom the range of elevations needs to be predefined by
the application developer and in some cases may not match a user’s cognitive preference.
For example, a character displayed on a 72 dpi screen with a height of 0.1 inch and at a
distance of 30 inch, one user may perceive the character while another may not perceive it
clearly. Further visualization techniques are required to eliminate ambiguous recognition.
4.4.3
Semantic Zooming
In zoomable user interfaces information is mostly represented by objects such as a tenyear calendar. Users can magnify the content of the calendar object by zooming further
and thereby can read specific calendar days and their contents. Nevertheless, when just
zooming the calendar, it is very difficult for a user to zoom directly to a specific day.
The reason is that at a full extent, years or even months are unreadable due to the small
resolution available to display the calendar as a whole. Thus, a user will not be able to
observe any landmarks useful for navigation. However, if the visual output of the calendar changes during different magnification factors such landmarks are given respectively.
The Figure 4.13 illustrates two independent zoom levels of such a calendar object. At an
overview level the name of the object and the years are visible as months or days cannot
be displayed adequately. If a user zooms further to a location and the available graphic
space grows accordingly, more information is revealed automatically (e.g. months). This
concept of zooming is known as “semantic zooming” and has been introduced by Perlin
and Fox [63].
In Squidy, semantic zooming is used to reduce visual complexity of nodes, pipes and
pipelines if the available graphics space is undersized to show all information at once
(see Section 3.1.4 – Manageable complexity). In a first version of the design environment
(see Figure 4.14) semantic zooming was already integrated. Here, (a) when a node is to
small the user wants to see the type and name of a node prior to a node’s properties
that are beyond that unreadable. However, (b) the user can access more information on
demand by zooming into the node and hereupon reveals node properties.
As illustrated in Figure 4.15 the semantic representation of a node is dependent on its
elevation. The more the user zooms towards the node the lower the elevation gets and the
more detail of that node is revealed. Thus, object manipulation is hidden at a glance but
provided to the user on demand.
In Figure 4.16 a complete zoom path is provided. Beginning from the top, the user selects
a distinct pipeline by double-clicking on it whereas the content of the pipeline is shown
by a semantic transition. Furthermore, the user likes to see the current dataflow and
54
CHAPTER 4. SQUIDY – A ZOOMABLE DESIGN ENVIRONMENT
Figure 4.13: The calendar in the Pad application introduced by Perlin and Fox uses semantic
zooming and the more the user zooms towards a specific geometric point, the more
details of the calendar is revealed. The calendar consists of three distinct zoom
levels: (a) the calendar overview provides a range of ten years in the first zoom
level, (b) the second zoom level reveals months when zooming towards specific
years, (c) the lowermost zoom level gives access to distinct days of a month.
(a)
(b)
Figure 4.14: Screenshots of an early version of the Squidy interaction library already supporting
semantic zooming. (a) a pipeline constituting a laser pointer interaction technique,
(b) a properties view of a node, e.g. laser pointer
thus double-clicks on a pipe between two nodes. Once again, performed by a semantic
transition, the dataflow is visually highlighted. Double-clicking on an area outside of the
current zoomed node zooms back to the next higher elevation. Therefore, the user is able
to switch between different granularities of information seamlessly, which consequently
preserves contextual information of nearby nodes.
In the focus group, the participants rated the usage of the concept of semantic zooming
as intuitive and conversant. Nevertheless, heavy zooming operations originating from a
user adjusting some node properties and requiring insight into the dataflow simultaneously
was perceived as annoying. A multi-focal view allowing both parallel views and multi-user
interaction [70]. A simple multi-focus view is offered by splitting the window into two
4.4. DETAILS ON DEMAND
55
Figure 4.15: The two semantic representations of a node illustrated by transition.
independent navigation spaces or as Elmqvist et al. puts it
Split-screen is perhaps the most common and most straightforward approach
to multi-focus tasks. [23]
Therefore, a mechanism to split screen or more precisely to provide additional windows
onto the navigation space is provided rudimentarily (see Figure 4.17). If a user doubleclicks with the right mouse button an additional window showing the same pipeline opens.
The arrangement of the windows incumbents on operating systems window management
and a user’s preferences thereon
Here, the first view is providing an overview of the pipeline, the second view shows properties of the Powerpointer node, and the third view gives an insight into the interaction
dataflow (see Section 4.6.1).
4.4.4
Interactive Configuration
While developing interaction techniques the interaction designer has to tweak the technique
marginally. This is a highly iterative task, e.g. customizing a laser pointer interaction to
an end-user’s needs. When using other interaction design toolkits such as ICON [21] and
OpenInterface SKEMMI [45] each time a property needs to be adjusted the interaction
designer has to stop interaction, make the necessary changes, recompile and restart interaction. This is a time consuming task and prevents the highly iterative testing, which
can lead to an imperfect interaction technique. Squidy in contrast, does not require such
interruption whereas the interaction designer can seamlessly adjust properties while the
end-user employs an interaction technique (see Section 3.1.9 – Direct manipulation). Also
the properties of a filter are not accessible by opening an extra window but rather zooming
into the filter reveals the properties (see Figure 4.18).
56
CHAPTER 4. SQUIDY – A ZOOMABLE DESIGN ENVIRONMENT
Figure 4.16: An entire zoom path that can be followed by the Squidy design environment. On
top a graphical representation of a pipeline is shown, by double-clicking a pipeline
node, it zooms semantically into the pipeline detail view (middle) and a further
semantic zoom reveals a dataflow visualization.
4.4. DETAILS ON DEMAND
57
Figure 4.17: Three independent windows having different views on the same pipeline for laser
pointer interaction. It allows adjustments on a node’s properties, views the status
of a pipeline, and gains access to the interaction dataflow simultaneously.
58
CHAPTER 4. SQUIDY – A ZOOMABLE DESIGN ENVIRONMENT
Figure 4.18: The properties view allows an interaction designer to adjust filter properties.
The properties are viewed within a table component. This component illustrates the
names of the properties in the left column and the interactive property control in the right
column. A property control can either be a standard GUI control such as a text field,
check box, drop-down list, slider or a nonstandard component such as a gauge control or
a file chooser. An essential feature of these controls is to constrain user input to avoid
faulty insertions, e.g. a slider control has a minimum and maximum value. This obviates
negative value input and thus prevent malfunction of an interaction technique. Nevertheless, to get a more detailed information about a property’s boundaries or the functionality
of a node a user can reveal such information by zooming into the information view.
Node Information
A node is a processing unit and a “white box” to the developer. Nevertheless, these nodes
can be reused in different contexts, e.g. a 2d intersection filter applies to marker-based
free hand tracking as well as 3d multi-touch input. Although a filter is not developed by
a user he might want to use it and improve an existing interaction technique. Therefore,
he needs to know configuration details of such a “black-box” node. An information about
a node is retrieved either by zooming into the information region in a nodes properties
view (top left see Figure 4.18) or by zooming into a node in the knowledge base. Here, the
node information is instantly accessible at the level of the properties view Figure 4.19.
Such a node information can illustrate the usage of the node making use of multimedia
4.4. DETAILS ON DEMAND
59
Figure 4.19: The information view of a node providing additional information about functionality, pitfalls, or application.
60
CHAPTER 4. SQUIDY – A ZOOMABLE DESIGN ENVIRONMENT
enriched manuals, e.g. illustrations, videos, or simply writing HTML content. Additionally, such supplemental information can be demanded on each single node property by
zooming into the information icon visible on the left side of a property.
Although semantic zooming is used to reveal details on demand, it will lead to frequent
zoom operations when handling large properties tables that exceeds the available display
space. A concept needs to be found that does not interfere with the concept of semantic
zooming and does not constrain the user with frequent zooming operations.
4.4.5
Semantic Scrolling
The speed-dependent automatic zooming concept by Takeo Igarashi and Ken Hinckley [31]
aims to browse in large documents while the perception of its contents is possible to a user.
It responds to the speed of a user’s scroll interaction and the faster a user scrolls the more
information is revealed by automatically zooming out of the document (see Figure 4.20).
Nevertheless, it requires scrolling to perceive all contents of a document at a glance.
(a)
(b)
Figure 4.20: Screenshots of an application using speed-dependent automatic zooming according
to Takeo Igarashi and Ken Hinkley [31]. (a) The zoom level of a document is
adjusted to the scroll speed of a user. (b) The faster the user scrolls the more
information of the document gets revealed by automatically zooming out of the
document.
A different approach introduced by Mackinlay et al. [51] uses a perspective wall where
the center of a screen displays distinct content and gradient walls display corresponding
context information. Also scrolling is needed to perceive all information at a glance.
The Alphaslider developed by Christopher Ahlberg and Ben Shneiderman [2] augments a
standard slider widget with distinct alphanumeric information (see Figure 4.21). Thus, a
61
4.4. DETAILS ON DEMAND
user can jump directly to a specific section of the document, e.g. if a user searches for a
film then he maneuvers the slider control to the specific alphabetic character if the title is
known
Figure 4.21: An Alphaslider firstly introduced by Christopher Ahlberg and Ben Shneiderman [2].
The Alphaslider concepts can be found in modern devices such as the Apple iPhone when
searching a person in the Contacts app.
Google amplifies the scroll bar of the Chrome browser with annotations when the user
searches for a specific word in a large document (see Figure 4.22 (a)). If the searched word
has been found, the scrollbar gets an annotation at the corresponding document location
(see Figure 4.22 (b)).
(a)
(b)
Figure 4.22: The search facility of Google’s browser Chrome. It amplifies the scrollbar with
annotation when a user searches for a specific word in a document. The location
of the found word in the document corresponds to the location of the highlighted
scrollbar.
When using an Alphaslider to search for a movie he will need to browse all items sequentially when only the year of its release is known Therefore, the concept of semantic scrolling
expands the concepts of the Alphaslider and speed-dependent automatic zooming. A user
is provided with a detailed view to a specific properties table section as well as a semantic
scroller on the right viewing all properties in an overview. The user can select a specific
section by moving the gray highlighted slider to the corresponding section in the semantic
scroller. In addition, the user can either scroll the table or the semantic scroller by using
62
CHAPTER 4. SQUIDY – A ZOOMABLE DESIGN ENVIRONMENT
the scroll wheel on a standard computer mouse. With the concepts of semantic scrolling
the user does not need to browse all properties sequentially because he is provided with
all contents visually and thus can recall a visual appearance.
In the conducted focus group the participants acknowledge the feasibility of semantic
scrolling but criticized the absence of scroll-wheel interaction, which has been implemented
in current versions. Furthermore, the previously mentioned node base that provides input
devices, output devices, and filters is described in detail in the following sections.
4.5
Node Repository
A further concept of the Squidy interaction library is the “black-boxed” node implementations in which a device driver or filter technique needs to be integrated once and thus
is reusable for different interaction techniques (see Section 3.1.3 – Reuse of components).
These “black-boxes” are available after the developer has published the node to the node
repository. Therefore, a developer needs to click the publish button in the navigation bar
(see Figure 4.11).
Subsequently, new nodes are visually accessible by the node repository located at the bottom of each pipeline view (see Figure 4.9). Here, at a glance eight nodes are presented to
the interaction designer (see Section 3.1.2 – Ready-to-use components). The order and the
type of nodes presented is based on a heuristic model, which will be updated each time
a user drags and drops a node on a pipeline. Furthermore, the arrangement of nodes is
measured by a statistical value that indicates probabilistically whether it makes sense to
use a node for a current pipeline or not (see Section 3.1.5 – Component suggestion). For
example, a filter that computes an intersection with a 2d planar surface is only needed
in a vector space bigger than two dimensions. Nevertheless, all nodes are accessible by
semantically zooming farther into the node repository (see Figure 4.23).
The heuristic based concepts were not understood by the participants of the focus group
whereas they argued that the prompt and inscrutable changes of the node repository are
confusing. Here, a smooth animation could help the user to comprehend changes on the
node repository.
A subject for developers is the stability of filters that is a seamless process from alpha
status via beta status to release candidate. Therefore, developers can programmatically
set a stability flag that indicates a node’s development status. As a consequence, nodes in
an unstable condition are rendered with a light gray border and stable filters are rendered
with black color (see Figure 4.23, e.g. Flip Vertical 2D is stable and Inertia Cube is unstable). Thus, detecting the stability of a filter is not a burden to the interaction designer.
The feasibility to filter a current dataflow needs to be integrated into the design environment, too, and should apply furthermore to the concepts of semantic zooming, which will
be described in the next section.
4.5. NODE REPOSITORY
63
Figure 4.23: The node repository of the Squidy interaction library offers node implementations
(e.g. integrated device drivers and filter techniques) as “black-boxes” to interaction
designers.
64
4.5.1
CHAPTER 4. SQUIDY – A ZOOMABLE DESIGN ENVIRONMENT
Data Filter
In contrast to other visual interaction input toolkits [11, 21, 71, 45] the pipe is augmented
by further visual components such as data filters and a dataflow visualization. Indeed
in related applications a dataflow can be filtered programmatically however such filters
cannot be applied visually to a current dataflow.
The feasibility to restrict particular data types can have advances in the development of
interaction techniques especially, e.g. the ad-hoc decision whether buttons on a mouse
should get ignored and keys on a keyboard will be used instead. Due to this fact, decision
making could be a highly iterative task to achieve. Therefore, Squidy provides such data
filtering by a visual data filter component (see Figure 4.24 and see Figure 4.25). As can
be seen in Figure 4.24 the dataflow of a pipe can be filtered twice: first before the data
flows through the data visualization and second before the data will be sent to an adjacent
node.
Figure 4.24: The pipe as it is implemented in Squidy. Each pipe has two data filters and a
dataflow visualization on top.
A filter is accessible by double-clicking on it, which reveals the data filter (see Figure 4.25).
Then, a user can reduce dataflow when selecting or deselecting particular data types. Selected data types have a colored background whereas deselected data types have no background color. A selection or deselection is made by a single-click on the data type within
the hierarchy. To select or deselect all data types at once, the user needs to click on the
topmost data type (gray data type). In the zoomed out state of the data type filter the
arrows indicate the dataflow direction additionally.
The concepts of data filtering were neither implemented at the time the focus group
was conducted nor mentioned during discussion. Nevertheless, these concepts needed
evaluation, which will be discussed later. In order to offer error detection and furthermore
support the development of reliable interaction techniques, a debugging facility is required.
4.6
Visual Debugging
A debugging facility plays an important role for the development of reliable software. In
today’s common integrated development environments such as Eclipse IDE for Java, a
debugger is integrated as well. There, a developer can pause application execution by
setting breakpoints in the source code. The debugger pauses the application when a
breakpoint is reached and the developer can get insight into the values of local and global
variables. On the basis of this information, a developer can improve the reliability of
that application by being responsive to error-prone executive code. Similar to debugging
65
4.6. VISUAL DEBUGGING
(a)
(b)
Figure 4.25: The data type filter aims to reduce dataflow by selection or deselection of particular
data types: (a) all data types are selected and flow through the pipe, (b) the data
types data position 2d and data button are selected whereas all other types are
filtered out automatically.
in object-oriented programming or procedural programming, an interaction designer also
needs insight into a current interaction dataflow to be responsive to error-prone user
interaction and thus develop reliable interaction techniques.
4.6.1
Dataflow Debugging
With current toolkits and frameworks, an interaction designer constructs interaction techniques either textually or visually but he is not supported by debugging facades during
development. For instance, to recognize interaction patterns like gestures or multimodal
input such as Bolt’s “put-that-there” [9], interaction designers require a brief overview
of the chronological flow of data within a predefined time span by reason of the spoken
command is in some way delayed compared to human motor skills. By using the concept
of semantic zooming, the user is able to navigate to a visual layer that provides a top view
on the flow of the interaction data (see Figure 4.24). This layer is directly located at each
pipe, indicating a connection between two nodes. The duration of a specific interaction
depends on the length of its pattern. Therefore, the time-based view can be manipulated
directly by the user and provide insight into the currently flowing data [30]. The types
of interaction data vary in their dimensions of atomic values so the visual plot of data
types also vary in their visual representation. This means that for instance the representation of a position in 2D differs from the representation of a gesture being recognized
(see Figure 4.26 (b)). Users are able to inspect frequent and parallel occurring data at
a glance according to its spatial and chronological location. Thus, interaction designers
benefit from the insight into the interaction data flow and are able to apply changes directly. These changes instantly affect the behavior of the interaction design, providing
the possibility to gradually refine and test the configuration at run-time (e.g. changing
noise level of a Kalman filter to compensate users’ natural hand tremor) and allow the
designer to achieve more natural and reliable interaction techniques [67]. An interaction
designer can choose between a scatter plot visualization and a thermo plot visualization.
The scatter plot visualizes one-dimensional and two-dimensional data flowing from right
to left according to a data objects temporal occurrence. Furthermore, one-dimensional
66
CHAPTER 4. SQUIDY – A ZOOMABLE DESIGN ENVIRONMENT
data occupy the complete y-axis and normalized two-dimensional is set on the y-axis to
its according value. The thermo plot visualizes two-dimensional data according to its spatial occurrence and the data point’s alpha value reflects the temporal feature (the more
opacity the data point has the more present the data object).
(a)
(b)
Figure 4.26: The dataflow visualization gives insights into a current dataflow: (a) the scatter plot
visualizes temporal and spatial one-dimensional and two-dimensional data types
flowing from right to left and (b) the thermo plot visualizes spatially and twodimensional data whereas the temporal factor is mapped to the data points alpha
value.
This visual debugging of the dataflow was not implemented at the time the focus group
was conducted but as a result the concept of visual dataflow debugging was demanded by
participants during the discussion.
Since resources are allocated by each node implementation the interaction designer needs
to get feedback if a resource allocation did fail (e.g. allocating a server on port 8989).
Otherwise the user wonders about the erroneous interaction and needs to search for the
reasons manually.
4.6.2
Status Report
It is difficult for an interaction designer to identify whether a node is processing as intended
or a failure blocks or even stops processing. Therefore, a node needs to notify a user about
the different processing states of node, pipe, or pipeline. In addition, this notification needs
to be easily visible but as unobtrusive as possible to the user to not overwhelm him while
troubleshooting.
Since the interaction dataflow can be compared to big-city traffic whereas the traffic light
metaphor has been adopted to visually emphasize different status of a node. Also similar
to traffic lights a green color indicates correct data processing (walk) and red indicates an
erroneous processing (stop). Additionally the gray color indicates not processing. Color
codes are applied to both nodes as well as pipes (see Figure 4.17) whereas a node’s outgoing
pipes are highlighted in the same color to increase potential error detection.
This further assistance in the development and the facility of debugging can help the
4.7. ON-THE-FLY COMPILATION AND INTEGRATION
67
interaction designer to develop reliable and thus less frustrating interaction techniques. If
for some reason a node as “black-box” does not work as intended and needs bug-fixing,
an advanced interaction designer or developer does not need to change to a different IDE
but rather corrects the error directly by zooming further into the erroneous node within
the design environment.
4.7
On-the-fly compilation and integration
When an interaction designer has at least a little bit of programming experience, he can
augment a current interaction technique programmatically. Therefore, in standard settings
he needs a development environment such as Eclipse IDE11 or Microsoft Visual Studio12
to make changes to the code and recompile the filter technique. If the IDE does not support hot deployment the application needs to be stopped before changes to the code are
allowed. Thereafter, the application can be restarted again. If iterative changes are made
by the interaction designer this process can be very time consuming and the principle of
cause and effect is violated.
Figure 4.27: The source code of a node implementation is accessible directly in the design environment.
Squidy in contrast does provide a further zoom elevation to view the source code of a filter
implementation within the design environment. There, an interaction designer can apply
11
12
http://www.eclipse.org/
http://www.microsoft.com/visualstudio/en-us/
68
CHAPTER 4. SQUIDY – A ZOOMABLE DESIGN ENVIRONMENT
changes to the source code (see Section 3.1.8 – Embedded source code). After he zooms
back to a higher elevation the changed source code is compiled and thereafter integrated
automatically (see Figure 4.27). Such frequent changes within the source code view are
immediately applied to the interaction techniques, similar to the property adjustments of
a filter.
4.8
Visual Clutter Prevention
Although the design environment is based on the concepts of semantic zooming and goaldirected zoom, the available graphics space is restricted to the display resolution. Thus,
a user may group objects on stacks whereas occlusion occurs. Furthermore, if such an
occlusion is unwanted or a specific object is searched by a user, he has to browse the
stacks for it. In Squidy, such an occlusion can occur if a user drops to many nodes on a
pipeline and thus produces visual clutter.
Since handling large data is an aging problem in file management an alternative solution
to the occlusion issue can be forming hierarchies. Here, data will be portioned into several
smaller chunks accessible through a tree structure (see Figure 4.28).
Figure 4.28: The Finder application of the Apple Mac OS X is giving access to the hierarchical
filesystem.
A user of an operating system can group and order a huge amount of files into semantic
groups, e.g. putting all images in an image folder and all text documents in a documents
folder. This hierarchy can be separated into smaller chunks such as ordering the image
into format or resolution. A different approach than group by file type can be grouping
files by task such as writing a thesis, e.g. containing all files and subfolders necessary to
write this thesis.
This tree structure minimizes complex tasks into smaller partial problems. A similar
approach to the hierarchical tree structure are hierarchical pipelines that can help to reduce
69
4.8. VISUAL CLUTTER PREVENTION
visual clutter. Regarding Figure 4.29 two different approaches are compared. (a) On the
left: a single pipeline containing 16 nodes relevant for multi-touch and token interaction,
which lead to a visual clutter. Adding further nodes to this pipeline potentially increases
the likelihood of occlusion.
(a)
(b)
Figure 4.29: The concept of semantic zooming is farther adaptable to implement hierarchical pipelines: (a) a visually cluttered multi-touch and fiducial marker recognition pipeline, (b) the same pipeline but resolved visual clutters using hierarchical
pipelines.
Therefore, hierarchical pipelines have been introduced to group nodes belonging together
into sub-pipelines (see Figure 4.29 (b)). In Squidy the user does not have to define input and output ports manually, which is different to the patches and sub-patches of the
multipurpose toolkit vvvv13 . A user simply drags and drops a new sub-pipeline from the
node base onto a current pipeline. By zooming into the sub-pipeline, the user can either
create smaller portions of a complex interaction technique or create further sub-pipelines.
In order to route the dataflow into sub-pipelines and thus into the smaller chunks of the
interaction technique, a consistent concept to the standard dataflow routing has been
chosen.
On the inside of a zoomed pipeline two ports are visible to receive outer dataflow and
publish inner dataflow to outer dataflow (on the left and on the right). In Figure 4.30
the pipeline on the left minimizes complexity using two sub-pipelines that can be seen on
the right of the figure. The sub-pipeline on the top of Figure 4.30 complements a laser
pointer as input device and a Kalman filter to reduce human hand tremor to increase
pointing accuracy. The dataflow resulting from the laser pointer interaction is routed to
sub-pipelines output port and then to the Powerpointer node of the parental pipeline.
The data processed by the Powerpointer node is then routed to the input port of the
second sub-pipeline. The incoming data is sent to both the mouse output as well as the
keyboard output. This hierarchical pipeline shows the feasibility of reducing complexity
by dividing complex tasks into chunks of smaller sub-tasks. It furthermore concludes
current implemented concepts of the Squidy interaction library and serves as groundwork
13
vvvv - a multipurpose toolkit – http://vvvv.org/
70
CHAPTER 4. SQUIDY – A ZOOMABLE DESIGN ENVIRONMENT
Figure 4.30: Illustrating the concepts of hierarchical pipelines.
to further research either in enhancing the existing user interface or in developing novel
interaction techniques post–mouse and –keyboard interaction.
4.9
Software Engineering Aspects and Metrics
During the conception and development phases of the processing engine (Squidy Core)
of the interaction library, a lot of effort has been put in providing a simple programming
interface to the interaction developer. Some aspects of the development will be described
in the following sections. A more detailed description of the Squidy Core, the processing
API, and user interface API is provided by Werner A. König et al. [44] as well as the
author of this thesis [66].
4.9.1
Filter and Device Integration
In order to integrate novel input devices or sophisticated filter techniques into the interaction library Squidy developers already have a cognitive strain when handling with complex
device drivers and filter algorithms. Therefore, Squidy minimizes the overhead needed to
introduce a new node. Developers simply extend the abstract class AbstractNode and
augment the implementation with pre-defined processing methods (see Listing 4.2).
Listing 4.2: An example skeleton of a node implementation. It illustrates the minimum definition
to be accessible through the node repository.
@XmlType ( name = " Powerpointer " )
@Processor (
name = " Powerpointer " ,
icon = " / images / powerpointer . png " ,
4.9. SOFTWARE ENGINEERING ASPECTS AND METRICS
71
description = " / html / Powerpointer . html " ,
types = { Processor . Type . FILTER } ,
tags = { " laser " , " pointer " , " powerpoint " ,
" presenter " }
)
public
//
//
//
}
class Powerpointer extends AbstractNode {
filter specific implementation based on
data processing introduced in the next
section
Functionality such as data queuing, thread instantiation, parallel processing, and resource
allocation is provided transparently by that abstract class without developer’s assistance.
Furthermore, if a user drops a compiled node in the application classpath it will be added
to the interaction library automatically (see Section 3.1.7 – Expandability / extensibility). This modular layout allows well suited Squidy runtimes as only needed filters are
deployed with the runtime environment, e.g. for artistic installations. The base programming language of the Squidy Core is Java that provides a platform-independent runtime
(see Section 3.1.6 – Multi-platform support).
4.9.2
Processing
Distinct interaction techniques can be implemented by the developer as the dataflow can
be intercepted when overriding and implementing individual processing methods (see Section 3.1.1). These processing methods are subject to a preset sequence (see Figure 4.31).
In the “preProcess” stub (see Listing 4.9.2), the collections of data types grouped within
a data container are passed to the method’s implementation. This is an easy way to
access all data at a glance or iterate through the data collection manually, e.g. to search
for interaction patterns consisting of a diverse set of data types concerning multimodal
interaction (see Section 3.1.11 – Multimodal interaction).
/* *
* Diverse collection of data accessible by this
* method stub before each data object is routed
* to individual data type processing .
*/
public IDataContainer
preProcess ( IDataContainer dataContainer );
Whenever it is sufficient to process one particular data instance at a time, the “process”
method stub is appropriate. The following code fragment is a generic representation of
such a process method stub. In the case of the “process” stub (see Listing 4.9.2), the
Squidy Core iterates through the collection automatically and, therefore, it does not have
to be done programmatically as in the “preProcess” stub. Here, DATA TYPE is the
placeholder for a generic data type (see Section 4.3.1), offering a simple data-type filter
for the dataflow. The Squidy Core only passes instances of that generic type (one at a
time) to that method implementation.
72
CHAPTER 4. SQUIDY – A ZOOMABLE DESIGN ENVIRONMENT
Figure 4.31: An flow chart diagram illustrating the processing chain of each node.
4.9. SOFTWARE ENGINEERING ASPECTS AND METRICS
73
/* *
* Processes data of particular generic data type
* ( DATA_TYPE is a placeholder for those generic
* data types ).
*/
public IData process ( DATA_TYPE data );
Before the data collection is published to the next filter of the processing chain or bridged
back to any device or application, the data collection can be accessed through the “postProcess” stub (see Listing 4.9.2). For instance, the “postProcess” method is applicable
to remove redundant data from the dataflow (e.g. perform an action only once) and to
reduce data-processing overhead (see CARE properties [12]).
/* *
* Diverse collection of data accessible by this
* method stub after each data object has been
* routed to individual data type processing .
*/
public IDataContainer
postProcess ( IDataContainer dataContainer );
The Squidy Core uses the Java Reflection mechanism to determine if a filter has implemented such a data interception and passes inquired data to the implementation automatically. Therefore, no additional effort is required for interface declaration, generation
and compilation as is needed for the CIDL used by OIDE [13] or SKEMMI [14,15]. This
flexibility of the Squidy Core aims for a rapid integration or modification of filter techniques and provides the capability often needed for rapid and iterative prototyping of
interactive and natural user interfaces. Heterogeneous devices and toolkits can be easily
tied to the Squidy Interaction Library using existing Squidy Bridges [66] (OSC Bridge,
Native Interface Bridge) or custom bridge implementations (e.g. to integrate devices or
toolkits communicating via special protocols). The Squidy Core provides a multi-threaded
environment to perform concurrent data processing and thus increases data throughput,
minimizes lag and enhances user’s experience while using customized interaction.
Scott MacKenzie and Colin Ware already determined that delayed system response following human interaction has an impact on a human’s performance. The delay between input
action and output response has been measured in tests using the Fitts’ law paradigm14 .
They identified an easy measurable degradation of human performance at 75 ms of delay.
Increasing the lag to 225 ms led to a substantially degradation of human’s performance
and thus lead to an unusable system [50]. When taking the 75 ms as an upper limit then
at least a minimum of fourteen fps15 are needed for data throughput. A benchmark of
the interaction library has been performed on several architectures that are available on
14
15
A paradigm to test capacity of the human motor system.
Frames per second indicating the value of frame rates in interactive systems.
74
CHAPTER 4. SQUIDY – A ZOOMABLE DESIGN ENVIRONMENT
today’s consumer market (see Figure 4.32). The benchmark measured the data throughput of a single pipeline by circulating a data object and incrementing a counter each time
the object reaches the first node. Every second the counter is read out and reset to zero
afterwards. Thus the measured value counts fps. Each architecture passed 98 cycles of 40
seconds each, starting from 3 nodes up to 100 nodes. A single test lasted about 65 minutes on each architecture. Furthermore, the median was taken to avoid extreme outliers.
Indeed, the diagram contains several outliers that arise from the unbalanced threading
strategy of the JVM16 [28].
!"""""#
!"#$%&'(%"')%*+,-'./(&0'
!""""#
,-./001#230#4#,-.#56#7#!"8(#
,-./001#230#4#9:;<0=>#)#
?2#4#9:;<0=>#@:>A-#
B(#CDE:-;#F:;GB#
H-IJ-;#4#,-./001#230#4#,-.#56#7#!"8(#
!"""#
KDLG:3D<#,:;:JGJ#
!""#
$#
!$#
%$#
$$#
&$#
'$#
($#
)$#
*$#
+$#
1'2+-%&'.3'4'5660'
Figure 4.32: A benchmark of the Squidy interaction library testing dataflow throughput in fps.
It has been performed from 3 to 100 nodes and takes 40 seconds for each cycle to
measure the median fps.
In addition, the diagram illustrates an increased lower boundary of 120 fps (red line) that
is reached at a pipeline of 99 adjacent Kalman filters. At the moment the Kalman filter
is the most resource consuming filter and in fact is highlighting the feasibility of Squidy’s
dataflow paradigm on von Neumann architectures since because most pipelines contain
much less than 99 nodes.
The loc17 statistic complements the performance benchmark of the interaction library
Squidy. These loc metrics have been erected with the open source tool CLOC – Count
Lines of Code Tool18 and a Squidy version as of August 23th 2010 at 2:34pm. Hence,
16
Java Virtual Machine
The acronym loc stands for “lines of code”
18
http://cloc.sourceforge.net/
17
75
4.9. SOFTWARE ENGINEERING ASPECTS AND METRICS
the Squidy framework is modeled in a highly object-oriented manner preventing duplicate
code instructions and thus consists of more than 19295 loc. This code provides dataflow
and signal processing skeletons and furthermore facilitates a generic user interface facade.
Another 31969 loc integrate diverse input devices and output devices and implementing
several filter algorithms (e.g. iPhone, Kalman, AdaptivePointing, and Powerpointer). In
addition to the benchmark, the interaction library Squidy was rated among other related
frameworks and toolkits as the best applicable design environment for the realization of the
Curve project [87]. The Curve project is an interactive desk featuring a curved multi-touch
display or more precisely offers a seamless transition between the horizontal multi-touch
enabled desktop and the vertical multi-touch wall [85].
The interaction library Squidy is publicly available since September 2009 and can be
accessed at http://www.squidy-lib.de. Furthermore, the Figure 4.33 illustrates the downloads of the Squidy binaries since being open-source, which is approximately 20 downloads
per week and a total of 872 downloads (as of August 23rd 2010).
"!!!
*!!
)!!
(!!
!"#$%%"&'(
'!!
&!!
<391CAD
>EE@F@A81?4,
%!!
$!!
#!!
"!!
!
+,-.!*
/01.!*
234.!*
5,6.!*
789."!
:,;."!
<=6."!
>-=."!
<8?."!
7@9."!
7@A."!
>@B."!
)"$*+(
Figure 4.33: The download statistics of the Squidy interaction library since September 2009
arising from the statistical analysis of SourceForge.net.
It is published under the LGPLv319 and used in various scientific, artistic, and commercial
installations introduced in Chapter 5 – Use Cases.
19
GNU Lesser General Public License - Version 3 – http://www.gnu.org/licenses/lgpl.html
76
CHAPTER 4. SQUIDY – A ZOOMABLE DESIGN ENVIRONMENT
4.10
Formative Evaluation Study
The conducted formative study was intended to find out if Squidy is able to meet assumed requirements for a low threshold and a high ceiling [56]. The interaction library
is primarily designed to support interaction designers, which usually have lower technical
background than programmers (see 3.2.2 Interaction Designer, page 31). The study was
carried out in a 7 hour workshop starting at 10 a.m. and was limited to a single day. The
one-day-factor was owed due to the availability of external participants constituting the
role of an interaction designer. Altogether ten interaction designers were participating.
These participants were assigned to five teams whereas one team consisted of two participants. Moreover, a few minutes were given to the team members to become acquainted
because some of the participants did not know each other.
During the workshop, three data gathering types were applied: interviews, questionnaires,
and observations. As a consequence of observations, participants were instructed to communicate aloud, which was treated as “thinking aloud” and thus provided further valuable
feedback. Team members were allowed to cooperate among themselves as this reflects a
common proceeding in the domain of interaction design.
The tasks that were constructed were typical interaction design tasks for non-traditional
devices. They consisted of four main tasks, covering basic task types such as visual
design, interaction technique programming, domain transfer, and API knowledge. Each
task was divided into distinct subtasks, enabling a more precise instructive formulation
and reducing the overall complexity. The task difficulty was gradually increased, which
conduces to identify barriers or “walls” according to the definition of Myers et al [56].
“[...] where the user must stop and learn many new concepts and techniques
to make further progress.” [56]
The original evaluation documents are attached as Appendix A and can be found digitally
on the enclosed DVD.
Evaluation Tasks
The first task (T1) consisted of two subtasks and should provide a low threshold for
participants to get familiar with the design environment. It furthermore represents the
role of an interaction designer who has less programming experience and thus can solve
the tasks solely by visual dataflow programming. The goal was to determine how users
understand and accept the DFVPL based on the “pipe-and-filter” software engineering
pattern.
T1.1: Mouse coordinates originating from the participants’ local machine needed to be
sent to a remote machine.
T1.2: After T1.1 was solved, the behavior of the remote application was changed by flipping
the y-axis without prior informing the participants. Thereon, participants needed
to identify the problem and solve it by flipping coordinates accordingly.
4.10. FORMATIVE EVALUATION STUDY
77
The second task (T2) addressed previously gained knowledge in visual programming as
well as the more complex textual programming representing the role of a developer. Participants needed to implement filter techniques to control a Microsoft PowerPoint presentation running on their local machine. The presentation was provided by the conductors
to eliminate side-effects on task time. Since the source code view of the design environment does not yet offer helpful tools such as code completion, organizing imports, and
code formatting, participants were allowed to use the Eclipse IDE Java for programming.
In addition, Eclipse IDE Java also allows hot deployment and thus the time emanating
from environment switching was marginal, which means participants did not need to stop
and restart Squidy when performing minor changes on a filter’s source code.
T2.1: The participants were requested to control a Microsoft PowerPoint presentation using an Apple iPhone. Each group was provided with one iPhone device that had the
Squidy Client installed preliminarily. This Squidy Client sends occurring touches
and inertia over a wireless LAN connection to a running iPhone node within a
pipeline. Each touch data sent over the network was further augmented with additional information such as touch began, touch moved, or touch ended to allow users
an identification of short clicks or moving gestures. On the basis of these touches the
participants were asked to control the mouse cursor on their local machine remotely
as well as switching slides forth by tapping on the iPhone’s touch sensitive surface.
T2.2: The interaction technique of T2.1 needed to be enhanced by the opportunity to
annotate distinct slide. Here, participants were requested to switch to PowerPoint’s
drawing mode by tapping two fingers on the iPhone’s touch sensitive surface. While
the drawing mode is active, a user should be able to annotate slides by moving
a single finger on the surface. Again, another tap should switch it back to the
arrow mode. The participants were given an additional hint so they are able to use
keyboard shortcuts to switch between the two PowerPoint modes (“CTRL + A” and
“CTRL + P”).
T2.3: Participants were to implement a delete drawings functionality by shaking the iPhone.
Such a filter was provided by the node repository but not actively communicated to
the participants. Therefore, they either found the filter using the provided search
facility or they implemented it from the beginning.
The third task (T3) was included to see whether participants were able to transfer the work
previously done in T2 to a different input device also providing a touch sensitive surface.
Here the Apple iPhone was replaced with a Microsoft Surface. Although having the focus
on textual programming this task was induced to test previously gained knowledge and
to confirm or disprove learning effects.
T3.1: Participants were requested to transfer the pipeline originating from T2 to a Squidy
instance running on the Microsoft Surface. An additional mark indicated that single
finger taps to switch slides forth will be content of the next subtask.
T3.2: Since the Microsoft Surface does not send necessary information to detect tabs automatically, this functionality was requested by the team. They needed to implement
78
CHAPTER 4. SQUIDY – A ZOOMABLE DESIGN ENVIRONMENT
a filter that detects single finger tabs to switch slides forth and change between
drawing mode and arrow mode, similar to T2.1 and T2.2.
T3.3: As a consequence of the absence of an inertia sensor the participants were asked to
implement the deletion of drawings when placing a particular token on the surface.
The fourth task (T4) addressed the framework development and thus represented the role
of a framework developer. This task was predicted to be the most demanding task as
it requires advanced programming experience in Java and a good understanding of the
concepts of object-oriented programming. On the one hand, this task is usually neither
performed by interaction designers nor interaction developers and it represents the highest
threshold for users when working with the design environment. On the other hand if this
task could still be solved by the participants it will show the feasibility of a seamless and
increased learning when supporting users with concepts such as semantic zooming and
details on demand.
T4.1: Participants needed to augment the framework to offer the opportunity to start and
stop the multi-touch pipeline of T2 and T3 by pressing a physical hardware button.
T4.2: The teams were asked to synchronize the position of a physical slider with the “PixelClock” slider of the multi-touch node. (physical element is controlling the graphical
user interface element)
T4.3: The current frame rate of the multi-touch node should be textually visualized on the
display of a Phidgets TextLCD.
T4.4: Similar to T4.1 participants should integrate a light sensor controlling the processing
state of a pipeline and offer an automatic overnight shutdown. (start =
ˆ day / stop
=
night)
ˆ
T4.5: The participants should use a green and red led to visualize the current status of a
pipeline corresponding to the graphically provided status.
Because there was no time left all participants were given only 3 of the 5 subtasks. Here,
the most demanding subtasks T4.1, T4.3, and T4.5 were chosen to keep the walls as high
as possible.
Before the evaluation started all participants were introduced to the concepts of the design environment, which lasted about one hour. Here, the participants were shown the
different detail-on-demand views and given a brief introduction into the technical details
of Squidy’s internal processing. On the basis of a within-subjects design, all teams or more
precisely all participants needed to perform all tasks (not considering canceled tasks). The
participants were requested to rate the difficulty of each subtask on a five-point scale once
before they start the task and once after they (have)completed it. The two ratings enabled
to identify subjectively rated walls and whether Squidy copes with expectations or possesses discrepancies. Additionally, the participants needed to fill out questionnaires that
asked on a five-point scale for Squidy assistance (very good - very poor), the integrated
concepts of semantic zooming (very good – very poor) and general fun factor (very high
4.10. FORMATIVE EVALUATION STUDY
79
– very low). To receive quantitative data, the completion time of each subtask has been
noted. In consequence the dependent variables of this study were difficulty, assistance,
concept of semantic zooming, fun, and completion time.
For each task, one team was randomly selected to complete the task in a usability laboratory. There the participants were observed using Morae20 to measure click and zooming
operations which allows a qualitative analysis of semantic zooming concept. The remaining
four teams resided in an observation room large enough to carry out the task undisturbed.
In each room at least one expert was available to support participants on serious issues.
Additionally, each group was interviewed to be more responsive to possible “walls”.
4.10.1
Results
The results of each main task is presented in the following paragraphs. Unfortunately, the
data gathered with the Morae21 exposed as unusable as the output files are corrupted.
Task T1
The task T1 was completed in an average time of 19.6 minutes (SD 12.26 minutes). Obviously the data evaluation revealed an outlier of 41 minutes, which can be explained not
switching on the filter required for the subtask T1.2 by mistake whereas this group tried
27 minutes to identify a not existing problem. This shortcoming has been eliminated by
the test monitor directly after it has been detected and this group quickly finished T2.2
(a total of 29 minutes for T2.2). The subjective ratings of the participants showed that
the main task T1 is well aided by Squidy whereas the support tends to result in very
good with an average of 4.67 (SD 0.5), also the concept of semantic zooming was rated
positively with an average of 4.33 (SD 0.866), and the fun factor with an average of 4.0
(SD 0.707). Overall, the results of T1 showed that all participants cope with the concept
of the dataflow visual programming language.
Task T2
The results of T2 revealed the first “wall” as the user ratings were significantly lower than
in the previous tasks, which drops the support of Squidy to 3.4 on average (SD 1.578) ,
concept of semantic zooming to 3.4 on average (SD 0.966), and fun factor drastically to
2.9 on average (SD 1.370) (see Figure 4.34 and Figure 4.35). Since this main task includes
dataflow programming, which justifies the observed large drop in task completion time to
a mean of 149.2 minutes. Nevertheless, this task led to the lowest fun rating and participants noted the difficulty higher in the post-rating than in the pre-rating. Although
this states a negative measure, it can be interpreted like visual programming in T1 got a
higher fun rating and thus led to lower reported user frustrations.
Nevertheless, both the concept of dataflow programming as well as the “pipe-and-filter”
software engineering pattern have been understood by the participants at the end of the
20
21
An observer tool developed by TechSmith – http://www.microway.com.au/catalog/techsmith/morae.stm
Morae
is
a
usability
testing
software
to
understand
customers
experience
–
http://www.techsmith.com/morae.asp
80
CHAPTER 4. SQUIDY – A ZOOMABLE DESIGN ENVIRONMENT
Figure 4.34: The mean ratings for the support of Squidy, concept of semantic zooming, and fun
factor over all four conducted tasks.
task T2, which can be measured in T3 where task completion time decreased although
programming was required. This positive effect emphasizes the expected permanent learning aspect when gradually increasing “walls” and shows that previously gained knowledge
can be applied to different interaction techniques.
Task T3
Despite the lasting dataflow programming, the task T3 showed decreasing task completion
times (mean of 31.2 minutes), which arise from previously gained knowledge of dataflow
programming in task T2. Thus, the identified wall of T2 shrunk with the increasing
experience of the participants and usage of the design environment. Additionally, the
support of Squidy was rated to 4.2 on average (SD 1.033), the concept of semantic zooming
to 3.8 on average (SD 0.789), and the fun factor increased to 4.1 (SD 0.568) compared to
T2.
Task T4
The most demanding task T4 had a task completion time of 61.6 minutes on average
and still a fun rating of 3.88 (SD 1.126). Also the support of Squidy was rated with 4.0
on average (SD 0.535), which was constantly higher than the five-point scale average of 3.0.
The overall results of the evaluation study showed that the participants understood the
concepts of the dataflow visual programming language and the “pipe-and-filter” software
4.10. FORMATIVE EVALUATION STUDY
81
Figure 4.35: The mean difficulty of the subtasks rated by the participants of the evaluation. In
order of the linearity of the analysis the tasks T4.1, T4.2, and T4.3 correspond to
the tasks T4.1, T4.3 and T4.5.
engineering pattern. Nevertheless, users decreasingly rated the zooming concepts of Squidy
with progress of the evaluation study. In fact, users had to zoom between filter properties,
pipelines, and filters’ source code very often and thus frequent zoom operations had a
negative impact on the usability and furthermore increased user frustration.
The requirement to view the dataflow, properties of filters and pipelines in parallel was
already mentioned in the conducted focus group but was rejected for the workshop. This
feature (multi-focal view) was unstable at that time. Nevertheless, the comments of four
participants (ID1, ID2, ID7, and ID8) showed the necessity of a multi-focal viewing facility,
which needs further improvements for future evaluations.
In conclusion, the results of the formative evaluation study showed that the design environment Squidy can support interaction designers in the design of interaction techniques.
Although, some tasks needed programming experience all tasks could be completed by
the participants. Furthermore, the results gained from questionnaires and interviews provided a valuable feedback and will be taken in consideration for further improvements of
the interaction library introduced in Chapter 6
82
CHAPTER 4. SQUIDY – A ZOOMABLE DESIGN ENVIRONMENT
Chapter 5
Use Cases
Contents
5.1
5.2
5.3
Presenter Tool . . . . . . . . . . . . . . . . . . . . . . . . . . . . . 83
Augmenting Everyday Objects . . . . . . . . . . . . . . . . . . . 93
Artistic and Exhibit Installations . . . . . . . . . . . . . . . . . . 96
“I hear and I forget. I see and I remember. I do and I understand.”
— Confucius
In this chapter elected projects are depicted that show the capabilities of the interaction
library Squidy. The domains are very heterogenous and evolve from an academic background, artistic and exhibit installations, and a personal feasibility study to show future
directions.
5.1
Presenter Tool
This interaction technique introduces a laser pointer interaction to control a Microsoft
PowerPoint presentation. As Microsoft PowerPoint evolves from standard WIMP paradigm
and is furthermore laid out for mouse and keyboard interaction, it can already be adapted
to laser pointer interaction that controls a mouse pointer. Although presenter tools such
as the Speed-Link SL-6199 Presenter Professional (see Figure 5.1) can already control
PowerPoint presentations, they are limited in their possibilities.
Such a device can switch slides back and forth and farther highlight aspects on a slide
temporarily using the integrated laser pointer. Nevertheless, it cannot control a presentation more interactively such as highlighting an aspect permanently or give visual or haptic
feedback. Especially while pointing with such a device, it does not compensate human’s
natural hand tremor and thus makes it hard for both the presenter to point steadily and
accurately as well as the audience to identify the highlighted aspects. These disadvantages
during a presentation can be perceived as unpleasant by the audience.
Therefore, a laser pointer developed at the Human-Computer Interaction Group at the
University of Konstanz can improve comfortability while presenting. It is an absolute
83
84
CHAPTER 5. USE CASES
Figure 5.1: The Speed-Link SL-6199 Presenter Professional used to control Microsoft PowerPoint
presentations remotely.
pointing device and originally intended for interaction with large high-resolution displays [40]. This kind of interaction is closely related to human behavior when pointing
with the index finger or full hand to a specific object. For instance, when a person wants
to highlight an object he points to the direction of the object. In addition, several filters
have been developed to improve accuracy when pointing from large distances [42, 41]. The
laser pointer device is augmented with an three-axis accelerometer and a button module
providing the user with three buttons (see Figure 5.2). Also the haptic and visual channels
of a user can be stimulated by a vibrant motor and six multi-colorable LEDs, e.g. placed
below buttons to highlight these.
When using Squidy and linking the laser pointer’s output to a mouse’s output, a user
can fully control a standard WIMP application. Here, the IR reflexion point on a planar
surface is translated into mouse coordinates by optical tracking and the three buttons
are emulating the left, right, and middle buttons on a standard mouse input device.
Thus, a PowerPoint presentation can be held without further improvements. A user can
emphasize aspects by moving the mouse cursor towards a specific point on the screen,
switch slides forth by clicking the left button (emulating the left mouse button), and
switch slides back calling PowerPoint’s context menu with the right button (emulating
the right mouse button) and selecting the “Previous Slide” menu item with the left mouse
button. Despite the possibility to control a PowerPoint presentation by emulating WIMP
mouse interaction, past experience showed that users do not feel comfortable employing
this interaction technique. Therefore, a more advanced laser pointer interaction technique
has been developed that has the advantages of existing presenter tools and furthermore
provides the possibility to highlight aspects permanently and giving haptic and visual
feedback. In order to demonstrate the different user roles involved in the development of
5.1. PRESENTER TOOL
85
Figure 5.2: The laser pointer device consists of a IR laser diode, a button module, a vibrator,
and led diodes.
a new interaction technique we exemplify the distinct and necessary tasks.
Since Squidy already offers ready-to-use components an interaction designer does not need
to integrate these input and output devices and filters from scratch. Here, the laser pointer
node and mouse output node are available through the node repository and only need to
be dragged and dropped on a pipeline (see Figure 5.3).
When the interaction designer starts this pipeline containing the two nodes he it enables
end-users to switch slides forth by clicking the left button (yellow button on the laser
pointer) and to switch slides back accessing PowerPoint’s context menu and selecting the
“Previous Slide” menu item. Additionally, to adjust the laser pointer’s or mouse’s behavior
the interaction designer simply needs to demand the properties view of either the laser
pointer or the mouse node (see Figure 5.4) (e.g. adjust color setting of the button on the
laser pointer).
In order to enhance this basic interaction technique and improve its usability, an advanced
interaction designer drags and drops an empty node from the node repository on the
pipeline (see Figure 5.5 (a)). Then the user changes the node name by zooming into the
empty node and double clicks on the node label in the node’s navigation bar whereas a
text field occurs that allows to rename the node to “Powerpointer” (see Figure 5.5 (b)).
Next, the interaction designer wants to implement custom behavior, e.g. switching slides
forth when an end-user clicks the right button (blue) and switching slides back when he
clicks the left button (yellow). Therefore, the interaction designer zooms farther into the
source code view of the “Powerpointer” node (see Figure 5.5 (c)).
Here, interceptions of the dataflow are handled by implementing specific method stubs as
introduced in Section 4.9.2 – Processing. Therefore, data button objects are intercepted in
the “Powerpointer” node and transformed into necessary keystrokes arrow right to switch
86
CHAPTER 5. USE CASES
Figure 5.3: A simple interaction technique where a laser pointer used as input device allows to
control an operating systems mouse cursor and additionally simulates left and right
mouse button clicks.
87
5.1. PRESENTER TOOL
(a)
(b)
Figure 5.4: Property views of: (a) the laser pointer, and (b) the mouse input/output node.
a slide forth and arrow left to switch a slide back (see Listing 5.1). Next, the source code
will be compiled and integrated automatically if the interaction designer presses the save
button at the top of the source code view or zooms out of the source code view. This
will instantly apply the newly implemented interaction behavior as pressing the left upper
button on the laser pointer moves slides back and pressing the right upper button moves
slides forth, which is similar to European reading directions; reading from left to right or
flipping pages in a book.
Because the developer uses keystrokes, an additional keyboard node is required that is
able process these two key events. However, the node repository already provides such a
ready-to-use keyboard node (see Figure 5.6).
Although, the Powerpointer interaction technique is at this stage similar to the previously
introduced Speed-Link SL6199 Presenter Professional (see Figure 5.1), the interaction
designer is able to further improve the technique by the possibility to draw on slides. If
drawing or more precisely highlighting is desired, he simply needs to extend the previously
explained code example (see Listing 5.1) and transform data button objects to adequate
keystrokes, which is shown in Listing 5.2. In this source code example, the circle button
(red button on the laser pointer) provides two actions. Pressing and holding the button for
a certain time changes the PowerPoint presentation mode from pointing mode to drawing
mode. Hereupon, an end-user can draw on a current slide while holding the button
pressed and thus is able to persistently highlight important aspects until he releases the
button, which then changes the mode back to presentation mode. Shortly pressing the
button reveals a pie menu providing additional functionality such as slide overview and
delete drawings (see Figure 5.7 (a)), which is similar to the CrossY menu introduced by
Georg Apitz and François Guimbretière [3]. For instance, moving the laser pointer device
downwards and thus crossing the pie menu at “Delete Drawings” deletes all drawings on
the current slide. The pie menu is rendered in a Swing JFrame featuring a transparent
background to provide the pie menu upon existing WIMP applications such as Microsoft
PowerPoint. It furthermore opens centered to the current location of the mouse pointer
(see Figure 5.9 (b)).
88
CHAPTER 5. USE CASES
Listing 5.1: An implementation that intercepts left and right button presses (e.g. on a laser
pointer or a mouse device) and substitutes them with left arrow and right arrow
keystrokes.
/* *
* Intercepting data button objects , e . g . originating from a button press on the
* laser pointer .
*/
public IData p r o c e s s ( DataButton dataButton ) {
switch ( dataButton . getButtonType ( ) ) {
// Left button on the laser pointer .
case DataButton .BUTTON_1:
D a t a D i g i t a l leftArrowDown = new D a t a D i g i t a l ( P o w e r p o i n t e r . c l a s s , true )
leftArrowDown . s e t A t t r i b u t e ( Keyboard .KEY_EVENT, KeyEvent .VK_LEFT) ;
p u b l i s h ( leftArrowDown ) ;
D a t a D i g i t a l l e f t A r ro w U p = new D a t a D i g i t a l ( P o w e r p o i n t e r . c l a s s , f a l s e )
l e f t Ar r o w U p . s e t A t t r i b u t e ( Keyboard .KEY_EVENT, KeyEvent .VK_LEFT) ;
p u b l i s h ( l e ft A r r o wU p ) ;
// Ignore original button press .
return n u l l ;
// Right button on the laser pointer .
case DataButton .BUTTON_3:
D a t a D i g i t a l leftArrowDown = new D a t a D i g i t a l ( P o w e r p o i n t e r . c l a s s , true )
leftArrowDown . s e t A t t r i b u t e ( Keyboard .KEY_EVENT, KeyEvent .VK_RIGHT) ;
p u b l i s h ( leftArrowDown ) ;
D a t a D i g i t a l l e f t A r ro w U p = new D a t a D i g i t a l ( P o w e r p o i n t e r . c l a s s , f a l s e )
l e f t Ar r o w U p . s e t A t t r i b u t e ( Keyboard .KEY_EVENT, KeyEvent .VK_RIGHT) ;
p u b l i s h ( l e ft A r r o wU p ) ;
// Ignore original button press .
return n u l l ;
}
}
return dataButton ;
Listing 5.2: An extension to Listing 5.1, which either activates PowerPoint’s drawing mode if a
timer threshold elapses or opens a pie menu if the end-user releases the button before
the timer threshold elapses.
// Circle Button on the laser pointer
case DataButton .BUTTON_2:
i f ( dataButton . g e t F l a g ( ) ) {
// If timer elapses activate drawing mode .
activateTimer ( ) ;
}
else {
i f ( isDrawingModeActive ( ) ) {
deactivateDrawingMode ( ) ;
}
else {
showPieMenu ( ) ;
}
}
// Ignore original button press .
return n u l l ;
89
5.1. PRESENTER TOOL
(a)
(b)
(c)
Figure 5.5: Implementing a new filter technique: (a) an empty node connected, which was previously dragged and dropped out of the node repository, (b) renaming the empty node
to “Powerpointer”, and (c) the source code of the “Powerpointer” node, which has
currently no dataflow interception logic implemented.
To sum up, the Powerpointer interaction technique allows an end-user to switch slides
back and forth by pressing the left and right button on the laser pointer, whereas the right
button switches slides forth and the left button switches slides back when each button is
pressed. Similar to human pointing behavior, an end-user is able to move the operating
system’s mouse cursor by absolute pointing with the laser pointer. Moreover, an end-user
can switch to PowerPoint’s drawing mode by pressing and holding the circle button on
the laser pointer for a certain amount of time. After this time threshold exceeded and by
moving the laser pointer or more precisely the mouse cursor, he can draw and highlight
particular aspects on a slide. Releasing the circle button switches back to PowerPoint’s
presentation mode. If an end-user wants to erase existing drawings or likes to jump to a
specific slide, he shortly pushes and releases the circle button – before the time threshold
exceeds – whereas a crossing pie menu appears centered to the current mouse cursor
location. By completely crossing a pie slice the corresponding action will be performed
such as presenting a slide overview (see Figure 5.7 (b)) to the end-user or erasing drawings
90
CHAPTER 5. USE CASES
Figure 5.6: The Powerpointer pipeline of Figure 5.3 enhanced with a keyboard node.
on the current slide. The slide overview allows an end-user to jump to a specific slide by
pointing with the laser pointer device on the slide and selecting it with the left button.
So far, the interaction behavior is static and needs to be changed programmatically if any
change is desired (e.g. switching buttons’ action assignment).
In order to allow an interactive configuration and thus allow adjustments to the end-user,
the interaction designer needs to create properties once programmatically (see Listing 5.3),
which are provided then through the properties of the Powerpointer node. The user
interface controls (e.g. slider, checkbox, or text field) displayed in the properties view are
generated automatically from the source code. A technical paper of Squidy describes the
definition of properties and available user interface controls in more detail [66].
An interaction technique can be adjusted at runtime by changing property values of nodes
while an end-users employs the interaction technique simultaneously. For instance, if an
end-user likes to switch slides forth with the left button and switch slides back with the
right button, the interaction designer just reconfigures the buttons’ behavior by changing
their pre-defined settings in the Powerpointer’s properties view (see Figure 5.8).
Lastly an interaction designer publishes the Powerpointer node by pressing the publish
button, which will be available through Squidy’s node repository as a ready-to-use component for other interaction designers. Later on, other interaction designers are able to
use the Powerpointer node without the need to implement this interaction technique on
their own and thus are able to augment their dataflow emanating of a 2D pointing devices.
This augmented dataflow consists of 2D positions, buttons, and key strokes necessary to
control Microsoft’s PowerPoint application or applications using similar key bindings.
91
5.1. PRESENTER TOOL
Listing 5.3: A definition of an interactive property, which allows the interaction designer to
change left button behavior visually through the user interface.
@XmlAttribute ( name = " l e f t −b ut ton " )
@Property ( name = " S e t � l e f t � bu tt on � a c t i o n " )
@ComboBox( d o m a i n Pr o vi d e r = A c t i o n P r o v i d e r . c l a s s )
private S t r i n g l e f t B u t t o n A c t i o n = A c t i o n P r o v i d e r . SLIDE_PREVIOUS ;
public S t r i n g g e t L e f t B u t t o n A c t i o n ( ) {
return l e f t B u t t o n A c t i o n ;
}
public void s e t L e f t B u t t o n A c t i o n ( S t r i n g l e f t B u t t o n A c t i o n ) {
this . leftButtonAction = leftButtonAction ;
}
(a)
(b)
Figure 5.7: (a) A simple crossing pie menu implementing concepts similar to CrossY by Georg
Apitz and François Guimbretière [3] and (b) the slide overview presented to the user
when crossing the “Slide Overview” pie slice.
Additional improvements on the Powerpointer interaction technique increase its usability
although it provides a good foundation already. For instance if a user is presenting to an
audience and has the display in the back, he does not necessarily need to point at the
display to switch slides forth and back. He simply uses the device as a standard remote
control for PowerPoint presentations by pressing the left and right button on the laser
pointer or shakes the laser pointer device to erase drawings.
Finally, users who tested the interaction technique enjoyed usage in genuine presentation
but most of them did not use highlighting or the pie menu. In fact, this interaction
technique needs further evaluation and research to support users during the already constraining task of presenting. The Powerpointer scenario pointed out the opportunities
provided by the interaction library Squidy and furthermore highlighted the different user
92
CHAPTER 5. USE CASES
Figure 5.8: The properties view of the Powerpointer node allows rapid and frequent changes of
the Powerpointer interaction technique.
(a)
(b)
Figure 5.9: Impressions of the Powerpointer interaction technique: (a) an end-user employing
the Powerpointer interaction technique, and (b) the pie menu reveals further actions
available by the Powerpointer interaction technique.
roles involved in the development of an interaction technique. In the next sections we
present further projects that have been realized with the help of Squidy.
5.2. AUGMENTING EVERYDAY OBJECTS
5.2
93
Augmenting Everyday Objects
The capability to use the interaction library Squidy for academic courses was determined
by its increasing stability and diversity of filter techniques. The course “Interaction design for high-resolution displays” at the University of Konstanz seemed to be the best
foundation for such an interaction library. A part of the course was to design somewhat
novel widgets based on hardware sensors (Phidgets). The mandatory programming environment was the interaction library Squidy and its dataflow programming API. Therefore,
several nodes have been provided to the students as they should focus on their interaction
design and not be constrained by additional work. It furthermore allowed users with less
programming experience to visually design a novel interaction technique. However, more
advanced techniques had to be implemented manually by the participants. The course
was given during the winter term 2009.
The main component of the Phidgets1 is represented by a logical controller board (e.g.
InterfaceKit or TextLCD) with analog and digital inputs as well as digital outputs. A
controller is either connected via USB to the computer or runs a programmed routine
autonomously. Several sensors can be connected to the controller’s analog input ports. A
manifold collection of sensor types are available such as a light sensor, humidity sensor,
pressure sensor, 2-axis and 3-axis accelerometers, servo controllers and servo motors. Most
programming languages are supported to read and set values of the sensors throughout
the controller.
In the course, the students were instructed to augment an everyday object with Phidgets
sensors and thus make that object more useful, indispensable, helpful, or essential. Despite
the students were given a single week to conceptualize, build, and implement a widget two
inspiring projects evolved, which will be presented in conclusion.
5.2.1
The Advising Key Holder
Often, when people leaving their homes they forget to pick up things that are important
for the day such as customer documents, an umbrella when it is raining outside, or the
lights for a bicycle when it is dark outside. Therefore, a friendly reminder aware of outside
and environmental conditions can help beginning a day more relaxed.
The sophisticated key holder developed by a student of the course consists of a TextLCD
controller, a light sensor, a humidity sensor, and a vibration sensor. Furthermore, these
sensors are cased prototypal in a paper box and a screw in the lower middle of the box is
acting as handle for the keys (see Figure 5.10).
The vibration sensor is directly connected to the screw so that the key holder can indicate
when the user is leaving home. Furthermore, the humidity sensor can inform the user
whether it is raining outside and thus advise him to wear a cagoule and the light sensor
indicating outside’s light condition and giving the advise to grab the lights for the bicycle. The pipeline controlling the key holder widget is illustrated in Figure 5.11. On the
left, the pipeline contains a PhidgetInterfaceKit (PhidgetI...) node that receives sensor
1
Products for USB Sensing and Control – http://www.phidgets.com/
94
CHAPTER 5. USE CASES
(a)
(b)
Figure 5.10: The context aware key holder assembled of several Phidgets sensors: (a) The humidity sensor indicates that it is raining outside, (b) the light sensor indicates that
it is getting darker outside and bicycle lights are required.
change events of the connected temperature and humidity sensors, which then are routed
to adjacent nodes. The SensorIndexSplit (SensorIn...) nodes filter the dataflow to allow
routing of sensor input to a specific computation node such as TriggerSpecifiedSensors
(TriggerS...), ComputeTemperature and ComputeHumidity (both Compute...). The trigger node activates the temperature and humidity sensors after the keys has been taken
from the keyboard pin. Thereafter, in the computing nodes the current temperature and
humidity values are calculated and the results routed to the adjacent ConcatenateStrings
node. This node in turn sends a string to the PhidgetTextLCD that displays the temperature and humidity on the LCD display. In addition, this widget was developed with the
first stable prototype of the Squidy interaction library.
5.2.2
The TakeCare Flower Pot
People not having a green thumb do know about the risk of having plants and flowers and
not knowing if the current condition is perfect. Hence, a further project that has been
implemented by a student is a flower pot taking care of a plant. This everyday object is
augmented with a TextLCD controller providing the user with feedback about location
condition and plant requirements (see Figure 5.12).
Integrated light and temperature sensors measure surrounding light and temperature conditions and thus indicating whether it is too bright or hot and the pot location needs to
be changed. Further an integrated humidity sensor gives colored feedback through LEDs
whether the owner should water the plant (green =
ˆ water ok / yellow =
ˆ needs a little
water / red =
needs
water).
Unfortunately,
the
pipeline
of
the
TakeCare
Flower Pot is
ˆ
lost and could not be reconstructed by the author of this thesis.
These briefly introduced projects showed the feasibility of the Squidy used as rapid interaction prototyping tool for the design of intelligent widgets. Furthermore, applications
that demand the processing core of Squidy are presented in the next sections.
5.2. AUGMENTING EVERYDAY OBJECTS
95
Figure 5.11: The Squidy pipeline controlling the sensors of key holder widget and furthermore
providing textual output on the PhidgetTextLCD controller.
96
CHAPTER 5. USE CASES
(a)
(b)
Figure 5.12: The take care flower pot assembled of several Phidgets sensors taking care of a plant
by providing the owner with valuable feedback such as surrounding light, humidity,
and temperature conditions: (a) indicating that the flower needs more light and
temperature needs to be decreased, (b) indicating optimal light conditions but it is
too hot.
5.3
Artistic and Exhibit Installations
A demanding task for the interaction library are installations such as the Ideenpark
“Zukunft Technik Entdecken”2 2008 at the fair trade center in Stuttgart, which was sponsored by ThyssenKrupp. The installation was exposed from May 17th to May 25th and
around 290.000 people were visiting the Ideenpark. There, the artistic installation Globorama3 , which was mainly developed at the ZKM4 has been presented as “Erkundung von
Lebensräumen”5 to the public. The laser pointer interaction developed at the HumanComputer Interaction Group at the University of Konstanz was used to allow a single user
to control a world map application. This application was projected onto a 360 degree
panorama screen where users could navigate to particular locations all over the world.
This laser pointer interaction was controlled by Squidy and processed users interaction
without having any issue during exhibition.
2
ThyssenKrupp Ideenpark –
http://www.zukunft-technik-entdecken.de/aktivitaeten/ideenpark/
3
Globorama at the PanoramaFestival – http://www.zkm.de/panoramafestival/
4
Center for Art and Media in Karlsruhe
5
Loosely translated: “Habitats of Sensing”
97
5.3. ARTISTIC AND EXHIBIT INSTALLATIONS
A further installation was exhibited at the “Symposium für Heereslogistik” in Aachen
arranged by the German Federal Armed Forces. There, a user help-desk of the future developed by the Human-Computer Interaction Group together with the EADS Defence &
Security6 was presented to the generals of international military forces. Squidy controlled
a tangible tabletop allowing a more direct multi-touch and token interaction (see Figure 5.13).
(a)
(b)
(c)
Figure 5.13: Short-takes of the “Symposium für Heereslogistik” in Aachen: (a) setup of the user
help-desk of the future, (b) presenting the help-desk to generals of the German
Federal Armed Forces, and (c) interaction with a token that controls a pre-defined
scenario.
More devices and protocols supported by the interaction library Squidy are the Wii Remote, Anoto Pen, tangible interaction such as SquidyVision7 and ReacTIVision8 , and
standard protocols such as TUIO9 [37] and OSC10 (see Figure 5.14). A complete listing
of devices and use cases can be found in the dissertation of Werner A. Koenig [39].
(a)
(b)
(c)
Figure 5.14: A collection of supported devices: (a) a Wii Remote device, (b) an Anoto digital
pen, and (c) tangible interaction using touch, token, and pen input.
In summary, interaction designers are well supported by the interaction library Squidy.
They can focus on concepts and design of interaction with machines, computers, or even
passive and everyday objects. Furthermore, the concept of visual programming together
6
EADS Defence & Security – http://www.ds.eads.com/
SquidyVision SVN – http://svn.squidy-lib.de/svn/clients/SquidyVision/
8
ReacTIVision – http://reactivision.sourceforge.net/
9
Table-Top User Interface Objects – http://tuio.org/
10
Open Sound Control – http://opensoundcontrol.org/
7
98
CHAPTER 5. USE CASES
with the dataflow programming language allows users to develop novel interaction techniques even if they lack in programming expertise. The manifold existing input devices,
output devices, and filter techniques offer a good foundation for the development of new
interaction techniques. Furthermore, users are inspired to integrate and test filters developed for other purposes that however improve a current interaction technique.
Chapter 6
Conclusion
Contents
6.1
Outlook and Future Work . . . . . . . . . . . . . . . . . . . . . . 101
“In the future, computers may weigh no more than 1.5 tonnes.”
— Popular Mechanics, 1949
This thesis introduced the necessity of more natural and comprehensible interaction techniques building upon users’ pre-existing knowledge of everyday life (explicit and tacit
knowledge). Moreover, it emphasizes the lack of tool support for the development of postWIMP and natural user interfaces employing interaction techniques beyond keyboard and
mouse. In order to realize a homogeneous framework and toolkit applicable for interaction
design, we identified important criteria for such a single design environment. In contrast
to existing frameworks and toolkits such as ICON Input Configurator [21] and OpenInterface [71, 45] we identified the user roles of end-users, interaction developer and framework
developer beyond the interaction designer. These user roles cover all needs in the process
of interaction design and thus helps to elaborate the requirements for a design environment
addressing all user needs. However, these requirements stated challenges such as the ability to program interaction techniques with less or no programming experience, iterative
prototyping, debugging, and integration of device drivers and filter techniques. We faced
these challenges using several user interface concepts and software engineering patterns
such as dataflow visual programming language, semantic zooming, goal-directed zoom, interactive configuration, drag and drop, object-oriented actions, on-the-fly compilation and
integration, visual debugging, and hierarchical pipelines. All these concepts were implemented in the interaction library Squidy, which is a design environment for the design of
natural user interfaces. Furthermore, Squidy has been evaluated in a formative evaluation
study. The ten participants of the study were able to solve all tasks and the measured
task completion time allowed us to identify “walls” according to Myers [56], which state
the barriers of Squidy. Furthermore, the interviews and questionnaires provided valuable
feedback and revealed design flaws (e.g. multi-focal view on a pipeline and heavy zoom
operations hinders rapid prototyping). These results allow systematic refinements of the
interaction library, which, in turn, can be evaluated again. The use cases in Chapter 5
99
100
CHAPTER 6. CONCLUSION
Table 6.1: The conclusive comparison of the interaction library Squidy with the established criteria of Section 3.1. The (+) sign indicates a matched criterion and the empty space
indicates room for improvements.
Application
Programming
Interface
Ready-to-use components
Reuse of components
Manageable complexity
Component suggestion
Multi-platform support
Expandability / extensibility
Embedded source code
Direct manipulation
Versioning
Multimodal interaction
Squidy
+
+
+
+
+
+
+
+
+
(+)
highlight the opportunities offered by such an interaction library. It has been used for various artistic and exhibit installations, was farther used in academic courses and serves as
toolkit for the design of novel interaction techniques at the Human-Computer Interaction
Group at the University of Konstanz. Nevertheless, the project Squidy is not concluded
as both the evaluation results discovered design flaws as well as the criteria established
in Section 3.1 – Criteria on a Design Environment have not been achieved completely
(see Table 6.1 and compare with Table 3.1).
Squidy offers a simple yet powerful API to develop novel and multimodal interaction techniques providing a visual programming language. The feature “Multimodal Interaction”
is set in brackets as it is supported programmatically only. The unified and generic data
types according to Victor L. Wallace semantics of graphic input devices [81] offer a high
reuse and transfer of nodes to different interaction techniques. These nodes are accessible
through the suggesting node repository and are furthermore ready-to-use without the need
of custom implementations. If an interaction technique is not yet available, an advanced
interaction designer is able to integrate new device drivers or filter techniques using the
embedded source code view accessible through semantic zooming, which furthermore reduces complexity to a minimum but provides high ceiling [56] on demand. Moreover,
the interactive process of interaction design is supported by node property adjustments
instantly applied to the interaction technique. Nevertheless, the design environment does
not proffer versioning such as a node property history or comparison of two distinct source
code versions of a node, which neither allows a reconstruction of a best-performing node
settings nor supports users in the development of new filter techniques.
These identified drawbacks provide connecting factors to further development that can
increase usability, stability, and most importantly, the fun factor.
6.1. OUTLOOK AND FUTURE WORK
6.1
101
Outlook and Future Work
In order to provide a guidance for further development we briefly describe improvements
in the following sections. Furthermore, a transfer of the concepts utilized in Squidy is
going to show show the applicability of DFVPL, details on demand, and the heterogeneity
of a single design environment in different domains.
6.1.1
C# Bridge
In Squidy, data is processed without any interlinking between an interaction and a user
interface component. As a consequence of a missing implementation of a “reference” data
object, Squidy does not get feedback on an application which visual element has been
chosen (e.g. by a 2D position). Therefore, a higher-level interpretation of the dataflow
is still left to the user interface designer. Such a higher-level interpretation of interaction
accompanied by references to visual objects can be guaranteed by implementing the primitive type “pick” according to Victor Wallace’s semantics of graphic input devices [81].
The first prototype introduced in Section 5.1, page 83 is using both dataflow processing
as well as reference handling of visual user interface components. Nevertheless, user interface design and interaction design has been developed solely with the capabilities of
Squidy and Java. Allowing a decoupled development of the user interface as well as the
interaction design, can decrease development time of prototypes as well as applications.
Since Microsoft’s C#/.NET offers profound support in the declarative design of graphical
user interfaces it is going to act as basis of a testbed to show the feasibility of bringing
these two worlds together but still allowing independent development of the interaction
design and the user interface design.
A prototype has already been developed that transfers data objects originating from
Squidy to a C# bridge, which transforms these low-level interaction data into higherlevel events such as token added, swipe left, or shake occurred. In consequence, user
interface designers use these events preferably to the uninterpreted low-level data objects
routed between nodes. Nevertheless, this interface between interaction designers and user
interface designers leaves enough room for further research and improvements.
6.1.2
Logical Data Routing
Currently, Squidy suffers both in a more fine grain data routing as well as the visual design
of multimodal interaction. For example, a user has two sensors that allow circular rotation
(e.g. potentiometer) and wants to control a mouse cursor with these hardware widgets.
Currently, he needs to write programmatically a filter that merges the two analog values
originating from the widgets to a single dataflow of 2D positions. In order to provide
a consistent design environment this kind of fine grain or logical data routing could be
offered by Squidy using visual programming (see Figure 6.1).
Furthermore the sketch (see Figure 6.1) shows how freehand pointing and speech input can
be merged to a composition allowing multimodal interaction. Here, a pointing location and
a speech command will be composed semantically. Thereafter, an adjacent filter will be
able to interpret this composition as multimodal interaction and thus release a high-level
event (e.g. delete object X) according to previous section.
102
CHAPTER 6. CONCLUSION
Figure 6.1: A sketch of a visual language to define a more fine grained data routing in Squidy.
This approach is similar to the routing of logical circuit boards.
6.1.3
Advanced Dataflow Visualization
In Squidy, a user can get insight into the dataflow either by choosing a 2D-scatter plot
visualization or a 2D-thermo plot visualization. These visualizations are unsuitable for
data objects having more than the two dimensions (e.g. 6DOF originating from freehand
interaction). Therefore, future research needs to investigate better performing visualizations and toolkits. Additionally, a focus on the integration of Magic Lenses [7] could allow
manipulations on the interaction data itself (e.g. ability to annotate data on-the-fly) or
a more advanced data filter (e.g. spanning a rectangle lens on the dataflow visualization
filters data out that occurs outside of the rectangle’s boundaries).
6.1.4
Versioning
A neglected feature of the design environment are the undo and redo operations that are
basic in modern user interfaces. For example, these provide users with the comfort to
revoke incorrect input and return to a safe application state. In Squidy, iterative changes
on filter properties can lead to an unpredicted and unwanted interaction behavior and
thus often needs a user to undo these changes manually. Therefore, a versioning facility
recording user changes and providing these changes visually to the user could support
users while frequently adjusting properties (see Figure 6.2).
This sketch of such a versioning facility provides a versioning component at the bottom
of each properties view. There, a user can switch property settings back and forth by
sliding the gray viewing window to the left or to the right. Furthermore, the versioning
component highlights changes visually by coloring the foreground of changed properties
red. This concept of a viewing window is identical to the concept of the semantic scroller
introduced in Section 4.4.5, which in thus applies to the existing concepts of Squidy.
6.1. OUTLOOK AND FUTURE WORK
103
Figure 6.2: A low-fidelity prototype of the Squidy properties view that facilitates iterative property changing through a graphical versioning scroller.
6.1.5
Remote Control
Indeed, it is possible to run Squidy without using any graphical user interface but conversely the command-line interface itself has to be started within the same JVM1 . Theoretically, a workspace containing interaction techniques could be shared over the network
among several Squidy Core instances but needs prior setup of network hard drives. Consider a scenario where Squidy controls an operating system’s mouse cursor. Here, it can
hinder the interaction designer from adjusting properties of the corresponding interaction
technique while another user is interacting and thus both concurrently control the mouse
cursor. Therefore, decoupling Squidy’s graphical user interface and the processing engine
of Squidy can provide enough flexibility to control and adjust interaction techniques from
another computer.
Several networking techniques appear to be applicable in this current scenario. The peerto-peer network approach allows a user to run Squidy instances without the need of an
additional database server. Despite the decoupled approach, the Squidy instances need
to be “online” to receive changes. Furthermore, changes made to the source code are not
persisted at a global accessible storage and thus other users cannot receive incremental
updates (e.g. performance improvements). Using a database server to administer interactive workspaces does in fact need a permanently “online” system but provides innately
ACID certainty. The current database in Squidy relies on a local XML file where both
1
Java Virtual Machine
104
CHAPTER 6. CONCLUSION
processing details as well as visual properties are persisted. With a XML database such
as BaseX2 advantages of both local and remote control is feasible. Although, the client/server architecture of BaseX supports ACID safe transactions, an incremental update
of one client instance is not propagated automatically to other connected Squidy clients.
Therefore, a trigger needs to be implemented to allow incremental updates, e.g. using the
successive update pattern [75].
A prototype that shows the feasibility of remote control concepts has already been implemented. For storage, the BaseX core as well as the BaseX API needed to be changed
to integrate the trigger facility. At present both Squidy with remote storage and BaseX
supporting triggers are in an alpha status and need further development to stabilize the
design environment and the XML database server.
6.1.6
Visually Formulating Relational Algebra
The concept of dataflow visual programming language can be transferred to many domains.
It is especially applicable to domains where a large amount of data is handled and any
kind of data flowing through several filters. The “pipe-and-filter” metaphor can support
users with a background of databases and information systems while defining complex
database requests. Similar to standard dataflow programming languages, such queries are
formulated formally in a relational algebra syntax. Nevertheless, database operators need
to translate this formal language into SQL3 queries, which can be a highly demanding task
as sometimes formal language and SQL differ considerably. The following equation denotes
a relational algebra formulation that selects all tuples of a table “Person” where the “Age”
is greater or equal than 36. The corresponding SQL statement is shown in Listing 6.1.
σAge≥36 (P erson)
(6.1)
Listing 6.1: A SQL statement selecting tuples of a table Person where the attribute Age is greater
or equal than 36.
SELECT *
FROM Person
WHERE Age >= 36;
The table “Person” consisting of an attribute “Name” and an attribute “Age” is shown
in Table 6.2. This table contains five tuples; each corresponding to a unique person.
Applying the previous relational algebra statement on the Table 6.2 will reduce the number
of persons as it can be seen in Table 6.3. Here, all persons with an age lower than 36 are
filtered out.
Nevertheless, such a query formulated in relational algebra could also be designed by
visually composing nodes and filters similar to the concepts of Squidy. A sketch illustrates
how users can benefit as components involved in the query formulation are highlighted
visually, such as a table (white), a selection (gray), and a result (green) (see Figure 6.3).
2
http://www.basex.org/ - A client/server architecture supports ACID safe transactions, user management,
and logging.
3
SQL – Structured Query Language
6.1. OUTLOOK AND FUTURE WORK
105
Table 6.2: A table “Person” of a relational database containing 5 tuples.
Person
Name Age
Peter
36
Harry
58
Sally
32
Tim
62
Michael
33
Table 6.3: The table “Person” of Table 6.3 containing 3 tuples after a selection operation has
been performed.
σAge≥36 (P erson)
Name
Age
Peter
36
Harry
58
Tim
62
A user can create such a query by dragging and dropping a table “Person” from the
database schema, a selection and a result component from a list of operations to the
pipeline. Afterwards, he drags and drops the Age column of the “Person” table onto the
selection component and formulates the condition >= 36. In a final step, the output of the
selection is linked to the result component whereas the query result is presented as a stack
and can be browsed by the user manually. Other visualizations of the query results are
conceivable, such as a scatter plot, bar chart, or Hypergrid [34]. This approach is similar
to the approaches of visually exploring OLAP data warehouse by Svetlana Mansmann
and Marc H. Scholl [52] or the UniVis Explorer, a frontend to visually explore OLAP data
warehouses by Roman Raedle [64].
Figure 6.3: A sketch of a query formulation using concepts of visual programming.
In conclusion, to avoid translations from relational algebra to SQL a visual design environment based on the concepts of visual programming, dataflow programming, and semantic
zooming can help to reduce complexity. It furthermore allows users to visually define
query statements, which then will be applied to a database automatically and displays the
results in an user-defined and user-friendly visualization.
106
CHAPTER 6. CONCLUSION
List of Figures
1.1
The first prototype of a computer mouse invented and developed by the
Californian scientist Douglas Engelbart. . . . . . . . . . . . . . . . . . . . .
2.1
The human-machine interface. Input devices are the controls humans manipulate to change the machine state. [49] . . . . . . . . . . . . . . . . . .
The chart represents the historical appearance of user interfaces (from left
to right). It first began with command-line interfaces and later on supplemented with graphical user interfaces. Lately the emergent field natural
user interfaces have coined the term of ubiquitous computing [83], tangible
interaction [77], and reality-based interaction [32]. . . . . . . . . . . . . .
A screenshot of Lisa OS, a graphical user interface that was shipped with
Apple’s first personal computer, named Lisa. . . . . . . . . . . . . . . . .
In standard WIMP user interfaces the content of a file can be easily printed
by calling the context menu on an icon and send to printer. . . . . . . . .
Screenshots of Microsoft Bob: (a) The living room providing access to MS
Bob applications, (b) BOB Mail is an email application integrated in MS
Bob. . . . . . . . . . . . . . . . . . . . . . . . . . . . . . . . . . . . . . . .
How the computer sees us. [61] (the author transformed the original bitmap
image to a vector graphic) . . . . . . . . . . . . . . . . . . . . . . . . . . .
The “Three Zones of Engagement” as Dan Suffer puts it. It covers the
wide range of attraction, the intermediate observation and the interaction
as central point. . . . . . . . . . . . . . . . . . . . . . . . . . . . . . . . .
A sketch of Harper et al. [29] emphasizing past decades of computing and
giving a short prediction of ubiquitous computing in the year 2020. . . . .
2.2
2.3
2.4
2.5
2.6
2.7
2.8
3.1
3.2
3.3
3.4
3.5
Code completion provided by Eclipse IDE Java supplies users with possible
methods that can be called on the corresponding object. . . . . . . . . . .
This dialog shows a dialog to change behavior of a mouse connected to the
operating system Mac OS X. . . . . . . . . . . . . . . . . . . . . . . . . .
Multimodal interaction using freehand gestures and speech input to control
NipMap [24] at the Powerwall. . . . . . . . . . . . . . . . . . . . . . . . .
The graphical user interface of the ICON Input Configurator. An assembled
interaction techniques needs the user to route primitive data types from one
device to another. . . . . . . . . . . . . . . . . . . . . . . . . . . . . . . . .
The graphical user interface of Papier-Mâché allows debugging of an interaction technique. . . . . . . . . . . . . . . . . . . . . . . . . . . . . . . . .
107
2
.
8
.
9
. 10
. 11
. 11
. 12
. 14
. 16
. 19
. 21
. 23
. 24
. 25
108
LIST OF FIGURES
3.6
The OpenInterface Development Environment (OIDE) supports users visually in the design of post-WIMP interaction techniques. . . . . . . . . . . . 27
3.7
The three layers of “interaction sketching”: (a) an abstract linking of involved interactive components, (b) conceptualizing a component’s output
and input, and (c) adjusting properties and route a component’s output to
another component’s input. . . . . . . . . . . . . . . . . . . . . . . . . . . . 28
4.1
Early sketched low-fidelity and high-fidelity prototypes of the design environment: (a) a sketch already constituting visual dataflow programming,
and (b) an interactive prototype created with the prototyping tool iRise
constituting interaction concepts of Squidy. . . . . . . . . . . . . . . . . . . 36
4.2
The conducted focus group: (a) the group of participants discussing, (b)
digitally persisted results, and (c) paper-based notes made during execution. 38
4.3
Visual programming languages surveyed by Green and Petre: (a) LabVIEW
developed by National Instruments, (b) Prograph developed at the Acadia
University in Canada. . . . . . . . . . . . . . . . . . . . . . . . . . . . . . . 39
4.4
A flow graph that conceptualizes a Lucid program computing prime numbers. 41
4.5
The semantics of graphics input devices developed by Wallace [81]. This
set consists of five distinct types of virtual devices. . . . . . . . . . . . . . . 42
4.6
The data type hierarchy according to the semantics of graphic input devices
developed by Wallace [81] . . . . . . . . . . . . . . . . . . . . . . . . . . . . 45
4.7
A pipeline consisting of a source (laser pointer), several filters, and a sink
(cubes) that are connected to each other through pipes. This sketch of a
pipeline reflects a user’s mental model of a signal data processing chain. . . 46
4.8
The “pipe-and-filter” metaphor on which Squidy is based on: (a) An empty
pipeline, (b) two nodes that have been dragged from the node base on the
pipeline: Laser pointer and Kalman filter, (c) the two nodes are linked to
each other by a pipe, (d) an entire pipeline with source, sink, and filter nodes. 47
4.9
The visual representation of pipeline implemented in the Squidy interaction
library with a checkered background. . . . . . . . . . . . . . . . . . . . . . . 48
4.10 A node, e.g. a node to control Powerpoint presentations reveals its actions
on mouse over: (a) The Powerpointer node with the mouse cursor besides
the node, (b) the Powerpointer node with the mouse cursor over the node
and the four essential actions start processing, stop processing, duplicate
node, delete node (counter-clockwise starting from the top left). . . . . . . . 49
4.11 The navigation bar is displayed at the head of each node. It provides actions
to control the node and inside nodes (only pipelines), the node naming, and
a navigation breadcrumb. . . . . . . . . . . . . . . . . . . . . . . . . . . . . 50
4.12 The drag and drop interaction needed to link two nodes by a pipe: (a) press
and drag on an output port, (b) drag towards an input port of another node,
and (c) drop intermediate pipe on an input port. . . . . . . . . . . . . . . . 51
LIST OF FIGURES
109
4.13 The calendar in the Pad application introduced by Perlin and Fox uses
semantic zooming and the more the user zooms towards a specific geometric
point, the more details of the calendar is revealed. The calendar consists
of three distinct zoom levels: (a) the calendar overview provides a range of
ten years in the first zoom level, (b) the second zoom level reveals months
when zooming towards specific years, (c) the lowermost zoom level gives
access to distinct days of a month. . . . . . . . . . . . . . . . . . . . . . . . 54
4.14 Screenshots of an early version of the Squidy interaction library already
supporting semantic zooming. (a) a pipeline constituting a laser pointer
interaction technique, (b) a properties view of a node, e.g. laser pointer . . 54
4.15 The two semantic representations of a node illustrated by transition. . . . . 55
4.16 An entire zoom path that can be followed by the Squidy design environment.
On top a graphical representation of a pipeline is shown, by double-clicking
a pipeline node, it zooms semantically into the pipeline detail view (middle)
and a further semantic zoom reveals a dataflow visualization. . . . . . . . . 56
4.17 Three independent windows having different views on the same pipeline
for laser pointer interaction. It allows adjustments on a node’s properties,
views the status of a pipeline, and gains access to the interaction dataflow
simultaneously. . . . . . . . . . . . . . . . . . . . . . . . . . . . . . . . . . . 57
4.18 The properties view allows an interaction designer to adjust filter properties. 58
4.19 The information view of a node providing additional information about
functionality, pitfalls, or application. . . . . . . . . . . . . . . . . . . . . . . 59
4.20 Screenshots of an application using speed-dependent automatic zooming
according to Takeo Igarashi and Ken Hinkley [31]. (a) The zoom level of a
document is adjusted to the scroll speed of a user. (b) The faster the user
scrolls the more information of the document gets revealed by automatically
zooming out of the document. . . . . . . . . . . . . . . . . . . . . . . . . . . 60
4.21 An Alphaslider firstly introduced by Christopher Ahlberg and Ben Shneiderman [2]. . . . . . . . . . . . . . . . . . . . . . . . . . . . . . . . . . . . . 61
4.22 The search facility of Google’s browser Chrome. It amplifies the scrollbar
with annotation when a user searches for a specific word in a document.
The location of the found word in the document corresponds to the location
of the highlighted scrollbar. . . . . . . . . . . . . . . . . . . . . . . . . . . . 61
4.23 The node repository of the Squidy interaction library offers node implementations (e.g. integrated device drivers and filter techniques) as “blackboxes” to interaction designers. . . . . . . . . . . . . . . . . . . . . . . . . . 63
4.24 The pipe as it is implemented in Squidy. Each pipe has two data filters and
a dataflow visualization on top. . . . . . . . . . . . . . . . . . . . . . . . . . 64
4.25 The data type filter aims to reduce dataflow by selection or deselection
of particular data types: (a) all data types are selected and flow through
the pipe, (b) the data types data position 2d and data button are selected
whereas all other types are filtered out automatically. . . . . . . . . . . . . 65
110
LIST OF FIGURES
4.26 The dataflow visualization gives insights into a current dataflow: (a) the
scatter plot visualizes temporal and spatial one-dimensional and two-dimensional
data types flowing from right to left and (b) the thermo plot visualizes spatially and two-dimensional data whereas the temporal factor is mapped to
the data points alpha value. . . . . . . . . . . . . . . . . . . . . . . . . . . . 66
4.27 The source code of a node implementation is accessible directly in the design
environment. . . . . . . . . . . . . . . . . . . . . . . . . . . . . . . . . . . . 67
4.28 The Finder application of the Apple Mac OS X is giving access to the
hierarchical filesystem. . . . . . . . . . . . . . . . . . . . . . . . . . . . . . . 68
4.29 The concept of semantic zooming is farther adaptable to implement hierarchical pipelines: (a) a visually cluttered multi-touch and fiducial marker
recognition pipeline, (b) the same pipeline but resolved visual clutters using
hierarchical pipelines. . . . . . . . . . . . . . . . . . . . . . . . . . . . . . . 69
4.30 Illustrating the concepts of hierarchical pipelines. . . . . . . . . . . . . . . . 70
4.31 An flow chart diagram illustrating the processing chain of each node. . . . . 72
4.32 A benchmark of the Squidy interaction library testing dataflow throughput
in fps. It has been performed from 3 to 100 nodes and takes 40 seconds for
each cycle to measure the median fps. . . . . . . . . . . . . . . . . . . . . . 74
4.33 The download statistics of the Squidy interaction library since September
2009 arising from the statistical analysis of SourceForge.net. . . . . . . . . . 75
4.34 The mean ratings for the support of Squidy, concept of semantic zooming,
and fun factor over all four conducted tasks. . . . . . . . . . . . . . . . . . . 80
4.35 The mean difficulty of the subtasks rated by the participants of the evaluation. In order of the linearity of the analysis the tasks T4.1, T4.2, and
T4.3 correspond to the tasks T4.1, T4.3 and T4.5. . . . . . . . . . . . . . . 81
5.1
5.2
5.3
5.4
5.5
5.6
5.7
5.8
The Speed-Link SL-6199 Presenter Professional used to control Microsoft
PowerPoint presentations remotely. . . . . . . . . . . . . . . . . . . . . . .
The laser pointer device consists of a IR laser diode, a button module, a
vibrator, and led diodes. . . . . . . . . . . . . . . . . . . . . . . . . . . . .
A simple interaction technique where a laser pointer used as input device
allows to control an operating systems mouse cursor and additionally simulates left and right mouse button clicks. . . . . . . . . . . . . . . . . . . .
Property views of: (a) the laser pointer, and (b) the mouse input/output
node. . . . . . . . . . . . . . . . . . . . . . . . . . . . . . . . . . . . . . . .
Implementing a new filter technique: (a) an empty node connected, which
was previously dragged and dropped out of the node repository, (b) renaming the empty node to “Powerpointer”, and (c) the source code of the
“Powerpointer” node, which has currently no dataflow interception logic
implemented. . . . . . . . . . . . . . . . . . . . . . . . . . . . . . . . . . .
The Powerpointer pipeline of Figure 5.3 enhanced with a keyboard node.
(a) A simple crossing pie menu implementing concepts similar to CrossY
by Georg Apitz and François Guimbretière [3] and (b) the slide overview
presented to the user when crossing the “Slide Overview” pie slice. . . . .
The properties view of the Powerpointer node allows rapid and frequent
changes of the Powerpointer interaction technique. . . . . . . . . . . . . .
. 84
. 85
. 86
. 87
. 89
. 90
. 91
. 92
LIST OF FIGURES
5.9
5.10
5.11
5.12
5.13
5.14
6.1
6.2
6.3
Impressions of the Powerpointer interaction technique: (a) an end-user employing the Powerpointer interaction technique, and (b) the pie menu reveals further actions available by the Powerpointer interaction technique. .
The context aware key holder assembled of several Phidgets sensors: (a)
The humidity sensor indicates that it is raining outside, (b) the light sensor
indicates that it is getting darker outside and bicycle lights are required. . .
The Squidy pipeline controlling the sensors of key holder widget and furthermore providing textual output on the PhidgetTextLCD controller. . . .
The take care flower pot assembled of several Phidgets sensors taking care of
a plant by providing the owner with valuable feedback such as surrounding
light, humidity, and temperature conditions: (a) indicating that the flower
needs more light and temperature needs to be decreased, (b) indicating
optimal light conditions but it is too hot. . . . . . . . . . . . . . . . . . . .
Short-takes of the “Symposium für Heereslogistik” in Aachen: (a) setup of
the user help-desk of the future, (b) presenting the help-desk to generals of
the German Federal Armed Forces, and (c) interaction with a token that
controls a pre-defined scenario. . . . . . . . . . . . . . . . . . . . . . . . . .
A collection of supported devices: (a) a Wii Remote device, (b) an Anoto
digital pen, and (c) tangible interaction using touch, token, and pen input.
111
92
94
95
96
97
97
A sketch of a visual language to define a more fine grained data routing in
Squidy. This approach is similar to the routing of logical circuit boards. . . 102
A low-fidelity prototype of the Squidy properties view that facilitates iterative property changing through a graphical versioning scroller. . . . . . . . 103
A sketch of a query formulation using concepts of visual programming. . . . 105
112
LIST OF FIGURES
List of Tables
3.1
The conclusive enumeration of toolkits linked to the established criteria.
The (+) sign indicates a matched criterion and the empty space indicates
room for improvements. . . . . . . . . . . . . . . . . . . . . . . . . . . . . . 29
6.1
The conclusive comparison of the interaction library Squidy with the established criteria of Section 3.1. The (+) sign indicates a matched criterion
and the empty space indicates room for improvements. . . . . . . . . . . . . 100
A table “Person” of a relational database containing 5 tuples. . . . . . . . . 105
The table “Person” of Table 6.3 containing 3 tuples after a selection operation has been performed. . . . . . . . . . . . . . . . . . . . . . . . . . . . . 105
6.2
6.3
113
114
LIST OF TABLES
Listings
2.1
2.2
4.1
4.2
5.1
5.2
5.3
6.1
A simple “echo” command echos given arguments to the bash. Here, the
two arguments “Hello” and “World!” are printed to the output stream of
the bash command frame after the user hits the enter key. . . . . . . . . .
This command sends the textfile.txt to a printer connected on parallel port
LPT2. . . . . . . . . . . . . . . . . . . . . . . . . . . . . . . . . . . . . . .
A program written with the Lucid dataflow programming language that
computes prime numbers. . . . . . . . . . . . . . . . . . . . . . . . . . . .
An example skeleton of a node implementation. It illustrates the minimum
definition to be accessible through the node repository. . . . . . . . . . . .
An implementation that intercepts left and right button presses (e.g. on a
laser pointer or a mouse device) and substitutes them with left arrow and
right arrow keystrokes. . . . . . . . . . . . . . . . . . . . . . . . . . . . . .
An extension to Listing 5.1, which either activates PowerPoint’s drawing
mode if a timer threshold elapses or opens a pie menu if the end-user releases
the button before the timer threshold elapses. . . . . . . . . . . . . . . . .
A definition of an interactive property, which allows the interaction designer
to change left button behavior visually through the user interface. . . . .
A SQL statement selecting tuples of a table Person where the attribute Age
is greater or equal than 36. . . . . . . . . . . . . . . . . . . . . . . . . . .
115
.
8
.
9
. 41
. 70
. 88
. 88
. 91
. 104
116
LISTINGS
Appendix A
Evaluation Documents
Contents
A.1 Agreement
. . . . . . . . . . . . . . . . . . . . . . . . . . . . . . . 117
A.2 Tasks . . . . . . . . . . . . . . . . . . . . . . . . . . . . . . . . . . . 119
A.3 Questionnaires . . . . . . . . . . . . . . . . . . . . . . . . . . . . . 128
A.1
Agreement
The agreement that each participant of the workshop had to sign. It allows the conductors
to analyze data collected during the workshop. The collected data is added to the DVD
to reconstruct evaluation results.
117
118
APPENDIX A. EVALUATION DOCUMENTS
Montag, 24.08.2009
Einverständniserklärung
Sehr geehrte(r) Teilnehmer(in),
Vielen Dank dafür, dass Sie sich bereit erklärt haben am Squidy-Workshop
teilzunehmen. Dieser Workshop soll nicht nur Ihnen einen tieferen Einblick in Squidy
bescheren, sondern auch uns dabei helfen eventuelle Schwächen von Squidy
aufzudecken und beheben zu können. Dazu werden wir über den Tag Daten
aufzeichnen, die uns im Anschluss eine Analyse ermöglichen. Die durch Sie
gewonnen Daten werden von uns streng vertraulich behandelt. Darüber hinaus
werden sie anonymisiert womit ein Rückschluss auf Ihre Person ausgeschlossen ist.
Die durch Sie generierten Daten umfassen folgende Punkte:
!
!
!
!
!
!
Pipelines (Squidy-Dateien)
Source Code
Fragebögen
Interviews
Audio Aufzeichnungen
Video Aufzeichnungen
Bitte bestätigen Sie mit Ihrem Namen und Ihrer Unterschrift, dass Sie mit der
Aufzeichnung und vertraulichen Verarbeitung der oben genannten Daten
einverstanden sind.
Ort/Datum:
Konstanz, 24.08.2009
Name:
___________________
Unterschrift:
___________________
A.2. TASKS
A.2
119
Tasks
The tasks performed during the workshop/evaluation. It was carried out with five groups
and two participants each. The groups had to solve the four main tasks. These tasks are
divided into several subtasks. An excerpt of the evaluation tasks can be found as follows.
The complete document is available on the DVD.
120
APPENDIX A. EVALUATION DOCUMENTS
Wenn Probleme beim Lösen der Aufgabe
können Sie sich jederzeit an Ihren
wenden. Er wird Ihnen gerne helfen.
auftreten,
Testleiter
1. Aufgabe
Blatt 2/2
Szenario: Sie möchten eine Anwendung auf einem entfernten Computer mit ihrer
lokalen Maus steuern.
Starten Sie Squidy und senden sie die Bewegungsdaten ihrer Maus zu
dem Rechner mit der IP Adresse 192.168.X.X. Dort läuft ebenfalls Squidy
und nimmt auf Port XXXX die Bewegungsdaten entgegen. Die Aufgabe ist
erfüllt, wenn Sie mit Ihrer Maus den Cursor auf dem verbundenen Rechner
steuern können.
Auf dem entfernten Rechner läuft eine Anwendung, die ein anderes
Koordinatensystem für die Berechnung und Darstellung der Pixel
verwendet. Daraus ergibt sich das Problem, dass sich die Maus nicht wie
gewohnt steuern lässt. Bitte korrigieren Sie dies.
Bitte bewerten Sie die Schwierigkeit dieser Aufgabe bevor
Sie mit der praktischen Lösung beginnen.
Die Aufgabe erscheint mir:
Sehr schwer
Sehr einfach
Bitte melden Sie sich umgehend bei Ihrem Testleiter
sobald Sie die Aufgabe erfüllt haben.
121
A.2. TASKS
Bitte bewerten Sie die Schwierigkeit dieser Aufgabe erneut
nachdem Sie mit der praktischen Lösung fertig sind.
Die Aufgabe empfand ich als:
Sehr schwer
Sehr einfach
122
APPENDIX A. EVALUATION DOCUMENTS
Wenn Probleme beim Lösen der Aufgabe
können Sie sich jederzeit an Ihren
wenden. Er wird Ihnen gerne helfen.
auftreten,
Testleiter
2. Aufgabe
Blatt 3/3
Szenario: Sie möchten eine Powerpoint-Präsentationen mit einem iPhone
fernbedienen.
Starten Sie Squidy und stellen Sie eine Verbindung zwischen der iPhone
App „Squidy-Client“ und Squidy auf Ihrem Rechner her. Geben Sie die
Fingerposition vom iPhone an den Mauszeiger an ihren lokalen Rechner
weiter, so dass sie mit dem berührungssensitiven Bildschirm des iPhones
die Bewegung des Mauszeigers steuern können. Starten Sie die
Powerpoint-Datei „Test.pps“ und schalten Sie die Folien mit dem iPhone
weiter.
Sie möchten nun auch mit dem iPhone auf der Powerpoint-Präsentation
zeichnen. Dazu soll der Anwender durch gleichzeitiges Auflegen von zwei
oder mehr Fingern auf dem iPhone den Modus umschalten können um so
entweder durch Bewegen des Fingers zu zeichnen oder den Mauszeiger
zu steuern.
Hinweis: In Powerpoint gibt es zwei Modi:
- "Pfeil"-Modus (Tastenkombination "STRG + A")
- "Filzstift"-Modus (Tastenkombination "STRG + P")
Sie möchten nun durch Schütteln des iPhones bereits gezeichnete Skizzen
auf den Folien wieder Löschen (Taste „L“) können. Realisieren Sie diese
Funktionalität.
Bitte bewerten Sie die Schwierigkeit dieser Aufgabe bevor
Sie mit der praktischen Lösung beginnen.
Die Aufgabe erscheint mir:
Sehr schwer
Sehr einfach
Bitte melden Sie sich umgehend bei Ihrem Testleiter
sobald Sie die Aufgabe erfüllt haben.
123
A.2. TASKS
Bitte bewerten Sie die Schwierigkeit dieser Aufgabe erneut
nachdem Sie mit der praktischen Lösung fertig sind.
Die Aufgabe empfand ich als:
Sehr schwer
Sehr einfach
124
APPENDIX A. EVALUATION DOCUMENTS
Wenn Probleme beim Lösen der Aufgabe
können Sie sich jederzeit an Ihren
wenden. Er wird Ihnen gerne helfen.
auftreten,
Testleiter
3. Aufgabe
Blatt 3/3
Szenario: Sie haben die iPhone/Powerpoint-Steuerung Ihren Kollegen gezeigt. Diese
sind von den neuen Möglichkeiten Powerpoint auch mit Fingereingabe zu bedienen
vollends begeistert und bitten Sie diese Funktionalität auch für einen Multitouch-Tisch
zu realisieren.
Starten Sie Squidy auf dem Multitouch-Tisch und passen Sie die für das
iPhone entwickelte Pipeline für den Multitouch-Tisch an.
Hier nochmals die gewünschten Funktionalitäten zur Erinnerung:
- Steuerung des Mauszeigers durch Bewegung eines Fingers auf
dem berührungssensitiven Tisch
- Zwei Finger: "Filzstift"-Modus zum Zeichnen auf Powerpoint-Folien
Hinweis: Löschen-Modus und Weiterschalten der Folien (Click) werden
erst in der nächsten Teilaufgabe realisiert und müssen noch nicht
funktionieren.
Im Gegensatz zum iPhone erkennt Ihr Multitouch-Tisch nicht selbstständig
kurze Finger-Kontakte als Klicks (bzw. sog. Kontakt-Gesten) und sendet
diese auch nicht als Buttons an Squidy. Fügen Sie diese Funktionalität
(Kontakt-Gesten) in Squidy ein, so dass Sie wie gehabt durch eine kurze
Berührung des Multitouch-Tisches die Folien in Powerpoint wie mit einen
Klick weiterschalten können.
Das Löschen von Zeichnungen in Squidy hatten Sie beim iPhone durch
Schütteln des Gerätes aktiviert. Am Multitouch-Tisch soll dies durch ein
spezielles „Token“ mit einem eindeutigen Marker auf der Rückseite
aktiviert werden. Sobald das Lösch-Token auf dem Multitouch-Tisch gelegt
wird, soll dieses erkannt werden und die Löschfunktion (Taste „L“) in
Powerpoint aktiviert werden.
Bitte bewerten Sie die Schwierigkeit dieser Aufgabe bevor
Sie mit der praktischen Lösung beginnen.
Die Aufgabe erscheint mir:
Sehr schwer
Sehr einfach
Bitte melden Sie sich umgehend bei Ihrem Testleiter
sobald Sie die Aufgabe erfüllt haben.
125
A.2. TASKS
Bitte bewerten Sie die Schwierigkeit dieser Aufgabe erneut
nachdem Sie mit der praktischen Lösung fertig sind.
Die Aufgabe empfand ich als:
Sehr schwer
Sehr einfach
126
APPENDIX A. EVALUATION DOCUMENTS
Wenn Probleme beim Lösen der Aufgabe
können Sie sich jederzeit an Ihren
wenden. Er wird Ihnen gerne helfen.
auftreten,
Testleiter
4. Aufgabe
Blatt 5/5
Szenario: Bisher waren die Einstellungen für den Multitouch-Tisch und dessen
Feedback nur digital über die Benutzeroberfläche von Squidy dem Anwender
zugänglich. Realisieren Sie physische Kontrollelemente mithilfe von Phidgets und
Squidy.
Realisieren Sie die Funktionalität, dass Sie die Pipeline für den MultitouchTisch in Squidy über einen Phidget Hardware-Button manuell starten und
stoppen können.
Nehmen sie einen physischen Slider und synchronisieren Sie dessen
Position mit dem virtuellen Slider für den Parameter „Pixel-Clock“ im
Multitouch-Knoten, so dass Sie direkt die Kamera-Einstellung mit dem
physischen Slider vornehmen können.
Geben Sie die aktuelle Framerate in FPS (Frames-per-Second) vom
Multitouch-Knoten auf dem Display des Phidget-InterfaceKits aus.
Integrieren Sie eine automatische Nachtabschaltung für den MultitouchTisch mithilfe eines Phidget Lichtsensors. Je nach aktueller Helligkeit des
Raumes soll die Multitouch-Pipeline automatisch gestoppt oder gestartet
werden (im Gegensatz zu der manuellen Schaltung mit dem HardwareButton).
Visualisieren Sie den aktuellen Status der Multitouch-Pipeline mithilfe einer
grünen und roten LED, welche am Phidget-InterfaceKit angeschlossen
sind. Aktivieren und deaktivieren Sie die LEDs entsprechend.
Bitte bewerten Sie die Schwierigkeit dieser Aufgabe bevor
Sie mit der praktischen Lösung beginnen.
Die Aufgabe erscheint mir:
Sehr schwer
Sehr einfach
Bitte melden Sie sich umgehend bei Ihrem Testleiter
sobald Sie die Aufgabe erfüllt haben.
127
A.2. TASKS
Bitte bewerten Sie die Schwierigkeit dieser Aufgabe erneut
nachdem Sie mit der praktischen Lösung fertig sind.
Die Aufgabe empfand ich als:
Sehr schwer
Sehr einfach
128
A.3
APPENDIX A. EVALUATION DOCUMENTS
Questionnaires
The following questionnaires were handed out to each participant of the evaluation. These
participants were able to rate Squidy’s support for a specific solved task, the concept of
semantic zooming, and the fun factor on a 5-point scale. Furthermore, a participant was
able express critique points or problems while employing the design environment.
129
A.3. QUESTIONNAIRES
AXX
Aufgabe X
Montag, 24.08.2009
Squidy Workshop '09
Fragebogen X
Liebe Teilnehmer,
bitte nehmen Sie sich wenige Minuten Zeit, um die unten aufgeführten Fragen
gemeinsam mit Ihrem Gruppenpartner zu beantworten. Sie leisten damit einen
entscheidenden Beitrag für die fortschreitende Weiterentwicklung und Verbesserung
von Squidy.
Vielen Dank für Ihre Hilfe.
1.
Bitte beschreiben Sie kurz wie Sie die eben absolvierte Aufgabe
ohne Squidy gelöst hätten.
Weiß ich nicht
Nicht lösbar
2.
Bitte bewerten Sie die Unterstützung zur Lösung der Aufgabe durch
Squidy.
Sehr gut
Sehr schlecht
3.
Bitte bewerten Sie wie Ihnen das Zoomkonzept gefallen hat.
Sehr gut
4.
Bitte bewerten Sie den Spaßfaktor, den Sie beim Bearbeiten der
Aufgabe mit Squidy hatten.
Sehr hoch
5.
Sehr schlecht
Sehr niedrig
Falls Sie Anregungen, Kritik oder Probleme bei der Nutzung hatten,
können Sie diese gerne hier vermerken. Sie können auch auf der
Rückseite weiterschreiben.
130
APPENDIX A. EVALUATION DOCUMENTS
Bibliography
[1] William B. Ackermann. Data flow languages. IEEE Comput. 15, pages 15–25, 1982.
[2] Christopher Ahlberg and Ben Shneiderman. The alphaslider: a compact and rapid
selector. In CHI ’94: Proceedings of the SIGCHI conference on Human factors in
computing systems, pages 365–371, New York, NY, USA, 1994. ACM Press.
[3] Georg Apitz and François Guimbretière. CrossY: a crossing-based drawing application. In UIST ’04: Proceedings of the 17th annual ACM symposium on User interface
software and technology, volume 24, pages 3–12, New York, NY, USA, July 2004.
ACM.
[4] Edward A. Ashcroft, Anthony A. Faustini, Rangaswamy Jagannathan, and
William W. Wadge. Multidimensional Programming. Oxford University Press, Inc.,
New York, NY, USA, 1995.
[5] Ed Baroth and Chris Hartsough. Visual programming in the real world. Visual
object-oriented programming: concepts and environments, pages 21–42, 1995.
[6] Benjamin B. Bederson, Meyer Jonatham, Bacon David, and George W. Furnas.
Pad++: A Zoomable Graphical Sketchpad For Exploring Alternate Interface Physics.
Journal of Visual Languages and Computing, 7(1):3–31, March 1995.
[7] Eric A. Bier, Maureen C. Stone, Ken Pier, William Buxton, and Tony D. DeRose.
Toolglass and magic lenses: the see-through interface. In SIGGRAPH ’93: Proceedings of the 20th annual conference on Computer graphics and interactive techniques,
number Mmm, pages 73–80, New York, NY, USA, 1993. ACM.
[8] Alan F. Blackwell, Kirsten N. Whitley, Judith Good, and Marian Petre. Cognitive
Factors in Programming with Diagrams. Artificial Intelligence Review, 15(1):95–114,
2001.
[9] Richard A. Bolt. “Put-that-there”: Voice and gesture at the graphics interface. In
SIGGRAPH ’80: Proceedings of the 7th annual conference on Computer graphics and
interactive techniques, pages 262–270, New York, New York, USA, 1980. ACM.
[10] Jullien Bouchet and Laurence Nigay. ICARE: a component-based approach for the
design and development of multimodal interfaces. In CHI ’04: CHI ’04 extended
abstracts on Human factors in computing systems, pages 1325–1328, New York, New
York, USA, 2004. ACM Press.
131
132
BIBLIOGRAPHY
[11] Jullien Bouchet, Laurence Nigay, and Thierry Ganille. ICARE software components
for rapidly developing multimodal interfaces. In ICARE software components for
rapidly developing multimodal interfaces, pages 251–258, New York, NY, USA, 2004.
ACM.
[12] Frank Buschmann, Regine Meunier, Hans Rohnert, Peter Sommerland, and Michael
Stal. Pattern - Oriented Software Architecture - A System of Patterns. John Wiley
& Sons, Inc., New York, NY, USA, 2 edition, 1996.
[13] Bill Buxton. Sketching User Experiences: Getting the Design Right and the Right
Design. Morgan Kaufmann, first edition, March 2007.
[14] William Buxton. Lexical and pragmatic considerations of input structures. ACM
SIGGRAPH Computer Graphics, 17(1):31–37, 1983.
[15] Stuart K. Card, Jock D. Mackinlay, and George G. Robertson. A morphological
analysis of the design space of input devices. ACM Transactions on Information
Systems, 9(2):99–122, 1991.
[16] Gery Casiez, Daniel Vogel, Ravin Balakrishnan, and Andy Cockburn. The Impact
of Control-Display Gain on User Performance in Pointing Tasks. Human-Computer
Interaction, 23(3):215–250, July 2008.
[17] Andy Cockburn, Amy Karlson, and Benjamin B. Bederson.
A review of
overview+detail, zooming, and focus+context interfaces. ACM Computing Surveys,
41(1):1–31, December 2008.
[18] Larry L. Constantine and Lucy A. D. Lockwood. Software for use: a practical guide
to the models and methods of usage-centered design. ACM Press/Addison-Wesley
Publishing Co., 8th printi edition, 1999.
[19] Deutsche Akkreditierungsstelle Technik. Leitfaden Usability, 2009.
[20] Pierre Dragicevic and J.D. Fekete. Input device selection and interaction configuration with ICON. In People and Computers XV Interaction without Frontiers: Joint
proceedings of IHM 2001 and HCI 2001 (IHM-HCI ’01), pages 543–558. Springer
Verlag, 2001.
[21] Pierre Dragicevic and Jean-Daniel Fekete. Support for input adaptability in the ICON
toolkit. In ICMI ’04: Proceedings of the 6th international conference on Multimodal
interfaces, pages 212–219, New York, NY, USA, 2004. ACM.
[22] Bruno Dumas, Denis Lalanne, and Sharon Oviatt. Multimodal Interfaces: A Survey
of Principles, Models and Frameworks. Human Machine Interaction, pages 3–26,
2009.
[23] Niklas Elmqvist, Nathalie Henry, Yann Ri He, and Jean-Daniel Fekete. Melange:
space folding for multi-focus interaction. In CHI ’08: Proceeding of the twenty-sixth
annual SIGCHI conference on Human factors in computing systems, pages 1333–1342,
New York, NY, USA, 2008. ACM.
BIBLIOGRAPHY
133
[24] Simon Fäh. Sprachsteuerung als Basis multimodaler Interaktion auf grossen, hochauflösenden Displays. Bachelor thesis, University of Konstanz, 2008.
[25] Stephanie Foehrenbach, Werner A. König, Jens Gerken, and Harald Reiterer. Tactile
feedback enhanced hand gesture interaction at large, high-resolution displays. Journal
of Visual Languages & Computing, 20(5):341–351, 2009.
[26] John D. Foley and Victor L. Wallace. The art of natural graphic man-machine conversation. ACM SIGGRAPH Computer Graphics, 8(3):87–87, September 1974.
[27] Thomas R. Green and Marian Petre. Usability Analysis of Visual Programming
Environments: A ’Cognitive Dimensions’ Framework. Journal of Visual Languages
and Computing, 7(2):131–174, June 1996.
[28] Yan Gu, B. S. Lee, and Wentong Cai. Evaluation of Java thread performance on two
different multithreaded kernels. SIGOPS Oper. Syst. Rev., 33(1):34–46, 1999.
[29] R. Harper, T. Rodden, Y. Rogers, and A. Sellen. Being human: Human-computer
interaction in the year 2020, 2008.
[30] Edwin Hutchins, James Hollan, and Donald Norman. Direct Manipulation Interfaces.
Human-Computer Interaction, 1(4):311–338, December 1985.
[31] Takeo Igarashi and Ken Hinckley. Speed-dependent automatic zooming for browsing
large documents. In UIST ’00: Proceedings of the 13th annual ACM symposium on
User interface software and technology, pages 139–148, New York, NY, USA, 2000.
[32] Robert J.K. Jacob, Audrey Girouard, Leanne M. Hirshfield, Michael S. Horn, Orit
Shaer, Erin Treacy Solovey, and Jamie Zigelbaum. Reality-based interaction: a framework for post-WIMP interfaces. In CHI ’08: Proceeding of the twenty-sixth annual
SIGCHI conference on Human factors in computing systems, pages 201–210, New
York, NY, USA, 2008. ACM.
[33] Ivar Jacobson. Object-Oriented Software Engineering: A Use Case Driven Approach.
Addison Wesley Longman Publishing Co., Inc., Redwood City, CA, USA, 2004.
[34] Hans-Christian Jetter, Jens Gerken, Werner A. König, and Harald Reiterer. HyperGrid Accessing Complex Information Spaces. In HCI UK 2005: People and Computers XIX - The Bigger Picture, Proceedings of the 19th British HCI Group Annual
Conference 2005, Edinburgh, UK, 2005. Springer Verlag.
[35] Wesley M. Johnston, J. R. Paul Hanna, and Richard J. Millar. Advances in dataflow
programming languages, March 2004.
[36] Susanne Jul and George W. Furnas. Critical zones in desert fog: aids to multiscale
navigation. In UIST ’98: Proceedings of the 11th annual ACM symposium on User
interface software and technology, pages 97–106, New York, NY, USA, 1998.
[37] Martin Kaltenbrunner. reacTIVision and TUIO: a tangible tabletop toolkit. In of the
ACM International Conference on, 2009.
134
BIBLIOGRAPHY
[38] Scott R. Klemmer, Jack Li, James Lin, and James A. Landay. Papier-Mâché: Toolkit
Support for Tangible Input. In CHI ’04: Proceedings of the SIGCHI conference on
Human factors in computing systems, pages 399–406, New York, NY, USA, 2004.
ACM.
[39] Werner A. König. Design and evaluation of novel input devices and interaction techniques for large, highâĂŘresolution displays. PhD thesis, Human-Computer Interaction Group, University of Konstanz, 2010.
[40] Werner A. König, Joachim Böttger, Nikolaus Völzow, and Harald Reiterer.
Laserpointer-Interaction between art and science. In IUI’08: Proceedings of the 13th
international conference on Intelligent User Interfaces, page 423, New York, 2008.
ACM Press.
[41] Werner A. König, Jens Gerken, Stefan Dierdorf, and Harald Reiterer. Adaptive
Pointing - Implicit Gain Adaptation for Absolute Pointing Devices. In CHI ’09:
Proceedings of the 27th international conference extended abstracts on Human factors
in computing systems, pages 4171–4176, New York, NY, USA, 2009. ACM.
[42] Werner A. König, Jens Gerken, Stefan Dierdorf, and Harald Reiterer. Adaptive
Pointing Design and Evaluation of a Precision Enhancing Technique for Absolute
Pointing Devices. In INTERACT 2009: Proceedings of the 12th IFIP International
Conference on Human-Computer Interaction, pages 658–671, Berlin, 2009. Springer
LNCS.
[43] Werner A. König, Roman Rädle, and Harald Reiterer. Squidy: A Zoomable Design
Environment for Natural User Interfaces. In CHI 2009 Extended Abstracts on Human
Factors in Computing Systems, New York, NY, USA, 2009. ACM.
[44] Werner A König, Roman Rädle, and Harald Reiterer. Interactive Design of Multimodal User Interfaces - Reducing technical and visual complexity. Journal on Multimodal User Interfaces, 3(3):197–213, February 2010.
[45] Jean-Yves Lionel Lawson, Ahmad-Amr Al-Akkad, Jean Vanderdonckt, and Benoit
Macq. An open source workbench for prototyping multimodal interactions based on
off-the-shelf heterogeneous components. In Symposium on Engineering Interactive
Computing Systems, pages 245–254, New York, NY, USA, 2009. ACM.
[46] Jean-yves Lionel Lawson, Jean Vanderdonckt, and Benoît Macq. Rapid Prototyping
of Multimodal Interactive Applications Based on Off-The-Shelf Heterogeneous Components. In UIST ’08: Proceedings of the 21th annual ACM symposium on User
interface software and technology, New York, NY, USA, 2008. ACM.
[47] Clayton Lewis and Gary Olson. Can principles of cognition lower the barriers to
programming? Empirical studies of programmers: second workshop, pages 248–263,
1987.
[48] Jonas Lowgren. Encyclopedia entry on Interaction Design, 2008.
BIBLIOGRAPHY
135
[49] I Scott MacKenzie. Input devices and interaction techniques for advanced computing.
pages 437–470, 1995.
[50] I. Scott MacKenzie and Colin Ware. Lag as a determinant of human performance in
interactive systems. ACM Press, New York, New York, USA, 1993.
[51] Jock D. Mackinlay, George G. Robertson, and Stuart K. Card. The perspective wall:
detail and context smoothly integrated. In CHI ’91: Proceedings of the SIGCHI
conference on Human factors in computing systems, pages 173–176, New York, NY,
USA, 1991. ACM.
[52] Svetlana Mansmann and Marc H. Scholl. Visual OLAP: a New Paradigm for Exploring Multidimensional Aggregates. In In Proceedings of the IADIS International
Conference on Computer Graphics and Visualization 2008, pages 59–66, Amsterdam,
Netherlands, 2008.
[53] Deborah J. Mayhew. The Usability Engineering Lifecycle: A Practitioner’s Handbook
for User Interface Design. Morgan Kaufmann, San Francisco, CA, 1999.
[54] Jochen Müsseler. Allgemeine Psychologie. Spektrum, Akad. Verlag, Heidelberg;
Berlin, 2002.
[55] Bilge Mutlu, Jodi Forlizzi, Illah Nourbakhsh, and Jessica Hodgins. The use of abstraction and motion in the design of social interfaces. In DIS ’06: Proceedings of
the 6th conference on Designing Interactive systems, pages 251–260, New York, NY,
USA, 2006. ACM.
[56] Brad Myers, S.E. Hudson, and Randy Pausch. Past, present, and future of user interface software tools. ACM Transactions on Computer-Human Interaction (TOCHI),
7(1):3–28, 2000.
[57] Brad A. Myers, Andrew J. Ko, and Margaret M. Burnett. Invited research overview:
end-user programming. In CHI ’06: CHI ’06 extended abstracts on Human factors in
computing systems, pages 75–80, New York, NY, USA, 2006. ACM.
[58] Laurence Nigay and Joëlle Coutaz. Multifeature systems: The CARE properties and
their impact on software design. In Intelligence and multimodality in multimedia
interfaces, number Nigay. AAAI Press, 1997.
[59] Ikujiro Nonaka and Hirotaka Takeuchi. Die Organisation des Wissens. Campus
Verlag, Frankfurt, 1997.
[60] Donald A. Norman. Natural User Interfaces Are Not Natural, 2010.
[61] Dan O’Sullivan and Igoe Tom. Physical Computing: sensing and controlling the
physical world with computers. Thompson, Boston, MA, USA, 2004.
[62] Rajeev K. Pandey and Margaret M. Burnett. Is It Easier to Write Matrix Manipulation Programs Visually or Textually? An Empirical Study. Technical report, Oregon
State University, Corvallis, OR, USA, 1993.
136
BIBLIOGRAPHY
[63] Ken Perlin and David Fox. Pad: an alternative approach to the computer interface.
In SIGGRAPH ’93: Proceedings of the 20th annual conference on Computer graphics
and interactive techniques, pages 57–64, New York, NY, USA, 1993. ACM.
[64] Roman Rädle. Entwicklung eines Frontends zur visuellen Exploration von OLAPDaten. Bachelor thesis, University of Konstanz, 2006.
[65] Roman Rädle. Criteria to Interaction Design Toolkits: Next Generation Interaction
Library, 2010.
[66] Roman Rädle. Squidy Interaction Library: A Practical Framework for Building postWIMP Interaction Techniques, 2010.
[67] Roman Rädle, Werner A. König, and Harald Reiterer. Temporal-Spatial Visualization
of Interaction Data for Visual Debugging. 2009.
[68] Dan Saffer. Designing Gestural Interfaces: Touchscreens and Interactive Devices.
O’Reilly Media, Sebastopol, november 2 edition, 2008.
[69] Douglas Schmidt, Michael Stal, Hans Rohnert, and Frank Buschmann. Patterns Oriented Software Architecture. John Wiley & Sons, Inc., New York, NY, USA, 2
edition, 2000.
[70] Jonas Schweizer. Gestaltung und Implementierung eines Multi-Fokus und MultiDisplay Management-Systems. Bachelor thesis, University of Konstanz, 2009.
[71] Marcos Serrano, Laurence Nigay, Jean-Yves L. Lawson, Andrew Ramsay, Roderick
Murray-Smith, and Sebastian Denef. The openinterface framework: a tool for multimodal interaction. In CHI ’08: CHI ’08 extended abstracts on Human factors in
computing systems, pages 3501–3506, New York, NY, USA, 2008. ACM.
[72] Ben Shneiderman. Direct Manipulation: A Step Beyond Programming Languages.
Computer, 16(8):57–69, August 1983.
[73] Barton A. Smith, Janet Ho, Wendy Ark, and Shumin Zhai. Hand eye coordination
patterns in target selection. In ETRA ’00: Proceedings of the 2000 symposium on Eye
tracking research & applications, pages 117–122, New York, New York, USA, 2000.
ACM Press.
[74] William R. Soukoreff and Scott I. MacKenzie. Towards a standard for pointing device
evaluation, perspectives on 27 years of Fitts’ law research in HCI. International
Journal of Human-Computer Studies, 61(6):751–789, December 2004.
[75] Stephen A. Stelting and Olav Maassen-Van Leeuwen. Applied Java Patterns. Prentice
Hall Professional Technical Reference, 2001.
[76] William R. Sutherland. The On-Line Graphical Specification of Computer Procedures.
PhD thesis, Massachusetts Institute of Technology, 1966.
[77] Brygg Ullmer and Hiroshi Ishii. Emerging frameworks for tangible user interfaces.
IBM Systems Journal, 39(3):915—-931, 2000.
BIBLIOGRAPHY
137
[78] Robert A. Virzi, Jeffrey L. Sokolov, and Demetrios Karis. Usability problem identification using both low- and high-fidelity prototypes. In Proceedings of the SIGCHI
conference on Human factors in computing systems common ground - CHI ’96, pages
236–243, New York, New York, USA, 1996. ACM Press.
[79] William W. Wadge and Edward A. Ashcroft. Lucid, the Dataflow Programming
Language. Academic Press, Inc., Orlando, FL, USA, 1985.
[80] Simon F. Wail and David Abramson. Can Dataflow Machines be Programmed with
an Imperative Language? In Advanced Topics in Dataflow Computing and Multithreading, 1995.
[81] Victor L. Wallace. The semantics of graphic input devices. ACM SIGGRAPH Computer Graphics, 10(1):61–65, May 1976.
[82] Jingtao Wang and Jennifer Mankoff. Theoretical and architectural support for input
device adaptation. ACM SIGCAPH Computers and the Physically, 73-74:85–92, 2002.
[83] Mark Weiser. The computer for the 21st century. ACM SIGMOBILE Mobile Computing and Communications Review, 3(3):3–11, 1999.
[84] Paul G. Whiting and Robert S. V. Pascoe. A History of Data-Flow Languages. IEEE
Ann. Hist. Comput., 16(4):38–59, 1994.
[85] Raphael Wimmer, Fabian Hennecke, Florian Schulz, Sebastian Boring, Andreas Butz,
and Heinrich Huß mann. Curve: Revisiting the Digital Desk. In To appear in Proceedings of the 6th Nordic Conference on Human-Computer Interaction (NordiCHI
2010), New York, NY, USA, 2010. ACM.
[86] Allison Woodruff, James Landay, and Michael Stonebraker. Goal-directed zoom. In
CHI ’98: CHI 98 conference summary on Human factors in computing systems, pages
305–306, New York, NY, USA, 1998. ACM.
[87] Anton Zeitler. Survey and Review of Input Libraries , Frameworks , and Toolkits
for Interactive Surfaces and Recommendations for the Squidy Interaction Library.
Diploma thesis, Ludwig-Maximilians-Universität München, 2009.