1
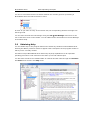
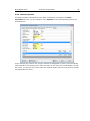
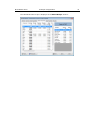
BATCHMAKER SUITE Example of Application 46 If you select a viscosity fixed point in the upper table the corresponding values are marked in the graphs. By using the mouse wheel or the context menu you can enlarge or reduce the visible diagram area. To pan the diagram hold down the right mouse button and move the mouse. Select the Standard view command from the context menu to return to the original scale. Click the Report button to display the data as a report. NOTE: If you want to save the report, including the viscosity curve, select Web Archive, single file (*.mht) as file type.