1
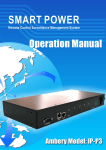
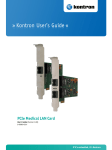
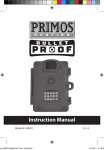
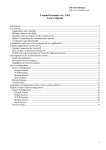
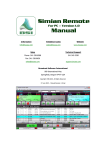
Table of Content 1. Product Introduction 1 1-1 APPLICATIONS 1 1-2 POWER MONITORING DIAGRAM 1 1-3 PRODUCTION FEATURES 2 1-4 CONTROL AND INDICATORS 3 1-5 SPECIFICATIONS 4 1-6 HARDWARE INSTALLATION 4 1-7 PACKAGE CONTENTS 5 2. Web Operation 6 2-1 SYSTEM LOGIN 6 2-2 NETWORK 8 2-3 TIMESYNC TAB 10 2-4 MONITOR TAB 12 2-4-1 WARNING POWER SETUP 12 3. Advanced Setup 13 3-1 MONITOR TAB 13 3-1-1 WARNING POWER SETUP 13 3-1-2 WARNING TEMPERATURE/HUMIDITY SETUP 14 3-1-3 DRY CONTACT INPUT SETUP 14 3-1-4 DRY CONTACT OUTPUT OPERATION 15 3-1-5 DRY CONTACT OUTPUT SETUP 15 3-1-6 TEMPERATUREMONITOR 16 3-1-7 HUMIDITY MONITOR 16 3-1-8 RFID 17 3-2 SYSTEM TAB 17 3-2-1 NETWORK 18 3-2-2 MAIL SERVER 19 3-2-3 SMS SERVER 20 3-2-4 SNMP/SYSLOG 21 3-3 FIREWALL TAB 21 3-3-1 IP FILTER 22 3-3-2 MAC FILTER 22 3-4 ACCOUNT TAB 23 -i- 3-4-1 CREATE NEW ACCOUNT 23 3-4-2 DELETE ACCOUNT 23 3-5 TIMESYNC TAB 24 3-6 EVENT TAB 25 APPENDIX A: LED PANEL SCREEN & DRY CONTACTS 26 APPENDIX B: RESET PDU MONITOR SERVER 28 - ii - 1. Product Introduction Traditional PDU can not measure and indicate the power load/current to MIS system administrators. IT staff usually can not take preventative measures before power overload events until the power supply suddenly is cut off. Unexpected power loss may damage devices and data rooms and cause great loss to companies. For this reason, our PDU Monitor Server unit offers the best solution to integrate functions of power current monitoring, rack door control with detection of the environment temperature/humidity plus supply of 1 Dry Contact Input (DI) and 4 Dry Contact Outputs (DO). By building centralized power control for power equipments, this remote power distribution server unit helps administrators control network devices in data rooms or power equipments from different locations and saves companies money as technical personnel can cover larger areas and multiple remote locations without wasting time on traveling. 1-1 Applications Monitor/manage the data centers, server rooms and equipment room. Intelligent power management of data center equipments. Monitoring and management of the wireless LAN access point. Networking equipment management and monitoring. Other power equipment management and monitoring. 1-2 Power Distribution Monitor Setup Diagram -1- 1-3 Product Features Professional IP-addressable power distribution unit with built-in web server. A new way to monitor and control power supplies to remote equipments via local network or internet without the presence of IT personnel. Real-time monitoring of total amperage draw and site temperature/humidity through the optional environmental sensor probe and current meter. Instant local monitoring or remote monitoring of all connected PDUs and device power consumption via LAN or internet. Each PDU monitor server unit can work with up to 8 PDU salve units cascaded together. Hot swappable without interfering the PDU power distribution. Complete power control via web, local terminal or push button on the switch. Featured with 1 Dry contact input and 4 dry contact outputs for monitoring dry contact closures and dry contact sensors such as cabinet door sensor, smoke, water, leakage, intrusion, gas and motion. LCD front panel screen with built-in true RMS current meter for on-site viewing of equipment currents through cyclical or individual display. Easy LED displays for power consumption, mode indication Auto circuit breaker protection when current overload happened. Supports both Http and Https secure protocols to manage power conditions of all connected power distribution units. Intuitive web control panel with programmable warning value setup for central power control and management. IP security masks help manage user privileges and prevent unauthorized access to the control menu through the network. Supports multi-users access management with secure password system to prevent unauthorized access. Built-in audible alarm buzzer will be triggered for indication of the system overload when the power consumption exceeds the preset warning value. The LCD screen will start flashing alternatively in red and blue lights to alert the local administrator for warning of power overload. Event warning alert function by sending out email, SMS text message or SNMP TRAP to notify authorized personnel. Supports RFID card reader and can detect the motion movement of rack door to prevent unauthorized personnel from opening the door. Maintains system logs of power operation events from all ports, message and abnormal current message for reviews by system administrator. Supports API interface to allow users to develop their own program to do remote power monitoring. -2- 1-4 Control and Indicators 1 Front LCD Panel Screen. When back light of LCD panel is in blue, it will display reading of the present current, temperature and humidity. When warning is triggered, the panel will flash blue and red lights by turns. 2 Circle push button for displaying power conditions and reading of external temperature and humidity data. Push this button to examine each port's current condition, temperature, and humidity. 3 Setup button for setting up the warning threshold value and displaying the power current peak value when event occurred. Push this button to examine present temperature and humidity. 4 4 Dry Contact Outputs. Each output can afford 220V/10A 5 Dry Contact Input. This Dry contact input can be used to detect if a cabinet door is closed or not. 6 RJ11 ports for connecting with metered PDU slave units. Each Monitor Server can connect up to total of 8 metered PDU units. 7 RJ11 port for plug-in of the temperature and humidity sensor 8 RJ11 port for connecting with RFID devices such as Card Reader for RFID access control 9 RJ45 Ethernet port for network connection -3- 1-5 Specifications Power Input/Output Voltage 85~264VAC 47~63Hz Power Source Frequency 50 - 60 HZ Current Meter Type Digital True RMS Current Meter Connection Ports Front Panel RJ11 x 8 For PDU RJ11 x 1 For ENV Sensor RJ11 x 1 For RFID RJ45 x 1 For Ethernet LAN Dry Contact Input x 1 Dry Contact Output x 4 LED Panel Screen Circle Push Button Setup Push Button Event Alert Email, SNMP Trap, Audible Alarm Operating Temperature 0 – 60 degrees C Rack Size 19” Standard 1U Rack Net Dimension 13”(W) x 6”(D) x 1.7”( H) Net Weight 4.0 lbs Max Power Consumption 7W 1-6 Hardware Installation -4- 1-7 Package Contents PDU Server Unit User Manual CD Disc RJ11 Cable x 8 Rack Mount Kit x 1 Power Cord x 1 -5- 2. Web Operation In this chapter, you will know how to quickly configure this unit for network and set up the system time and warning value for power overload events. 2-1 System Login ① Open a new web browser and then enter the default IP address of the PDU server unit, http://192.168.1.10, on the URL link. ② Enter the default Account name and password in each column. Both values are “admin” for user name and password for the beginning use. NOTE: The account name and the password are case sensitive and must be entered in lower case. -6- ③You will log into the control panel screen if you have entered the correct account name and password. -7- 2-2 Network This PDU Monitor server unit can be configured with any static IP address if available. The manufacturer default settings for the IP address are as follows: IP address: 192.168.1.10 Subnet mask: 255.255.255.0 Gateway address: 192.168.1.1 Network Setup IP Address: Enter the IP address. Subnet Mask: Enter the Subnet Mask. Gateway: Enter the Gateway address. Note: Smart Monitor only can be configured with static IP. If you use Dial-up Networking for connection, please share the IP through IP sharing devices. Domain Name Server Setup DNS Server 1: Enter your primary DNS server (optional). DNS Server 2: Enter your secondary DNS server (optional). Note: If you do not know your DNS server address, please check it from -8- Windows O/S by these steps: Go to START>ALL PROGRAMS>ACCESSORIES>COMMAND PROCESSOR>Please enter: C:\>nslookup>Get DNS Server Address. Web Server Setup Http Port: Assign the desired HTTP port (default port number is 80) for connecting the PDU server unit via a web browser. The HTTP port can be changed if needed. For example: If port 8080 is preferred, user may change the port number from here so the new IP address for this PDU monitoring server unit will be http://192.168.1.10:8080 API Port: The Application Program Interface Port allows users to interface and control this server unit with their own application program. Save: Once the setup is completed, click the Save button to save all of the changes. -9- 2-3 Time Sync Tab This PDU Monitoring server will display the system time in 24-hour format and the time display for the event logs will be recorded in this format as well. After successfully logging into the PDU server unit, user can click on the [Time Sync] tab from the web control panel screen and synchronize the system time of the PDU server unit and the local computer. Equipment Date: Displays the date. This field is not editable. Equipment Time: Displays the time in 24-hour format. This field is not editable. Three selectable ways for setting up the system time: Sync with PC: Check the “Sync with PC” button to synchronize Smart Monitor’s date and time with the PC. PC Date: The current PC system date. PC Time: The current PC system time. Sync with NTP Server: Check the “Sync with NTP Server” button to sync up the system time of the Smart Monitor’s date and time with a NTP server. NTP Server Address: There is a list of some of the available NTP servers. Select the desired NTP server and then click “Save”. If your desired NTP sever is not on the list, click on “New” button and then enter the NTP server address, then click OK. Manual Setup: Check the Manual Setup button to manually setup the date and time. Save: Once the setup is complete click the Save button to save all of the changes. - 10 - 2-4 Monitor Tab In “Monitor” Tab, authorized users can easily set up the warning current value and the triggered response for each Dry Contact Output. 2-4-1 Warning Power Setup Move cursor to [Warning (Amp)] of each port and enter numbers. Mark [Monitor] to enable power and link status monitoring. Once the setup is complete click the Save button to save all of the changes. - 11 - 3. Advanced Setup This chapter introduces the operations of Power Monitor, System Setup, Firewall Setup, Account Management, Time Sync, Event Log, and Firmware Upgrade. 3-1 Monitor Tab In this section, user will know how to set up warning power value, warning time of dry contact input, and the settings of dry contact output such as basic info, temperature, humidity, and RFID. 3-1-1 Warning Power Setup User can see Power Status, Current (Amp), Warning (Amp) and Monitor, four reading for each of the 8 ports used for PDU slave unit. Color For Status Light: On Warning No Power Current (Amp): Total power consumption. Warning (Amp): Set up warning power value. The value will be saved simultaneously to the PDU. Monitor: Check [Monitor] box when a metered PDU is connected with the port. Note: Please do not check this selection if the port has no connection with Metered PDU otherwise this server Monitor will assume the connection, resulting in abnormal operation and triggering buzzer by mistake too. - 12 - 3-1-2 Warning Temperature and Humidity Setup Monitor: Mark [Monitor] square when sensor is connected. Note: Please do not check this option if no external sensor probes are connected with the smart monitor; otherwise this server unit will assume the sensor plug-in ,resulting abnormal operation and triggering the buzzer for false alarm. Temperature: Display detected temperature from sensor. NULL represents disconnected with sensor. Warning Temperature: Enter warning value for temperature reading. Humidity: Display the detected humidity reading from sensor. NULL represents disconnected with sensor. Warning Humidity: Enter warning value for humidity reading. 3-1-3 Dry Contact Input Setup Button Illustration: On Warning Rack door still remains open Over Time Warning: Warning will be triggered when dry contact input switch status (e.g. ON) is different from preset switch status (e.g. OFF) lasting than this setup time. Preset Switch: Select “Always ON” or “Always OFF” from this session according to the power status of connected device. - 13 - 3-1-4 Dry Contact Output Operation Each dry contact output offers Setup, On, Off, and Connected Device Description. Button Illustration: ON OFF 3-1-5 Dry Contact Output Setup Description: Name the equipment connected to the outlet. Power-On Delay Time: Set up the delay time when turning on power. Power-Off Delay Time: Set up the delay time when turning off power. Preset: Dry contact output switch status when rebooting the power of this PSD Monitoring Server unit. - 14 - 3-1-6 Temperature Monitor When reaching the temperature warning value, switch dry contact output on/off. Power off Temperature: When reaching the preset temperature warning value and lasting for the preset period of time, the dry contact output will be switched off. Lasting Time: Set up the max time period allowed for unusual temp events. When high temperature events occur and continue over this preset time period, the dry contact output will be switched off. Power-on Temperature: When temperature goes down to this setup value, the dry contact output value will be switched on. 3-1-7 Humidity Monitor When reach humidity setup value, switch dry contact output on or off. Power off Humidity: When reaching the preset humidity warning value and lasting for the preset period of time, the dry contact output will be switched off. Lasting Time: Set up the maximum time period allowed for unusual humidity events. When high humidity events occur and continue over this preset time period, the dry contact output will be switched off. Power on Humidity: When the humidity from the environment goes down to this setup value, the dry contact output value will be switched on. - 15 - 3-1-8 RFID Authorize card number to control dry contact switch. Card Number: Authorized RFID card number for controlling the dry contact output. Switching Time: When card number is detected, dry contact output status will be converted and continues to last for the preset time. (If preset dry contact output is OFF, it will be converted into ON and last for the time period set up in the system. When the time expires, the dry contact output will revert back to OFF status.) Delete: Double-click the delete icon to delete card number. - 16 - 3-2 System Tab In this tab, user can set up related information about the network data, mail server, and SMS server. 3-2-1 Network Smart Monitor can be configured with a Static IP address or setup to use DHCP. The default settings are: Static IP address IP address: 192.168.1.10 Gateway address: 192.168.1.1 Subnet mask: 255.255.255.0 IP Address: Enter the IP address. Subnet Mask: Enter the Subnet Mask. Gateway: Enter the Gateway address. DNS Server 1: Enter your primary DNS server (if required). DNS Server 2: Enter your secondary DNS server (if required). Http Port: Assign the desired HTTP port (default is port 80) for connecting to Smart Monitor via a web browser. The HTTP port can be changed if so desired. An example would be HTTP port 8080. Enter the IP address followed by the new HTTP port (http://192.168.1.10:8080). API Port: The Application Program Interface Port allows the user to interface and access related power data include working temperature and humidity of Smart Monitor with their own application program. Save: Once the setup is complete click the Save button to save all of the changes. - 17 - 3-2-2 Mail Server This menu allows the administrator to configure the email setting to send notifications once an event has occurred. Server IP Address: Enter the IP address of your mail server here for the Smart Monitor to send out the alert emails and warning messages via Web. Connect Port: Enter the port number for the mail server. The default port is 25. Sender Mail Address: This must be a legitimate email address. Mail Subject: When a power overload event occurs, Smart Monitor will send an email notification. The subject line here can be set up for easy identification of the device with problems. SMTP Auth: Check this box if the Mail Server requires authentication to send emails. SMTP Account: Enter the account name if SMTP authentication is required. SMTP Password: Enter the password if SMTP authentication is required. - 18 - 3-2-3 SMS Server This menu allows the administrator to configure the SMS setup in order to send out notifications once an event has occurred. Server Address: Enter the SMS server address. Port: Enter the port number for the SMS server. The default value is 2500. Equipment Name: When an event occurs, the smart monitor will send a SMS notification. The equipment name will help administrator identify the device with ease. Account: Enter the account name if required. Password: Enter the password if required. Send SMS: Check this box if SMS Server requires authentication to send messages. SMS Test: This is used to verify that the SMS works properly. Save: Once the setup is complete, click the Save button to save all the changes made. - 19 - 3-2-4 SNMP/SysLog System Name: Enter the name of the SNMP device. System Contact: Enter the name of the System Administrator. System Location: Enter the location of the SNMP device. Receiver IP Address: IP Address of the NMS of where the Traps should be sent. Receiver Port: The port to be used to receive the Traps. The default value is 162. Community: Low-level password of the associated IP address with the access type set by the administrator. Enabled: Enable the SNMP Traps to be sent. SNMP Test: This is used to verify that the Trap notification works properly. Syslog Server Address: The IP Address of the Server to which the System Logs should be sent. Syslog Server Port: The port that will be used to receive the System Logs. The default value is 514. Enabled: Enable the System Logs to be sent. SYSLOG Test: This is used to verify that the SYSLOG works properly. Save: Once the setup is complete click the Save button to save all of the changes. - 20 - 3-2-5 Other This menu allows the administrator to set switch on/off of dry contact output and overtime operation. Dry Contact Output Reboot: Set dry contact output switch selection as open on monitor page. Overtime Operation (min): Set limited operation time. System will log out automatically when over this time set. Reboot Device: Selecting this option will immediately reboot the outlets. Save: Once the setup is complete click the Save button to save all of the changes. 3-3 Firewall Tab Enter Firewall page to do the setup for IP and MAC IP Filter. User can authorize the range of IP address for operating. 3-3-1 IP Filter Enable IP Filter: This function is used for controlling authorized IP address to access this device. - 21 - Allow IP Address: The first three subsets of the authorized IP address format are entered here. The 4th or the last section of this column is for setting up the IP address range. Only users with the matching IP address formats can be given specific rights to access the Smart Monitor. Example to authorize the IP ranges of 192.168.1.100 to 192.168.1.200 for access, enter 192.168.1.100 in the first four sections and then enter “200” in the last section. The default IP address range is the IP address of the local computer that you initially use to access the Smart Monitor. ADD: Click the ADD button to add this action. Delete: To delete the selected IP address to be removed, click on the “X”. Save: Once the setup is complete click the Save button to save all of the changes. 3-3-2 MAC Filter Enable MAC Filter: Allow authorized MAC address to access this device. Allow MAC Address: The administrator can give specific rights to certain users to access Smart Monitor. Enter the MAC address of the user that you want to have access to Smart Monitor. The default MAC address is the MAC address of the computer that you initially use to setup Smart Monitor. ADD: Click the ADD button to add this action. Delete: To delete a specific MAC address click on the “X”. Save: Once the setup is complete click the Save button to save all of the changes. - 22 - 3-4 Account Tab This menu allows the administrator to set up 2 sets (max) of authorized user accounts. 3-4-1 Create New Account Account: Set up the authorized user id for accessing this unit. Password: Enter the password for each authorized user account. Cell phone: Enter the contact phone number of each authorized user for receiving the SMS text message once an event has occurred. This is optional and applicable only when a SMS server is used. Mail Address: Enter the contact email address of each authorized user for receiving the email notification once an event has occurred. Save: Once the setup is complete click the Save button to save all of the changes. 3-4-2 Delete Account Check the “delete” box. Click he “Delete” button to delete this user account. Press the Save button to save the changes made. - 23 - 3-5 TimeSync Tab This Menu allows the administrator to set the date and time for Smart Monitor. Equipment Date: Displays the date. This field is not editable. Equipment Time: Displays the time in 24-hour format. This field is not editable. Sync with PC: Check the Sync with PC button to synchronize Smart Monitor’s date and time with the PC. PC Date: The current PC system date. PC Time: The current PC system time. Sync with NTP Server: Check the Sync with NTP Server button to synchronize Smart Monitor’s date and time with a NTP server. NTP Server Address: There is a list of other NTP servers. Select the desired NTP server and then click Save. If your desired NTP server is not on the list, click on the New button and then enter the NTP server address, then click OK. Manual Setup: Check the Manual setup button to set up the date/time manually. Time Zone Setup: Defined by Greenwich. Please adjust the time to be the same with user’s local area. - 24 - 3-6 Event Tab This menu displays the events that have occurred with Smart Monitor. Refresh: Click on the Refresh button to refresh the screen. Download: Click on the Download button to save the event log information. The event log is saved in .txt format. Delete: Click on the Delete button to delete the Event logs. - 25 - APPENDIX A: LED PANEL SCREEN & DRY CONTACTS Local Monitoring This intelligent PDU monitoring server unit is featured with local LED screen display for the reading of total input current, temperature and humidity from the surrounding environment. When back light of LCD panel is in blue, it will display reading of the present current, temperature and humidity. When warning is triggered, the LCD screen will start flashing alternatively in red and blue LED lights to alert the local administrator for warning of power overload. There are two manual push buttons on the front panel of this power distribution server unit: Circle push button for displaying power conditions and reading of external temperature and humidity data. Push this button to examine each port's current condition, temperature and humidity. Setup push button for setting up the warning threshold value and displaying the power current peak value when event occurred. Push this button to examine the current temperature and humidity levels. - 26 - Dry Contact This PDU monitor server unit also provides 4 wire dry contact ports to monitor dry contact closures and dry contact sensors such as cabinet door on/off, smoke, water, leakage, intrusion, gas and motion. The 2-wire dry contact ports are easy to use and allow you to make your own dry contact cables quickly and easily. - 27 - APPENDIX B: Reset PDU Server Monitor To Default If you forgot the password and/or the user name for getting into the Smart Monitor , at any time you may reset this unit to revert back to the manufacturer’s default setting for the user name and password. However all other system settings will remain unchanged and still kept in the server. The Reset button is located in the small pinhole next to the Reset indicating light. Use a pointed object like a paper clip to insert into this pinhole. Gently push and hold the reset button for at least 3 to 5 seconds, then release the Reset button. The IP address will be reset back to 192.168.1.10 The user name and password will be reset back to admin. - 28 -