1
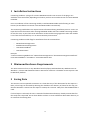
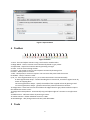
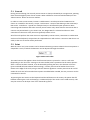
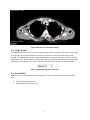
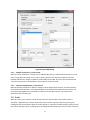
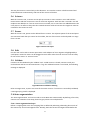
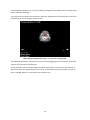
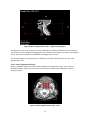
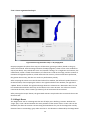
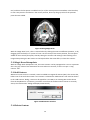
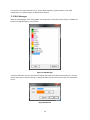
Fratoria BV
Westewagenstraat 60
3011AT Rotterdam
The Netherlands
Email: [email protected]
Web: www.fratoria.com
User Manual for Contouring
October 2011
Contents
1
Installation Instructions .................................................................................................................. 4
2
Minimum Hardware Requirements ................................................................................................ 4
3
Saving Data...................................................................................................................................... 4
4
Toolbar ............................................................................................................................................ 5
5
Tools................................................................................................................................................ 5
5.1
General.................................................................................................................................... 6
5.2
Paint ........................................................................................................................................ 6
5.3
Magic Wand ............................................................................................................................ 7
5.4
Expand ROI .............................................................................................................................. 7
5.4.1
Simple Expansion / Contraction...................................................................................... 8
5.4.2
Advanced Expansion / Contraction................................................................................. 8
5.5
Scale ........................................................................................................................................ 8
5.6
Scissors.................................................................................................................................... 9
5.7
Eraser ...................................................................................................................................... 9
5.8
Edit .......................................................................................................................................... 9
5.9
Validate ................................................................................................................................... 9
5.10
Auto segmentation ................................................................................................................. 9
5.10.1
Auto segmentation Step1 ............................................................................................... 9
5.10.2
Auto segmentation Step2 ............................................................................................. 11
5.10.3
Auto segmentation Step3 ............................................................................................. 12
5.11
Magic Draw ........................................................................................................................... 12
5.12
Magic Draw Extrapolate........................................................................................................ 13
5.13
Add Contour.......................................................................................................................... 13
5.14
Delete Contour...................................................................................................................... 13
5.15
ROI Manager ......................................................................................................................... 14
2
Device description
Fratoria DICOM RT Studio is a software toolbox for advanced radiotherapy viewing, analysis and
contouring based on DICOM and DICOM RT. It allows the user to read all relevant radiotherapy data,
including images, plans, dose, ROIs/POIs and RT images, view this data interactively in 2D/3D/4D and
evaluate plans. This manual covers the contouring module that is available as a plug in and allows
the users to do contouring and save the result as DICOM RT structure for use by other systems in the
delivery of treatment to a patient.
Fratoria DICOM RT Studio runs as a stand alone application on Microsoft Windows platform. The
contouring module requires Fratoria DICOM RT Studio to be installed on your workstation.
Intended use
The contouring module is for the purposes of creating patient treatment plans in radiotherapy
Treatment Planning Systems with the contouring data generated and exported by this module.
Intended audience
This manual is written for radiation oncology professionals and for Fratoria software (service)
engineers. You should make sure that you have thoroughly read and completely understand the
manuals and release notes that are delivered with the software.
If you suspect that the system does not operate according to this manual, discontinue its use and
contact Fratoria customer support by email via [email protected].
CE Marking
Fratoria DICOM RT Studio is CE market to the Medical Device Directive 93/42/EEC.
Disclaimer
All rights reserved ©2011: Fratoria BV
All the information in this document is intellectual property of Fratoria BV.
The content of this document may not be reproduced or published without written permission from
Fratoria BV.
3
1 Installation Instructions
Contouring module is a plug in for Fratoria DICOM RT Studio. Two versions of the plug in are
available: 32 bit and 64 bit, depending on whether you have 32 or 64 bit version of Fratoria DICOM
RT Studio.
Prior to installation of the Contouring module, install DICOM RT Studio with a floating or static
license (see installation instruction in the DICOM RT Studio User Manual).
The Contouring module does not require license information during installation process. A user can
input the license information when starting DICOM RT Studio with the installed Contouring module
for the first time, or pass the license information to the installer using arguments when the installer
is run from the command line, or in an Active Directory environment.
Contouring module installer flags for installation from the command line:
NetworkContouringLicense
StandaloneContouringLicense
LicenseServerAddress
LicenseServerPort
Example:
"Fratoria Contouring Module.msi" NetworkContouringLicense="abc123ContouringLicenseInfo123"
LicenseServerAddress="192.168.0.1" LicenseServerPort=556
2 Minimum Hardware Requirements
The 32 bit version will run on any Windows based PC/laptop with Windows XP, Windows Vista or
Windows 7, at least 1GB of RAM and 1024 x 768 screen resolution. The 64 bit version requires a 64
bit Windows platform.
3 Saving Data
The contours can be exported to a PACS or to a local directory. If the destination for the export is a
PACS, a local copy can be saved by selecting the checkbox. The directory of choice for the copy can
then be selected or created. For the export to a PACS, the ‘storescu’ utility from the DICOM toolkit is
used.
If a local export is selected, the user is warned if the destination directory already contains data for
the study that is exported. He can then decide to select or create a different destination directory or
to overwrite the existing data.
4
Figure 1 Export Dataset
4 Toolbar
1 2
3
4
5
6
9 10 11 12 13 14 15 16
7 8
Figure 2 Toolbar
1: Paint draw and adjust contours using a circle with a variable radius.
2: Magic Wand create a contour in 2D automatically based on gray values.
3: Expand ROI expand and contract ROIs by providing a margin.
4: Scale scale or move existing contour.
5: Scissors cut contour in two or more separate contours by drawing a line.
6: Eraser delete points in contour.
7: Edit show points in contour as squares. You can move the points with the mouse.
8: Validate verify if contour is valid.
9, 10, 11: Auto segmentation step 1, 2, 3 to create 3D contours semi automatically.
9: Auto segmentation Step 1 Define bounding box in transversal, coronal en sagittal views by
means of cropping filter.
10: Auto segmentation Step 2 specify the middle of the cropped volume by placing a seed.
11: Auto segmentation Step 3 generate 3D surface preview and extract contours.
12: Magic Draw draw free form line that follows the edges based on gray values inside the square
that follows the mouse cursor.
13: Magic Draw Extrapolation automatically copy and adjust edges of a contour on next/previous
slice.
14: Add Contour add new contour by entering its name.
15: Delete Contour delete individual contour in a ROI.
16: ROI Manager edit (change name and color) and delete ROIs.
5 Tools
5
5.1 General
During contour editing, the currently active contour is always indicated by an orange arrow, pointing
down from the highest point of that contour. When a different contour should be edited, use the
‘Select Contour’ button in the main toolbar.
In order to create a new contour, button 14 ‘Add Contour’ must be pressed and a ROI must be
chosen or created for the contour, see par. ’Add Contour’. Contours that belong to the same ROI (a
ROI can be and often is spread over multiple slices) are all affected by ROI operations. Most
contouring tools however affect the currently active contour only. Note that this means that after a
contour was painted with e.g. the ‘Paint’ tool, the ‘Magic Wand’ is selected and the user clicks
somewhere in the active view, the active (painted) contour is lost.
All of the tools perform the action that was requested by mouse actions, sometimes in combination
with use of the keyboard, except when the requested action will result in a contour or ROI that is not
valid; in that case no action will be performed.
5.2 Paint
With the ‘Paint’ tool, new contours can be drawn and existing contours edited. The mouse pointer is
shaped like a circle, of which the diameter can be adjusted through the toolbar:
Figure 3 Paint tool radius
The initial contour that appears when the left mouse button is pressed in a view is a red circle
(depending on the ‘line color’ settings in the main toolbar) that is positioned at the mouse pointer.
After a contour has been created, it can be altered by pushing the line in the direction of choice
(press and hold left mouse button while moving). Contour points that fall within the circle are
drawn to the edge of the circle, using a shortest distance algorithm. Contour points that do not fall
within the circle are left untouched. Extra points are added when needed; this way a contour can be
customized as seen fit.
By pressing the ALT button on the keyboard and the left button on the mouse, the points that fall
between entering the circle and leaving it, are deleted (only if the result is still a valid contour). This
way the contour can be kept ‘clean’ from cluttered up points.
6
Figure 4 Result of pain tool on CT image
5.3 Magic Wand
The ‘Magic Wand’ tool creates a contour automatically, based on the gray scale values in the image,
at the position that was clicked with the mouse. It scans the environment around the clicked
position, and expands the area until a significant difference in gray scale values is found. Using the
‘Magic Wand’ tool, bony structures or tissue parts are easily marked. The tolerance for the gradient
that is used in the algorithm can be set with the spin control in the toolbar, as indicated below.
Figure 5 Magic Wand gradient tolerance
5.4 Expand ROI
Expand or contract a ROI with a specified margin. Two types of expansion/contraction currently
exist:
Simple expansion/contraction
Advanced extraction/contraction
7
Figure 6 Expand ROI dialog
5.4.1 Simple Expansion / Contraction
With the simple expansion, a margin can be added (expansion) or subtracted (contraction) to resp.
from a single ROI. The margin that is input is always positive; the selection ‘Expand’/’Contract’
indicates whether the margin is added or subtracted from the ROI. Of course the destination ROI
name has to be given so the application knows where to put the result.
5.4.2 Advanced Expansion / Contraction
With the advanced expansion, different margins can be applied for the lateral, anterior/posterior
and cranial/caudal directions. Also, Multiple ROIs can be selected for expansion/contraction, and
(multiple) limiting ROIS can be selected to influence the new ROI creation. The name of the
destination ROI must be input.
5.5 Scale
With the ‘Scale’ tool a contour can be moved around or resized. When the toolbar button is
activated, a light blue box is drawn around the active contour. Moving is done by pressing and
holding the left mouse button while the mouse pointer is somewhere inside the box, and then move
the mouse. Resizing is done by sliding (press and hold left mouse button) one of the sides of the box.
8
This way the contour is resized only in that direction. To resize the contour in both horizontal and
vertical direction simultaneously, slide one of the corners of the box.
5.6 Scissors
With the ‘Scissors’ tool, a contour can be split up into two or more contours. Press and hold the
mouse button and then move across two or more line segments. Each line that is crossed is cut and
endpoints are added to it. If two or more lines are crossed, one or more lines are added between the
cross points in an effort to keep the thus created contours valid. At least two line segments must be
crossed for the scissors to work.
5.7 Eraser
With the ‘Eraser’ tool, points can be deleted from a contour. The adjacent points of the erased point
are connected. With the spin control in the toolbar, the size of the eraser can be adjusted in a range
from 5 to 100.
Figure 7 Eraser size input
5.8 Edit
Use the ‘Edit’ tool to edit a contour point wise. Each endpoint of a line segment is highlighted by a
small square around it. Points can be dragged to move them. Also the ‘Edit’ tool can come in handy
for use of the ‘Eraser’ or ‘Connect’ tools.
5.9 Validate
Contours can be validated by the ‘Validate’ tool. A valid contour is closed, contains exactly one
enclosed area and has no self intersections. If e.g. the validated contour is not closed, the following
message is displayed:
Figure 8 Contour validation warning
Other messages exist, to point out issues of the active contour. If a contour is successfully validated,
a message saying ‘Valid’ is displayed.
5.10 Auto segmentation
The ‘Auto segmentation’ tool can be used to create ROIs semi automatically. By defining a few rules,
contours are created in three steps, based on grey values over multiple slices.
5.10.1 Auto segmentation Step1
Define a cropping filter in 3D. This cropping filter is defined by indicating a bounding box in each of
the transversal, coronal and sagittal views. Actually, both the coronal and sagittal views define the
9
same boundaries (Z direction), so if the boundary is changed in the coronal view, the sagittal view
will be updated accordingly.
The transversal view defines the surface on which the segmentation is performed per slice. This is
indicated by the red rectangular shape like this:
Figure 9 Auto segmentation step 1 transversal cropping filter
The red rectangle defining the surface can be resized by dragging (click and hold) one of the little
squares on the inside of its boundaries.
As said, both the coronal and the sagittal view define the distance in Z direction (the number of
slices) over which the segmentation is to be done. As they define the same variable, only one of
them is needed. Below is an example of this (sagittal view).
10
Figure 10 Auto segmentation step 1 sagittal cropping filter
The distance in Z direction (number of slices) is defined by the distance between the two red lines.
This distance can be changed by dragging (click and hold) the red triangles up or down. If the sagittal
view is altered, the coronal view is updated accordingly and vice versa.
The 3D view displays the 3D volume that is defined by the above described step 1 of the ‘Auto
segmentation’ tool.
5.10.2 Auto segmentation Step2
Step 2 is needed to define the center of the cropped volume defined in step 1. This is done by
manually placing a seed in the transversal view. The seed is indicated by a bluish dot, which is
actually a sphere.
Figure 11 Auto segmentation step 2 seed
11
5.10.3 Auto segmentation Step3
Figure 22 Auto segmentation step 3 3D propagation
Step 3 propagates the sphere from step 2 in all directions, growing a volume, based on the grey
values encountered. Several settings influence the 3D propagation; these are set in the window for
step 3 (see above). They include the ‘level’ and ‘window’ settings, a.k.a. brightness and contrast, the
conductance, which is a kind of smoothness of a filter that is used on the image, and the number of
iterations the algorithm performs, which influences the accuracy. The more iterations performed,
the greater the accuracy, but this can result in a performance penalty.
After accepting the values set in the left hand side of this window, the left hand ‘Update’ button is
clicked and then, after accepting the values in the right hand side of the window, the right hand
‘Update’ button is clicked. The right hand image shows the volume that is detected in 3D. This can
be rotated and zoomed the same way as the volume in the main 3D view. The volume is sliced in
transversal direction, which creates (a) contour(s) for all transversal slices involved.
After pressing the ‘Accept’ button, the generated contours are placed in the transversal slices as RT
Structure Sets.
5.11 Magic Draw
The ‘Magic Draw’ tool is a drawing tool that sort of helps you in defining a contour. Without the
‘magic’ part, a line is drawn between the exact positions of the mouse clicks in a view. This can be
desirable, but often the contour is drawn along the boundaries of a part of the image that visually
deviates from its surroundings, grey value wise that is. This deviation is detected by the ‘Magic Draw’
12
tool, and thus the line points are added near (or at) the mouse position somewhere in the blue box,
in such a way that the tool thinks is the correct position, driven by the grey value of the previous
point that was added.
Figure 33 Using Magic Draw
With the ‘Magic Draw’ tool, a line is created either by clicking the mouse at different positions, or by
dragging (click and hold) it. If a point of a line is in the vicinity of the mouse position, the next point
added can be at exactly that point, thereby closing the contour and making it valid. Clicking in the
image while pressing the ALT button on the keyboard has the same effect; it closes the contour.
5.12 Magic Draw Extrapolate
With the ‘Magic Draw Extrapolate’ tool, the active contour can be propagated to a next or a previous
slice. The grey values of the destination slice are taken into account, so this is not just a ‘copy
contour’ tool.
5.13 Add Contour
Whenever a new contour is created, it must be added to a Region Of Interest (ROI). This means that,
before one of the tools that create a new contour is selected the ‘Add Contour’ tool must be chosen.
In the ‘Add Contour’ dialog, a name can be typed for a new ROI, or an existing ROI can be chosen
from the dropdown list. If however, you select a tool from the toolbar and no contour is currently
active, the ‘Add Contour’ dialog will display automatically.
Figure 44 Add Contour window
5.14 Delete Contour
13
If a contour is no longer valid for use, it can be deleted with the ‘Delete Contour’ tool. After
confirmation, the active contour is deleted from the ROI.
5.15 ROI Manager
With the ‘ROI Manager’ tool, existing ROIs can be edited or removed from the data set. All ROIs are
listed in the ROI Manager’s main window:
Figure 55 ROI Manager
If a ROI is selected in the list, the ‘Remove’ button will remove the ROI from the data set. The ‘Edit’
button takes you to another window, in which the ROI name and the contour color for that ROI can
be set.
Figure 66 ROI Info
14