1
Using Sun WorkShop
901 San Antonio Road
Palo Alto, , CA 94303-4900
USA 650 960-1300 fax 650 969-9131
Part No: 805-4946
Revision A, February 1999
Copyright Copyright 1999 Sun Microsystems, Inc. 901 San Antonio Road, Palo Alto, California 94303-4900 U.S.A. All rights reserved.
All rights reserved. This product or document is protected by copyright and distributed under licenses restricting its use, copying,
distribution, and decompilation. No part of this product or document may be reproduced in any form by any means without prior written
authorization of Sun and its licensors, if any.
Portions of this product may be derived from the UNIX® system, licensed from Novell, Inc., and from the Berkeley 4.3 BSD system,
licensed from the University of California. UNIX is a registered trademark in the United States and in other countries and is exclusively
licensed by X/Open Company Ltd. Third-party software, including font technology in this product, is protected by copyright and licensed
from Sun’s suppliers. RESTRICTED RIGHTS: Use, duplication, or disclosure by the U.S. Government is subject to restrictions of FAR
52.227-14(g)(2)(6/87) and FAR 52.227-19(6/87), or DFAR 252.227-7015(b)(6/95) and DFAR 227.7202-3(a).
Sun, Sun Microsystems, the Sun logo, SunDocs, SunExpress, Solaris, Sun Performance Library, Sun Performance WorkShop, Sun
Performance WorkShop Fortran, Sun Visual WorkShop, Sun WorkShop, Sun WorkShop Compilers C, Sun WorkShop Compilers C++, Sun
WorkShop Compilers Fortran, Sun WorkShop Memory Monitor, Sun WorkShop Professional, Sun WorkShop Professional C, and Sun
WorkShop TeamWare are trademarks, registered trademarks, or service marks of Sun Microsystems, Inc. in the U.S. and other countries.
All SPARC trademarks are used under license and are trademarks or registered trademarks of SPARC International, Inc. in the U.S. and
other countries. Products bearing SPARC trademarks are based upon an architecture developed by Sun Microsystems, Inc.
TM
The OPEN LOOK® and Sun Graphical User Interfaces were developed by Sun Microsystems, Inc. for its users and licensees. Sun
acknowledges the pioneering efforts of Xerox Corporation in researching and developing the concept of visual or graphical user interfaces
for the computer industry. Sun holds a nonexclusive license from Xerox to the Xerox Graphical User Interface, which license also covers
Sun’s licensees who implement OPEN LOOK GUIs and otherwise comply with Sun’s written license agreements.
THIS PUBLICATION IS PROVIDED “AS IS” WITHOUT WARRANTY OF ANY KIND, EITHER EXPRESS OR IMPLIED, INCLUDING,
BUT NOT LIMITED TO, THE IMPLIED WARRANTIES OF MERCHANTABILITY, FITNESS FOR A PARTICULAR PURPOSE, OR
NON-INFRINGEMENT.
Copyright 1999 Sun Microsystems, Inc., 901 San Antonio Road, Palo Alto, Californie 94303-4900 U.S.A. Tous droits réservés.
Ce produit ou document est protégé par un copyright et distribué avec des licences qui en restreignent l’utilisation, la copie et la
décompilation. Aucune partie de ce produit ou de sa documentation associée ne peut être reproduite sous aucune forme, par quelque
moyen que ce soit, sans l’autorisation préalable et écrite de Sun et de ses bailleurs de licence, s’il y en a.
Des parties de ce produit pourront être derivées du système UNIX® licencié par Novell, Inc. et du système Berkeley 4.3 BSD licencié par
l’Université de Californie. UNIX est une marque enregistrée aux Etats-Unis et dans d’autres pays, et licenciée exclusivement par X/Open
Company Ltd. Le logiciel détenu par des tiers, et qui comprend la technologie relative aux polices de caractères, est protégé par un
copyright et licencié par des fournisseurs de Sun.
Sun, Sun Microsystems, the Sun logo, SunDocs, SunExpress, Solaris, Sun Performance Library, Sun Performance WorkShop, Sun
Performance WorkShop Fortran, Sun Visual WorkShop, Sun WorkShop, Sun WorkShop Compilers C, Sun WorkShop Compilers C++, Sun
WorkShop Compilers Fortran, Sun WorkShop Memory Monitor, Sun WorkShop Professional, Sun WorkShop Professional C, et Sun
WorkShop TeamWare sont des marques de fabrique ou des marques déposées, ou marques de service, de Sun Microsystems, Inc. aux
Etats-Unis et dans d’autres pays. Toutes les marques SPARC sont utilisées sous licence et sont des marques de fabrique ou des marques
déposées de SPARC International, Inc. aux Etats-Unis et dans d’autres pays. Les produits portant les marques SPARC sont basés sur une
architecture développée par Sun Microsystems, Inc.
TM
Les utilisateurs d’interfaces graphiques OPEN LOOK® et Sun ont été développés de Sun Microsystems, Inc. pour ses utilisateurs et
licenciés. Sun reconnaît les efforts de pionniers de Xerox Corporation pour la recherche et le développement du concept des interfaces
d’utilisation visuelle ou graphique pour l’industrie de l’informatique. Sun détient une licence non exclusive de Xerox sur l’interface
d’utilisation graphique, cette licence couvrant aussi les licenciés de Sun qui mettent en place les utilisateurs d’interfaces graphiques OPEN
LOOK et qui en outre se conforment aux licences écrites de Sun.
CETTE PUBLICATION EST FOURNIE "EN L’ETAT" SANS GARANTIE D’AUCUNE SORTE, NI EXPRESSE NI IMPLICITE, Y COMPRIS,
ET SANS QUE CETTE LISTE NE SOIT LIMITATIVE, DES GARANTIES CONCERNANT LA VALEUR MARCHANDE, L’APTITUDE DES
PRODUITS A REPONDRE A UNE UTILISATION PARTICULIERE OU LE FAIT QU’ILS NE SOIENT PAS CONTREFAISANTS DE
PRODUITS DE TIERS.
Please
Recycle
Contents
Preface
1.
xi
About Sun WorkShop
1
Integrated Development Tools
Three Integrated Editors
1
2
Sun WorkShop Picklists and WorkSets
2
Performance, Debugging, and File Management Tools
3
Sun WorkShop Visual 3
Sun WorkShop TeamWare
4
Multithreaded Development Tools
Sun WorkShop Compilers
5
5
Compiler C++ 5
Fortran 90 Compiler 6
FORTRAN 77 Compiler
C Compiler
6
6
Sun WorkShop Debugger
7
Web Updates 7
2.
Getting Started
9
Starting Sun WorkShop
9
Sun WorkShop Main Window
10
Contents
iii
Sun WorkShop Menus 10
Tool Bar
11
Selecting and Using Text Editors
12
Using WorkSets and Menu Picklists 13
Adding Items to WorkSets and Menu Picklists 15
Adding Items to a WorkSet Using the WorkSet Window 15
Adding Items to a WorkSet Using a Sun WorkShop Menu 16
Setting Window Layout Options
17
Information Saved from Your Sun WorkShop Session
3.
Browsing Source Code
Understanding Browsing
21
21
Browsing Window 22
Using the Browsing Window
Pattern Search Mode
24
24
Source Browsing Mode 27
Special Characters in Queries 34
Using the Double Colon Operator 34
Source Browser Options Dialog Box
Graphing a Function
35
37
Call Graph Window 37
Graphing a Function or Subroutine Call 39
Graphing Classes 40
Class Graph Window 40
Graphing a Class Hierarchy
42
Changing and Printing Graph Displays
43
Changing the Look of a Call or Class Graph
Showing or Hiding Nodes
43
Changing the Node Layout 44
iv
Using Sun WorkShop ♦ Revision A, February 1999
43
19
Printing a Graph 45
Browsing Classes 46
Class Types that Can Be Examined
Class Browser Window
46
46
Browsing a Class 48
Browsing Classes in Multiple Windows
Relationship of Browsers and Graphers
Exiting Browsing
4.
49
49
50
Building Programs in Sun Workshop
Building a Sun WorkShop Target
Building Window
51
51
52
Building a Program
54
Define New Target and Edit Target Dialog Boxes 54
Building With Default Values 56
Building With Nondefault Values
57
Collecting Build Output 58
Saving Build Output 58
Modifying a WorkShop Target
59
Removing a WorkShop Target
59
Customizing a Build
59
Specifying Make Options 60
Specifying a Build Mode
Using Makefile Macros
62
64
Using Environment Variables
Fixing Build Errors
67
69
Displaying the Source of an Error
Fixing an Error
71
72
Running a Distributed Build 73
Contents v
Preparing for a Distributed Build
74
.dmakerc File 74
dmake.conf File
76
Examining Multiple Build Jobs 76
Exiting Building
5.
76
Debugging a Program 77
Debugging Features
77
Preparing a Program for Debugging 78
Starting Debugging
79
Sun WorkShop Debugging Windows 80
Debugging Window
Editor Window
80
83
Custom Buttons Window
84
Using the Button Editor 85
Basic Debugging Steps 89
Changing Run Parameters 89
Stepping Through Your Code
Setting Breakpoints
92
93
Collecting Performance Data
98
Runtime Checking 99
Tracing Code
102
Examining Values and Data 103
Monitoring Data Values 104
Examining the Call Stack 104
Debugging Multithreaded Programs
Customizing Debugging Sessions
Debugging Processes Simultaneously
Managing Sessions 107
vi
Using Sun WorkShop ♦ Revision A, February 1999
105
105
106
Quitting a Debugging Session
Debugging a Child Process
108
108
Quick Mode 109
Advantages of Quick Mode
110
When to Use Quick Mode 110
How to Switch to Quick Mode 111
Quick Mode Example
Exiting Debugging
6.
111
112
Analyzing Program Performance 113
Performance Profiling in Sun WorkShop
Building the Application
113
115
Collecting Performance Data 115
Types of Data You Can Collect
115
Frequency of Sample Collection 116
Collecting Data 116
Analyzing Performance Data 116
Types of Data You Can View and Analyze
Display Options
117
117
Comparing Samples 118
Reordering Program Functions 118
Printing
120
Exporting Experiment Data 120
7.
Merging Source Files
121
Understanding Merging
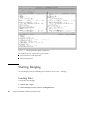
Starting Merging
Loading Files
121
122
122
Setting Merging Options
Working With Differences
123
123
Contents vii
Current, Next, and Previous Differences
124
Resolved and Remaining Differences 124
Understanding Glyphs 124
Moving Between Differences
Resolving Differences
125
Setting Difference Options
Merging Automatically
125
125
125
Saving the Output File 126
A.
Setting Sun WorkShop Resources 127
Sun WorkShop Resource Files
127
Resources Available for Editing 128
Changing a Resource
129
Changing Wide Character Fonts in Hyperlink Windows
Sun WorkShop Resources
129
130
Highlight Colors in Editor Windows 130
Data Graph Window Colors 131
Call Graph and Class Graph Window Colors 131
Help Window Colors 132
Audible Warnings
133
Debugger Buttons 133
Dbx Commands and Program I/O Window Output Lines
Browser Used to Display Web Updates 134
Hyperlink Resources
134
Automatic Text Wrapping
Motif-specific Resources
135
136
Window Foreground and Background Colors 137
Scrollbar Background and Toggle Button Colors 139
ESERVE Resources 140
viii
Using Sun WorkShop ♦ Revision A, February 1999
134
Emacs Editor Default Path Names
Blinking Pointer
140
140
Fonts for Motif Environments 141
Text Editor Window Colors 141
Scrolling List Background Color 141
Writable Text Area Background Color 142
Audible Warnings
142
Browser Used to Display Web Updates 143
B.
The make Utility and Makefiles
145
The make Utility 145
The Makefile
145
FORTRAN 77 Example
146
C++ Example 147
The make Command 147
Macros
148
Creating Macros With the Make Macros Dialog Box
Overriding of Macro Values
Suffix Rules in the make Utility
148
149
149
More Information 150
C.
Using the dmake Utility
151
Basic Concepts 151
Configuration Files
The dmake Host
152
152
The Build Server 154
Understanding the dmake Utility
155
Impact of the dmake Utility on Makefiles
155
Using the dmake Utility 160
Controlling dmake Jobs
161
Contents ix
D.
Browsing Source With sbquery, sb_init, and sbtags
Browsing Source With sbquery 163
Understanding sbquery 164
Command Reference
164
Controlling the Browser Database With sb_init
168
Understanding sb_init 168
Command Reference
169
Collecting Browsing Information With sbtags
Understanding sbtags 174
Generating an sbtags Database 175
Index 177
x
Using Sun WorkShop ♦ Revision A, February 1999
174
163
Preface
Using
Sun WorkShop
introduces you to the basic program development features of
TM
TM
Sun WorkShop . This book describes how to:
4 Select a default text editor
4 Run a build job
4 Debug a program
4 Browse source code
4 Analyze performance data
4 Merge source files
4 Set some Sun WorkShop resources
Who Should Use This Book
This manual is for application developers who want to use the main development
features of Sun WorkShop. For a discussion of Sun WorkShop program analysis tools,
see Analyzing Program Performance With Sun WorkShop. For a discussion of Sun
WorkShop debugging tools, see Debugging a Program With dbx.
How This Book Is Organized
Using Sun WorkShop contains the following chapters:
Preface xi
Chapter 1” is an overview of the Sun WorkShop programming environment. This
chapter also highlights the components available in the various Sun WorkShop
products.
Chapter 2” explains what you need to do to start developing in Sun WorkShop,
including how to start Sun WorkShop, how to select a text editor, and how to use
WorkSets.
Chapter 3” shows you how to use the Browsing window, the Call Grapher, the Class
Grapher, and the Class Browser to examine source files, function call relationships,
and class hierarchies.
Chapter 4” shows you how to build an application with Sun WorkShop default
settings or your own build settings, and how to fix build errors.
Chapter 5” highlights the debugging features offered in Sun WorkShop and describes
the basic debugging tasks. It also explains how to debug in Quick Mode, which
allows you to run your program normally, but keeps debugging ready in the
background to take over the process at any time.
Chapter 6” gives an overview of how to gather and examine the various types of
data with the Sampling Collector and Sampling Analyzer, and how to use other
performance analysis tools to improve the performance of an application.
Chapter 7” shows you how to compare different versions of a source file and merge
the changes.
Appendix A” shows you how to modify some of the resource settings in Sun
WorkShop.
Appendix B” describes the options that you can set for the make utility.
Appendix C” describes the way DistributedMake (dmake) distributes builds over
several hosts to build programs concurrently over a number of workstations or
multiple CPUs.
Appendix D,” describes sbquery, one of the command-line utilities for browsing
source code. It also tells you how to work with source files whose database
information is stored in multiple directories, and describes the sbtags command,
which provides a quick and convenient method for collecting browsing information
from source files.
Multiplatform Release
Note - The name of the latest Solaris operating environment release is Solaris 7 but
code and path or package path names may use Solaris 2.7 or SunOS 5.7.
xii
Using Sun WorkShop ♦ Revision A, February 1999
TM
TM
The Sun WorkShop documentation applies to Solaris 2.5.1, Solaris 2.6, and Solaris
7 operating environments on:
TM
4 The SPARC
platform
4 The x86 platform, where x86 refers to the Intel implementation of one of the
following: Intel 80386, Intel 80486, Pentium, or the equivalent
Note - The term “x86” refers to the Intel 8086 family of microprocessor chips,
including the Pentium, Pentium Pro, and Pentium II processors and compatible
microprocessor chips made by AMD and Cyrix. In this document, the term “x86”
refers to the overall platform architecture. Features described in this book that are
particular to a specific platform are differentiated by the terms “SPARC” and
“x86” in the text.
Related Books
The following Sun manuals and guides provide additional useful information:
4 Sun WorkShop Quick Install provides installation instructions.
4 Sun WorkShop Installation and Licansing Reference provides supporting installation
and licensing information..
4 Debugging a Program With dbx provides information on using dbx commands to
debug a program.
4 Analyzing Program Performance With Sun WorkShop describes the profiling tools;
LoopTool, LoopReport, LockLint utilities; and use of the Sampling Analyzer to
enhance program performance.
4 Sun WorkShop TeamWare User’s Guide describes how to use the Sun WorkShop
TeamWare code management tools.
4 Sun TMWorkShop Visual User’s Guide describes how to use Visual to create C++ and
Java graphical user interfaces.
4 Sun WorkShop Performance Library Reference Manual discusses the library of
subroutines and functions to perform useful operations in computational linear
algebra and Fourier transforms.
4 Sun Visual WorkShop C++ Overview gives a high-level outline of the C++
package suite.
4 Sun Performance WorkShop Fortran Overview gives a high-level outline of the
Fortran package suite.
4 C++ User’s Guide provides information on command-line options and how to use
the compiler.
xiii
4 C++ Programming Guide discusses issues relating to the use of templates,
exception handling, and interfacing with FORTRAN 77.
4 C++ Migration Guide describes migrations between compiler releases.
4 C++ Library Reference explains the iostream libraries.
4 Tools.h++ User’s Guide provides details on the Tools.h++ class library.
4 Tools.h++ Class Library Reference discusses use of the C++ classes for enhancing
the efficiency of your programs.
4 C User’s Guide describes compiler options, pragmas, and more.
4 FORTRAN 77 Language Reference Manual provides a complete language
reference.
4 Fortran User’s Guide provides information on command-line options and how to
use the compilers.
4 Fortran Programming Guide discusses issues relating to input/output, libraries,
program analysis, debugging, and performance.
4 Fortran Library Reference gives detail on the language and routines.
4 Numerical Computation Guide details floating-point computation numerical
accuracy issues.
4 Standard C++ Library User’s Guide describes how to use the Standard C++
Library.
4 Standard C++ Class Library Reference provides detail on the Standard C++ Library.
Solaris Books
4 The Solaris Linker and Libraries Guide gives information on linking and libraries.
4 The Solaris Programming Utilities Guide provides information TM
for developers about
the special built-in programming tools available in the SunOS system.
Ordering Sun Documents
The SunDocsSM program provides more than 250 manuals from Sun Microsystems,
Inc. If you live in the United States, Canada, Europe, or Japan, you can purchase
documentation sets or individual manuals using this program.
For a list ofTMdocuments and how to order them, see the catalog section of the
SunExpress Internet site at http://www.sun.com/sunexpress.
xiv
Using Sun WorkShop ♦ Revision A, February 1999
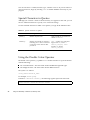
Accessing Sun Documents Online
Sun WorkShop documentation is available online from several sources:
4 The docs.sun.com Web site
4 AnswerBook2TM collections
4 HTML documents
4 Online help and release notes
Using the docs.sun.com Web site
The docs.sun.com Web site enables you to access Sun technical documentation
online. You can browse the docs.sun.com archive or search for a specific book title
or subject. The URL is http://docs.sun.com.
Accessing AnswerBook2 Collections
The Sun WorkShop documentation is also available using AnswerBook2 software. To
access the AnswerBook2 collections, your system administrator must have installed
the AnswerBook2 documents during the installation process (if the documents are
not installed, see your system administrator or Chapter 3 of Sun WorkShop Quick
Install for installation instructions). For information about accessing AnswerBook2
documents, see Chapter 6 of Sun WorkShop Quick Install, Solaris installation
documentation, or your system administrator.
Note - To access AnswerBook2 documents, Solaris 2.5.1 users must first download
AnswerBook2 documentation server software from a Sun Web page. For more
information, see Chapter 6 of Sun WorkShop Quick Install.
Accessing HTML Documents
The following Sun Workshop documents are available online only in HTML format:
4 Tools.h++ Class Library Reference
4 Tools.h++ User’s Guide
4 Numerical Computation Guide
xv
4 Standard C++ Library User’s Guide
4 Standard C++ Class Library Reference
4 Sun WorkShop Performance Library Reference Manual
4 Sun WorkShop Visual User’s Guide
4 Sun WorkShop Memory Monitor User’s Manual
To access these HTML documents:
1. Open the following file through your HTML browser:
install-directory/SUNWspro/DOC5.0/lib/locale/C/html/index.html
Replace install-directory with the name of the directory where your Sun WorkShop
software is installed (the default is /opt).
The browser displays an index of the HTML documents for the Sun WorkShop
products that are installed.
2. Open a document in the index by clicking the document’s title.
Accessing Sun WorkShop Online Help and
Release Notes
This release of WorkShop includes an online help system as well as online manuals.
To find out more see:
4 Online Help. A help system containing extensive task-oriented, context-sensitive
help. To access the help, choose Help Æ Help Contents. Help menus are available
in all Sun WorkShop windows.
4 Release Notes. The Release Notes contain general information about Sun
WorkShop and specific information about software limitations and bugs. To access
the Release Notes, choose Help Æ Release Notes.
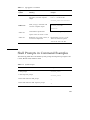
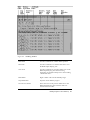
What Typographic Changes Mean
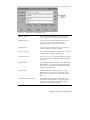
The following table describes the typographic changes used in this book.
xvi
Using Sun WorkShop ♦ Revision A, February 1999
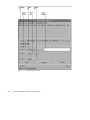
TABLE P–1
Typographic Conventions
Typeface or
Symbol
AaBbCc123
Meaning
Example
The names of commands, files, and
directories; on-screen computer
output
Edit your .login file.
Use ls -a to list all files.
machine_name% You have mail.
AaBbCc123
What you type, contrasted with
on-screen computer output
machine_name% su
Password:
Command-line placeholder:
AaBbCc123
To delete a file, type rm filename.
replace with a real name or value
Book titles, new words or terms, or
words to be emphasized
AaBbCc123
Read Chapter 6 in User’s Guide.
These are called class options.
You must be root to do this.
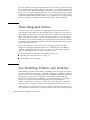
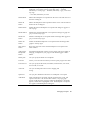
Shell Prompts in Command Examples
The following table shows the default system prompt and superuser prompt for the
C shell, Bourne shell, and Korn shell.
TABLE P–2
System Prompts
Shell
Prompt
C shell prompt
machine_name%
C shell superuser prompt
machine_name#
Bourne shell and Korn shell prompt
$
Bourne shell and Korn shell superuser prompt
#
xvii
xviii
Using Sun WorkShop ♦ Revision A, February 1999
CHAPTER
1
About Sun WorkShop
Sun WorkShop makes complex development tasks much easier by providing a
tightly integrated development environment for building, editing, source browsing,
and debugging. It provides an integrated set of tools and services, including the
Visual GUI builder, which can help you to quickly create new GUIs. Integrated
editors make it easier to perform common development tasks, and Sun WorkShop
WorkSets help you keep track of the files, programs, directories, and targets
associated with your development projects. This chapter presents a general
introduction to the features of this release including the following topics:
4 “Integrated Development Tools” on page 1
4 “Sun WorkShop Picklists and WorkSets” on page 2
4 “Performance, Debugging, and File Management Tools” on page 3
4 “Sun WorkShop Visual” on page 3
4 “Sun WorkShop TeamWare” on page 4
4 “Multithreaded Development Tools” on page 5
4 “Sun WorkShop Compilers” on page 5
4 “Sun WorkShop Debugger” on page 7
Integrated Development Tools
Sun WorkShop provides an integrated environment for the development and
evolution of C++, C, Fortran 90, and FORTRAN 77 applications. It provides a high
level of integration of core development functions such as editing, source browsing,
building, and debugging.
1
The most common development operations are obvious and easy to perform because
the vi, XEmacs, and GNU Emacs editors are the center of an integrated development
tool set that includes Building, Debugging, and Browsing. The integrated editors also
provide access to common development tasks such as evaluating expressions, setting
breakpoints, and stepping through functions, as well as powerful new features such
as Fix and Continue. This integration allows you to spend most of your programming
time in your editors and makes code development quicker and more efficient.
Three Integrated Editors
To increase ease of use and improve developer productivity, Sun WorkShop uses a
new architecture that makes most development tasks accessible from your editor of
choice (XEmacs, GNU Emacs, or vi). This “edit server” architecture means that you
always view, edit, and operate on source code from a single view—your preferred
editor. These editors are really your editors, not emulations. They have the familiar
look and feel of your editor, including your existing keyboard shortcuts. The editors
can perform many development functions and share task information with the other
integrated development tools.
This means that most common tasks, such as evaluating expressions, setting
breakpoints, and stepping through functions are available from several different
windows, including your editor of choice (vi, XEmacs, or GNU Emacs). Complex
application development becomes easier and more efficient.
For more information on using the Sun WorkShop editors, see:
4 “Selecting and Using Text Editors” on page 12
4 "Text Editing" in the online help
Sun WorkShop Picklists and WorkSets
Sun WorkShop provides a new method
of organizing
and accessing the files, targets,
TM
TM
programs, experiments, and (if Sun WorkShop TeamWare is installed) workspaces
associated with a given development project. Sun WorkShop remembers recent work
completed on a given project and populates menu picklists with the files and
operations used on that project. Whenever you start Sun WorkShop, it remembers
the last set of operations performed and populates the appropriate menu
picklist—whether it is five minutes or a week later. You do not have to remember
long path names or argument sequences; Sun WorkShop remembers them for you.
Additionally, sets of picklists can be saved as WorkSets. WorkSets allow you to save
sets of picklists associated with a given development project under a single name. By
2
Using Sun WorkShop ♦ Revision A, February 1999
loading a WorkSet file, you can reload the files connected to a development project to
the appropriate menu picklist.
For more information on using WorkSets, see:
4 “Using WorkSets and Menu Picklists” on page 13
4 “Using WorkSets” in the online help
Performance, Debugging, and File
Management Tools
Sun WorkShop uses a Tools menu (and button bar) to provide easy access to
performance and debugging tools and their object files. The individual tools in the
Tools menu contain picklists for the objects specific to the tool. You can build a list of
objects or files used by a particular tool, thus making it easier to bring up the tool
with the object loaded. For example, after you have loaded a design file into Visual
once, start Visual with that design file loaded again by choosing the file from the
Visual picklist on the main Sun WorkShop Tools menu.
By default, the Sun WorkShop main window
includes button bar or menu
access to
TM
TM
the Analyzer and Merging. If you have Sun Performance WorkShop Fortran, the
Tools menu or button bar also provides access to the Sun WorkShop TeamWare
file
TM
management
tools,
and
the
multithreaded
tool,
LoopTool.
If
you
have
Sun
Visual
TM
WorkShop C++, you have access to Visual..
For more information about using the tools, or about picklists, see:
4 “Using WorkSets and Menu Picklists” on page 13
4 “Multithreaded Development Tools” on page 5
4 Sun WorkShop TeamWare User’s Guide
4 Analyzing Program Performance With Sun WorkShop
4 “Analyzing Performance Data” or "Analyzing Program Loops" in the online help
Sun WorkShop Visual
Available only with Sun Visual WorkShop C++.
Visual helps developers quickly and easily design GUIs, generate portable
object-oriented code, and develop Motif or Microsoft Foundation Class GUIs.
About Sun WorkShop 3
A large percentage of your application’s source code base can be GUI code. Visual is
an interactive tool that allows you to see what the interface looks like and how it
behaves while it is being built. Visual automatically generates the code when the
design is complete.
For more information about this release of Visual, see Sun WorkShop Visual User’s
Guide.
Sun WorkShop TeamWare
Available only with Sun Performance WorkShop Fortran and Sun Visual WorkShop
C++.
Sun WorkShop TeamWare provides services for source code management either
visually, through a set of GUIs, or from a command line. TeamWare enables teams to
work together more efficiently even when team members are distributed among
multiple sites. TeamWare provides structure as well as automated functions that
allow a team to work in parallel to coordinate, integrate, and build a product. The
services include:
Configuring
For managing and integrating source code configurations and releases
Versioning
For creating and tracking file version histories
Freezepointing
For baselining a software configuration or release for later retrieval
Building
For reducing the time required to build large projects by executing build
jobs on multiple Solaris hosts
Merging
For merging source files and coordinating source changes
For more information about using TeamWare, see the Sun WorkShop TeamWare
User’s Guide or start Sun WorkShop TeamWare and choose Help from the main
window.
4
Using Sun WorkShop ♦ Revision A, February 1999
Multithreaded Development Tools
The Sun Performance WorkShop Fortran and Sun Visual WorkShop C++ include
tools for developing multithreaded applications. Sun WorkShop Debugging supports
dynamic analysis and control of multithreaded programs. LockLint analyzes source
code for potential synchronization errors, such as deadlock and data race conditions.
LoopTool displays a graph of loop runtimes and shows which loops were
parallelized. Together they provide powerful support for multithreaded program
development.
For more information on using the multithreaded tool set, see:
4 Analyzing Program Performance With Sun WorkShop
4 "Debugging Multithreaded Programs" in the online help
Sun WorkShop Compilers
This release of Sun WorkShop supports the following compilers.
Compiler C++
Available only with Sun Visual WorkShop C++.
This release implements the complete feature set found in The Annotated C++
Reference Manual.1 It includes support for exception handling, an incremental linker,
a fast template instantiation scheme, and an enhanced version of the commercially
available Tools.h++ class library. As an optimizing, native C++ compiler, the
version offers significant boosts in both compilation and execution speed.
The C++ language features in this release offer improved support for the ISO C++
standard, including:
4 Standard C++ Library
4 Namespaces
4 Bool type
4 Koenig lookup
4 Mutable members
4 Typename
1. Stroustrop, Bjarne, and Margaret Ellis, The Annotated C++ Reference Manual, Addison-Wesley, 1990.
About Sun WorkShop 5
4 Template default parameters
For more information about the C++ compiler, including a list of the C++
documentation, see C++ User’s Guide.
Fortran 90 Compiler
Available only with Sun Performance WorkShop Fortran.
This release is a complete implementation of the Fortran 90 ANSI X3.198-1992
standard. This standard has added many powerful features, such as an improved
ability to express mathematical formulas more directly in the programming
language. In addition, the Fortran 90 compiler works with the rest of Sun WorkShop
to automatically parallelize your code.
For more information about the Fortran 90 compiler, including a list of the Fortran
documentation, see the Fortran User’s Guide or Fortran Programming Guide.
FORTRAN 77 Compiler
Available only with the Sun Performance WorkShop Fortran.
This compiler is a complete implementation of the FORTRAN 77 ANSI X3.9-1978,
ISO 1539-1980 standards. It has an improved ability to express mathematical
formulas more directly in the programming language, as well as extensions that
provide compatibility with VAX VMS Fortran and Cray Fortran.
For more information about the FORTRAN 77 compiler, including a list of the
Fortran documentation, see the Fortran User’s Guide or Fortran Programming Guide.
C Compiler
This compiler is fully compliant with the ANSI C language and environment
standard, and it also supports traditional K&R C. The C optimizer provides
significant performance increases over nonoptimized code. The code optimizer
removes redundancies, efficiently allocates registers, and schedules instructions. Also
featured is an incremental linker to reduce link time during the debugging phase.
For more information about the C compiler, including a list of the C documentation,
see C User’s Guide.
6
Using Sun WorkShop ♦ Revision A, February 1999
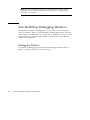
Sun WorkShop Debugger
Sun WorkShop uses a window-based source code debugging service that provides
the ability to run a program in a controlled fashion and to inspect the state of a
stopped program. Sun WorkShop provides complete integration with three text
editors to allow you to edit a program"s source code while using full debugging
functionality. You have complete control of the dynamic execution of a program,
including the collection of performance data. A line-oriented, source-level debugger
called dbx is included.
You perform most debugging operations from the Debugging window and the
windows accessed from it. You can also perform basic debugging operations from a
text editor window containing the source code, which opens automatically when you
load a program for debugging.
Web Updates
The Web Updates Dialog Box lets you display updated information on Sun
WorkShop using your Web browser. To open the Web Updates dialog box, choose
Web Updates from the Help menu in any Sun WorkShop window. For more
information, see “Web Updates Dialog Box” in the Sun WorkShop online help.
About Sun WorkShop 7
8
Using Sun WorkShop ♦ Revision A, February 1999
CHAPTER
2
Getting Started
This chapter describes how to begin working in Sun WorkShop. For instructions on
installing Sun WorkShop, see the Sun WorkShop Quick Install.
This chapter is organized into the following sections:
4 “Starting Sun WorkShop” on page 9
4 “Sun WorkShop Main Window” on page 10
4 “Selecting and Using Text Editors” on page 12
4 “Using WorkSets and Menu Picklists” on page 13
4 “Adding Items to WorkSets and Menu Picklists” on page 15
4 “Information Saved from Your Sun WorkShop Session” on page 19
Starting Sun WorkShop
Once you have installed Sun WorkShop and added it to your command path, you
can start it by typing workshop & at a command prompt.
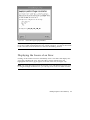
If this is the first time you have used WorkShop, the About WorkShop window
appears in front of the WorkShop main window. If you have not registered, take a
few minutes and do so. If you have not read the Overview, now might be a good
time to do so.
You can set colors and fonts used in the windows of WorkShop and its integrated
text editor, including the foreground and background colors of windows, and colors
used to highlight various types of text in the editor windows. You can also set other
types of resources, such as a blinking cursor and the automatic wrapping of text in
Sun WorkShop windows. For information on changing the default resources of Sun
WorkShop in both CDE and non-CDE environments, see Appendix A.”
9
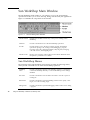
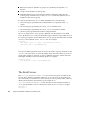
Sun WorkShop Main Window
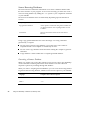
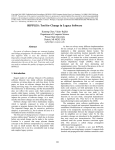
The Sun WorkShop main window is your primary access to the programming
operations that allow you to create, develop, debug, and fine-tune your applications.
Figure 2–1 identifies the components of the window.
Figure 2–1
Sun WorkShop Main Window
Window header
Identifies the WorkSet and directory of the process running in Sun
WorkShop
Menu bar
Provides commands for all of the Sun WorkShop operations
Tool bar
Provides quick access to the most common program development
operations: opening a file, starting a build, debugging a program,
browsing source files, managing WorkSets, analyzing data, managing
code and versions, and designing GUIs
Window footer
Displays error messages and provides tool bar button definitions when
the pointer is positioned over a button
Sun WorkShop Menus
The menu bar in the Sun WorkShop main window provides the following menus,
which provide commands for all of the Sun WorkShop operations.
10
WorkShop
menu
Provides commands to manage Sun WorkShop windows, to change the
current Sun WorkShop directory, to exit Sun WorkShop, and to manage
WorkSets
File menu
Provides commands to start an editor and create a new file or open an
existing file
Build menu
Provides commands to open the Building window and to specify a new
target, or to edit an existing target
Debug menu
Provides commands to open the Debugging window and to run or debug
a program
Using Sun WorkShop ♦ Revision A, February 1999
Browse menu
Provides commands to open the Browsing window and to browse source
files or classes
Options menu
Allows you to select a default editor, debugging options, WorkSet
options, and window layout options
Tools menu
Provides quick access to Sun WorkShop operations and to Sun WorkShop
development tools available with the Sun Performance WorkShop Fortran
and the Sun Visual WorkShop C++
Help menu
Provides commands to get help on programming in Sun WorkShop and
to view help on a selected item; also provides a way for you to send in
your comments about Sun WorkShop
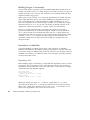
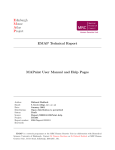
Tool Bar
The tool bar in the Sun WorkShop main window, shown in Figure 2–2, provides
quick access to windows where you can edit files, build a target, debug a program,
browse for program symbols, and more.
Figure 2–2
Sun WorkShop Main Window Tool Bar
File button
Opens the File to Open dialog box, where you can select a file to edit in
the text editor of your choice—vi, GNU Emacs, and XEmacs.
Building button
Opens the Building window, then rebuilds the current targets.
Debugging
button
Opens the Debugging window and loads the current program for
debugging. If there is no current program, opens the Debug New
Program dialog box, where you can select a program file and enter
parameters for debugging.
Browsing
button
Opens the Browsing window so you can perform queries using pattern
searching or source browsing.
WorkSets button
Opens the WorkSets window and displays the current WorkSet.
Getting Started
11
Analyzer button
Opens the Sampling Analyzer window and the Analyzer Load
Experiment dialog box allowing you to analyze application performance
data.
LoopTool button
Opens the LoopTool window, where you can analyze multithreaded
applications (available with Sun Visual WorkShop C++ and Sun
Performance WorkShop Fortran)
Merging button
Opens the Merging window and a dialog box to select text files to
compare and merge.
TeamWare
button
Opens the Sun WorkShop TeamWare source code management tool,
where you can access the TeamWare tools (available with Sun Visual
WorkShop C++ and Sun Performance WorkShop Fortran)
Visual button
Opens the Visual window for you to design visual applications (available
with the Sun Visual WorkShop C++)
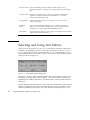
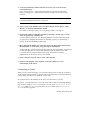
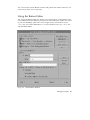
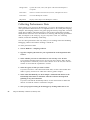
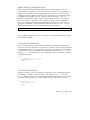
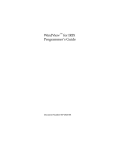
Selecting and Using Text Editors
Unless you have previously set your EDITOR environment variable to GNU Emacs
or XEmacs, Sun WorkShop uses the vi editor (For information on how to set your
EDITOR environment variable, see the man page for your command shell). To use
the integrated GNU Emacs or XEmacs editors, you must use the Text Editor Options
dialog box shown in Figure 2–3.
Figure 2–3
Text Editor Options Dialog Box
The editor you choose will remain the default editor for subsequent sessions of Sun
WorkShop. To change editors, choose Options > Text Editor Options from the Sun
WorkShop main window and select a new default editor in the Text Editor Options
dialog box.
The Sun WorkShop implementation of vi includes a Re-usable button. If the button is
enabled, subsequently opened files are displayed in the original Vi window. If the
button is disabled and you open a new vi file, the new file is displayed in a new Vi
12
Using Sun WorkShop ♦ Revision A, February 1999
window. The Re-usable button in the lower-right corner of the window toggles
between enabling and disabling the reuse feature.
Vi and XEmacs include tool bars specific to Sun WorkShop. GNU Emacs and XEmacs
include minibuffer commands specfic to Sun WorkShop that help you to browse and
debug source code. In addition, you can open Sun WorkShop from an existing Emacs
session by typing M-x workshop-start in the minibuffer. To use GNU Emacs with
Sun WorkShop, you need to set the load path in your .emacs file. See the online
help section “Starting WorkShop From Emacs” for instructions.
Using WorkSets and Menu Picklists
Most of the Sun WorkShop menus contain picklists that provide access to the items
used by the menu. For example, the picklist on the File menu contains all the files
associated with the current Sun WorkShop WorkSet. The picklist on the Debug menu
contains all the programs associated with the current Sun WorkShop WorkSet.A Sun
WorkShop WorkSet is the set of items contained on the menu picklists.
WorkSets and menu picklists help you keep track of the files and other items you use
for your development projects. WorkShop uses WorkSets and menu picklists to
provide quick access to the various directories and files associated with a given
development project, including the following:
4 Source files
4 Build targets
4 Programs
4 Experiments
4 Source browser directories
4 Workspaces (if TeamWare is installed)
4 Sun WorkShop Visual design files
Each type of item is saved to a different menu picklist. For example, if you load a
program called Freeway into the Debugging window, Freeway is added to the
Debug menu picklist. The next time you want to debug the Freeway program, you
can choose Freeway from the Debug menu picklist.
Although you can create your own WorkSet, you do not have to. Sun WorkShop will
create one for you. Sun WorkShop uses WorkSets to save complete sets of menu
picklists. Whenever you start Sun WorkShop, it either creates a default WorkSet
(usually .default.wst) or it opens the last WorkSet you had open. By default,
when you close WorkShop, it automatically saves your current WorkSet.
You can create new WorkSets of your own using the New WorkSet item in the
WorkShop menu. By saving a WorkSet you can save all the picklist items associated
Getting Started
13
with a given development project under a single name. Saving your picklist items
and files as a WorkSet makes them easier to access later.
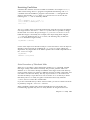
Figure 2–4
WorkShop Menu
For example, suppose you use Sun WorkShop to:
4 Create and edit several source files
4 Build a program target
4 Debug the program
By default, the files, build target, and program you created are added to the
appropriate menu picklist. In this case, the source files are placed on the File menu
picklist, the build target is placed on the Build menu picklist, and the program is
placed on the Debug menu picklist. To save all of these as a WorkSet, choose
WorkShop Æ Save WorkSet As, and then type a name in the Name text box of the
Save WorkSet As dialog box. Sun WorkShop stores the files, target and program
under the name you choose. Loading this WorkSet later reloads the files, target, and
program references connected to the appropriate menu picklists.
To start WorkShop with a specific WorkSet loaded, specify the WorkSet name on the
command line at startup. For example, the following command starts WorkShop with
all the files, targets, programs, and so on associated with the freeway WorkSet
loaded on the appropriate menu picklists:
workshop freeway.wst
14
Using Sun WorkShop ♦ Revision A, February 1999
Adding Items to WorkSets and Menu
Picklists
Whenever you start WorkShop, it remembers the last WorkSet you had open and the
last set of development tasks you performed. It populates Sun WorkShop menu
picklists with the items (files, programs, and so on) contained in that WorkSet.
Picklist items (for example, files on the File menu) can be added to or removed from
menu picklists (and therefore to and from the current WorkSet) either by editing the
WorkSet, or by adding or removing an item directly from any of the WorkShop
menus.
Adding Items to a WorkSet Using the WorkSet
Window
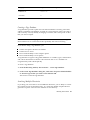
To edit the WorkSet directly, choose WorkShop Æ Edit WorkSet WorkSet_Name. When
the WorkSet window appears, use it to add or delete the desired object.
Getting Started
15
Figure 2–5
WorkSet Window
Adding Items to a WorkSet Using a Sun
WorkShop Menu
To add an object to a WorkSet using a WorkShop menu, choose New from the menu.
When you open a new item, it is automatically added to the menu picklist and the
current WorkSet. To remove an item from a menu picklist (and therefore from the
current WorkSet), choose Remove item from menu where item represents the object
controlled by the menu. When the file chooser appears, select the item or items you
want to remove.
16
Using Sun WorkShop ♦ Revision A, February 1999
Figure 2–6
File Menu Picklist
For more information about creating, editing, or modifying WorkSets, see “Using
WorkSets” in the Sun WorkShop online help.
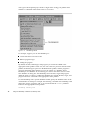
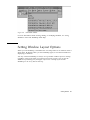
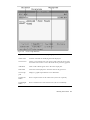
Setting Window Layout Options
When you exit WorkShop, it remembers the size and position of its windows when it
shuts down. By default, when you start WorkShop again, it uses this information in
displaying its windows.
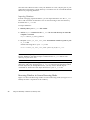
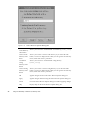
You may want Sun WorkShop to always use a particular window layout on startup,
regardless of the layout when you exited your previous session. You can use the
Window Layout dialog box (see Figure 2–7) to save a startup layout for Sun
WorkShop to use every time it starts up.
Getting Started
17
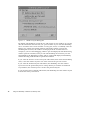
Figure 2–7
Window Layout Dialog Box
By default, Sun WorkShop records the size and position of each window on exit and
uses this information the next time you open a window. If you want Sun WorkShop
also to record the state of each window on exit (open, closed, or iconified), select the
Restore size, position and visible windows radio button. When you start Sun
WorkShop the next time, the windows are displayed in the recorded state. For
example, if you have the Debugging window open and displayed, and the Browsing
window open but iconified, when you exit Sun WorkShop, the next time you start
Sun WorkShop, the Debugging window will be opened and displayed immediately,
and the Browsing window will be opened and iconified.
If you select the Previous session exit layout radio button, then when Sun WorkShop
starts, it uses the window layout in use at the exit from the previous session.
If you select the Preferred layout radio button, Sun WorkShop uses the window
layout saved as the preferred layout for startup. When you click the Set Preferred
Layout button, the current layout is saved as the preferred layout.
If you select the Factory default radio button, Sun WorkShop uses the window layout
from the first time you started it.
18
Using Sun WorkShop ♦ Revision A, February 1999
Information Saved from Your Sun
WorkShop Session
Sun WorkShop saves information from session to session in WorkSets (see “Using
WorkSets and Menu Picklists” on page 13), in the .workshop-options file, and in
the .workshoprc file.
Information saved in a WorkSet when you exit Sun WorkShop includes:
4 Source files
4 Build targets
4 Programs
4 Experiments
4 Source browser directories
4 Workspaces (if Sun WorkShop TeamWare is installed)
4 WorkShop Visual design files
Information saved in your .workshop-options file when you exit Sun WorkShop
includes:
4 The name of the current WorkSet
4 WorkSet option settings (see “WorkSet Options Dialog Box” in the Sun WorkShop
online help)
4 Your WorkSet picklist
4 Window layout options (see “Setting Window Layout Options” on page 17)
4 Debugging options (see “Debugging Options Dialog Box” in the Sun WorkShop
online help)
4 Size and position of Sun WorkShop windows
Information saved in your .workshoprc file when you exit Sun WorkShop includes
all of the dbx environment variable settings.
Getting Started
19
20
Using Sun WorkShop ♦ Revision A, February 1999
CHAPTER
3
Browsing Source Code
The Sun WorkShop browsing feature is a powerful tool. By browsing, you can find
all occurrences of any symbol or string in a large program, including those found in
header files.
This chapter is organized into the following sections:
4 “Understanding Browsing” on page 21
4 “Browsing Window” on page 22
4 “Using the Browsing Window ” on page 24
4 “Graphing a Function” on page 37
4 “Graphing Classes” on page 40
4 “Changing and Printing Graph Displays” on page 43
4 “Browsing Classes” on page 46
4 “Relationship of Browsers and Graphers” on page 49
Browsing uses a “what you see is what you browse” paradigm. The source code that
you edit and compile is the same source code that Sun WorkShop uses in its searches.
Browsing can be used with multiple languages. When you browse a program that is
written in more than one language, the browsing feature automatically determines
the language in which each source file is written. The browsing operations do not
change from one language to another.
Understanding Browsing
You browse source code written in C, C++, FORTRAN 77, and Fortran 90 by issuing
queries that instruct Sun WorkShop to find all occurrences of the symbol, string
21
constant, or search pattern that you have specified. You then view the occurrences or
matches of the item you requested, with their surrounding source code.
You can also graph the function and subroutine relationships in your program. If
your source code is written in C++, then you can browse and graph the classes
defined in your program.
Browsing responds to queries by searching in a database that contains information
about the files you are browsing. You create this database when you compile your
source file with the Browsing option.
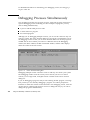
Browsing Window
To open the Browsing window, shown in Figure 3–1, click the Browsing button on
the tool bar in the Sun WorkShop main window or choose a command from the
Browse menu. The Graph Function Calls, Graph Classes, and Browse Classes
commands open the Call Graph, Class Graph, and Class Browser windows,
respectively (see Figure 3–5, Figure 3–6, and Figure 3–7).
22
Using Sun WorkShop ♦ Revision A, February 1999
Figure 3–1
Browsing Window
Browse menu
Provides commands for changing directories, starting
the graphers, rebuilding indexes, creating a tags
database, exiting the source browsing server, and
closing the browsing window.
Query menu
Provides commands for navigating matches, filtering
matches, and displaying the query history.
Find Matches button
Starts the search for matches of your query.
Next Match button
Highlights the next match in the Match pane and
shows the matching source code.
Previous Match button
Highlights the previous match in the Match pane and
shows the matching source code
Browsing Source Code
23
Pattern Search radio button
Sets the Browsing window to Pattern Search mode.
Source Browsing radio button
Sets the Browsing window to Source Browsing mode.
Match pane
Displays all matches in a scrollable pane. The total
number of matches found for the current query is
displayed immediately above the pane. Match
information is displayed from left to right with the file
name, the line number, and the text on that line.
Message footer
Displays the status of the current search or errors that
occurred during a search.
Using the Browsing Window
Two types of browsing are available through the Browsing window: pattern searches
and source browsing.
Use pattern searching when you:
4 Want to do a quick search (grep-style) for a regular expression
4 Do not have a source browsing database in the directory you want to search
4 Do not want to graphically view function call relationships or class hierarchies
4 Do not want to examine the data or member functions of a class
Use source browsing when you:
4 Have a source browsing database created by adding the -xsb option to your
compilation command or your makefile
4 Want to search for language elements such as subroutines, functions, classes,
structs, unions, and records or for their usage, definitions, or assignments
4 Want to graphically view function and subroutine call relationships, or class
hierarchies
4 Want to examine the data or member functions of a class
Pattern Search Mode
With pattern searching, you can search for regular expressions and simple text
strings using the Browsing window.
Pattern searching searches all of the directories listed in the sb_init file (see
“Importing Databases” on page 30).
24
Using Sun WorkShop ♦ Revision A, February 1999
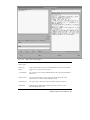
Browsing Window in Pattern Search Mode
Figure 3–2 shows the Browsing window in Pattern Search mode (see Figure 3–1 to
identify the other components of the window).
Figure 3–2
Browsing Window in Pattern Search Mode
Pattern text box
Allows you to enter a regular expression to be matched
Files text box
Allows you to specify a file filter for the search
Searching for a Pattern
To search for a pattern:
1. In the Sun WorkShop main window, choose Browse > Pattern Search or click
the Browsing button; then click the Pattern Search radio button in the
Browsing window.
2. Look in the Browsing window title bar to be sure you are in the correct
browsing directory.
Browsing Source Code
25
If not, choose Browse > Change Browsing Directory and select the correct
directory in the Pattern Search Directory dialog box.
3. Type the pattern for which you want to search in the Pattern text box.
If you cannot remember the exact symbol for which you want to search, you can
use wildcard characters (., *. ^, and $) in your pattern (see “Special Characters
in Patterns” on page 26).
4. Type a filter in the Files text box.
The default filter searches the current directory for all files ending in .h, .c, .cc,
or .f. Sun WorkShop saves the filter in your WorkSet whenever you save the
WorkSet.
Pattern searching uses the sb_init file to search multiple directories. It applies
the Files filter to each directory.
5. Press Return, choose Query > Find Matches, or click the Find Matches button.
6. Move through the Match pane using the mouse, the Next Match and Previous
Match buttons or menu items, or by pressing F5 and Shift+F5.
7. Click a match to view the source in the editor window.
Note - If you are overwhelmed by the number of matches found, restrict the
types of files searched by changing the file types in the Files text box, and repeat
the search.
You can search text displayed in the editor window. Double-click the text in the
editor window to copy it, and paste it in the Browsing window"s text box. If you are
using vi or XEmacs as your text editor, you can also select text in the editor window
and click the Find Refs button in the tool bar.
Special Characters in Patterns
Although you can enter a pattern exactly as it appears in the code, you can also use
special characters to specify a set of patterns. You can use the special characters in
Table 3–1 in patterns.
26
Using Sun WorkShop ♦ Revision A, February 1999
TABLE 3–1
Special Characters in Patterns
Character
Meaning
Example
Period (.)
Matches any character
l.nes matches all occurrences of
lanes or lines.
Asterisk (*)
Matches any number of characters,
including zero or more consecutive
occurrences of the character that
precedes it, except when it is the
first character in the pattern
file.*() matches any string that
fcontains file followed by zero or
more characters and (), such as
traffic_file_close() and
file_save_popup. *file.
matches only strings that begin
with file.
Circumflex (^)
Constrains the search to match the
beginning of a line
^tr* finds all lines that begin with
traffic, truck, or any other
string beginning with tr.
Dollar sign ($)
Constrains the search to match the
end of a line
lanes$ finds all the lines that end
with the string lanes.
For example, suppose you want to search for window_popup in the code, but only
those instances that begin a line. You would type the following query:
^window_popup*
The circumflex (^) tells the browser to look only at those matches that start a line of
code, while the asterisk (*) asks for all matches with window_popup, including
window_popup_name_objects and window_popup1_objects.
Note - Surrounding an expression with a circumflex and a dollar sign constrains the
search to match the entire line.
Source Browsing Mode
Using source browsing, you can search for language elements such as functions,
classes, structs, unions, and records or for their usage, definitions, or assignments.
You can also graphically view function call relationships or class hierarchies. And
you can examine the data or member functions of a class.
Browsing Source Code
27
Source Browsing Databases
The Source Browser obtains the information it uses from a database that describes
the static structure of your program. To use source browsing, you must first create a
source browsing database by adding the -xsb option to your compilation command
or your makefile.
The browser has different levels of functionality depending upon the database it
accesses:
Compiler-generated database
use full browser functionality
Tags-generated database
Allows queries on functions and global variables and
can display function calls. Graphing features are not
available.
No database
Must use the Pattern Search mode of the Source
Browser.
Using a tags-generated database has some advantages over using a database
generated by a compiler:
4 You can always generate a tags database, even if the source code cannot be
compiled because it is incomplete or semantically incorrect.
4 You can create a tags database much faster than running the compiler to generate
a database.
4 A tags database is much smaller than a compiler-generated database.
Generating a Browser Database
When you compile your source files with the source browser option, Sun WorkShop
creates a database containing information about the files. The Source Browser
responds to queries by searching through this database.
When you create a compiler-generated database, you can access all browsing features.
To generate the browsing database, add the source browser option to your makefile:
28
Language
Compiler Source Browser Option
C++
-xsb or -sb
ANSI C
-xsb
Using Sun WorkShop ♦ Revision A, February 1999
Language
Compiler Source Browser Option
FORTRAN 77
-xsb or -sb
Assembler
-b
Creating a Tags Database
A tags database provides a quick and convenient method for browsing source files
without compilation. The database is based on a lexical analysis of the source file. It
will not always correctly identify all language constructs, but it will operate on files
that you cannot compile.
Note - The source browsing tags are not in the same format as ctags; the tags
discussed here are in a format that works specifically with source browsing.
If you browse using a tags database, you:
4 Cannot issue queries about local variables
4 Cannot browse classes
4 Have a limited ability to issue complex queries
4 Have a limited ability to focus queries
A tags database recognizes only global definitions for variables, types, and functions,
and collects information on function calls. Function calls for C++ members are
recognized only when called explicitly.
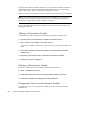
To create a tags database:
1. From the Browsing window, choose Browse > Create Tags Database.
2. In the Create Tags Database dialog box, click OK to accept the default file filter
or enter the type of files you want to scan and click OK.
The browser creates the tags database.
Searching Multiple Directories
If you keep your source files in several different directories, you are likely to execute
the compiler in each of these directories. As a result, the default compiler behavior
generates a separate source browser database in each directory.
Browsing Source Code
29
Since the Source Browser looks at only one database at a time, only the part of your
application located in the current directory is searched. You can override this default
behavior by importing databases.
Importing Databases
Instead of merging separate databases, you can import databases. Use the sb_init
file to read more than one database. You can start browsing in the same directory
that holds the sb_init file.
To import databases:
1. Identify where your sb_init file resides.
2. Add an import command to the sb_init file for each directory in which the
compiler is executed:
import absolute_or_relative_pathname
3. Set your SUNPRO_SB_INIT_FILE_NAME environment variable to point to your
sb_init file.
Add the following line to your .login file:
setenv SUNPRO_SB_INIT_FILE_NAME path to sb_init file/sb_init
Note - Use the import option to search your entire source tree for source files and
browser databases. Just add an import command to the sb_init file for each
directory in your source tree.
Note - Because pattern searching uses sb_init to search source files in multiple
directories, and source browsing uses sb_init to search browser databases (which
include object files) in multiple directories, you may want to include import
commands for both source and object directories in your sb_init file.
Browsing Window in Source Browsing Mode
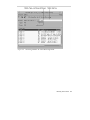
Figure 3–3 shows the Browsing window in Source Browsing mode (see Figure 3–1 to
identify the other components of the window).
30
Using Sun WorkShop ♦ Revision A, February 1999
Figure 3–3
Browsing Window in Source Browsing Mode
Browsing Source Code
31
Match list
Allows you to filter the search to specific uses of the query. You can select
from the following usage types:
All Occurrences of—No restrictions on the match type of the given entry
Uses of—Show all uses of the given entry
Definitions of— Show all definitions for the given entry
Assignments to—Show all assignments to the given entry
Match text box
Contains the query on which you want to search.
Type list
Allows you to set a filter for the entry being queried. You can select from
the following types:
All—No restrictions on the language element type of the given entry
Member/Field—Instances of the given entry as class member, or record
fields
Class/Struct/Record—Instances of the given entry as classes, structs, or
records
Static—Instances of the given entry as functions or variables that have
static storage
Function—Instance of the given entry as a function
Symbolic Constant—Constant referred to by a symbolic name; for
example, ENUM members, PARAMETER statement defined constants, set
members, and #define macros (with or without arguments)
Scope list
Allows you to restrict the search to specific elements in the source. Enter
the string for the element in the Scope text box. Shell-style expressions
are supported. You can select one of the following components:
All—No restrictions on the scope of the given entry
Program/Library—Search only in the specified program or library files
Class/Struct—Search only in the specified class or struct
Function—Search only in specified functions
Source File—Search only in the specified source files
Using Source Browsing
To use source browsing:
1. Compile the application using the -sb or -xsb option, which instructs the
compiler to generate a browsing database during compilation.
(See “Generating a Browser Database” on page 28.)
2. Choose Browse > Browse Sources, or click the Browsing button in the Sun
WorkShop main window tool bar, and then click the Source Browsing radio
button in the Browsing window.
32
Using Sun WorkShop ♦ Revision A, February 1999
3. Look in the Browsing window title bar to be sure you are in the correct
browsing directory.
If not, choose Browse > Change Browsing Directory and use the Browsing
Directory dialog box to select the directory that contains the source browser
database.
Note - You can search files in multiple directories in the browsing database. See
“Searching Multiple Directories” on page 29.
4. Type a query in the Match text box and press Return, choose Query > Find
Matches, or click the Find Matches button.
For details on writing a query, see “Composing a Query” on page 33.
5. Restrict the number of matches returned by choosing a match, type, or scope
from the appropriate pulldown list.
For information on the lists, see “Browsing Window in Source Browsing Mode”
on page 30. For detailed information on restricting a query, see “Restricting a
Query” in the Sun WorkShop online help.
6. Move through the Match pane using the mouse, the Next Match and Previous
Match buttons or menu items, or by pressing F5 and Shift+F5.
Each match line contains the name of the source file, the line number, and the text
on that line. Matches are sorted with definitions first, declarations last, and
everything else in between. Within each group, the matches are listed
alphabetically by file name, then by line number.
7. Click a match to view the source in the editor window.
8. Start the Call Grapher, Class Grapher, or the Class Browser to view
relationships in the source.
Composing a Query
When you use source browsing, a query instructs the browser to find all occurrences
of the symbol, string constant, or search pattern entered in the search field. The item
actively being searched for is called the current query.
All symbols in the code identical to the query are referred to as matches.
In general, you cannot query for reserved words. The exception is language-defined
type names in ANSI C or C++. For example, you can query on int, float, double,
or long in ANSI C or C++ programs; however, you cannot query on integer or
print in Fortran programs.
Browsing Source Code
33
You can search for a variable, function, type, constant or macro. If you are unsure of
what to browse for, begin by selecting main or another identifier used early in your
program.
Special Characters in Queries
Although you can enter a name or function exactly as it appears in the code, you can
also use wildcard characters to specify a set of character strings.
Use the wildcard characters in Table 3–2 in queries you type in the Match text box:
TABLE 3–2
Special Character in Queries
Character
Meaning
Example
period (.)
Matches any character
.ehicle matches all occurrences of
vehicle or Vehicle
asterisk (*)
Matches any number of characters,
including zero or more consecutive
occurrences of the character that
precedes it.
vehi.* matches any string that
begins with veh, such as
vehicle_length(). vehi*
matches veh but not
vehicle_length().
Using the Double Colon Operator
The double colon operator (::) qualifies a C++ member function or top-level function
with the following:
4 An overloaded name—-the same name used with different argument types
4 An ambiguous name—the same name used in different classes
The syntax is as follows:
class_name::function_name
For example, hand::grasp.
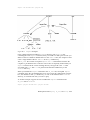
To find RW::ListPtr::insert(), the following regular expressions will work:
insert ListPtr::insert RW::ListPtr::insert
34
Using Sun WorkShop ♦ Revision A, February 1999
The first two regular expressions are equivalent to .*::.*::insert and
.*::ListPtr::insert and might match more symbols. The entry insert
matches all functions or member functions with the name insert instead of
requiring .*insert.
Source Browser Options Dialog Box
The Source Browser Options dialog box (see Figure 3–4) lets you specify:
4 The name of the cache directory that contains files that Sun WorkShop
automatically creates when you build an application
4 The name of the directory that contains configuration files (both those generated
by Sun WorkShop tools and those you may create manually)
Specifying these names sets the SUNWS_CACHE_NAME and SUNWS_CONFIG_NAME
environment variables, respectively, for the source browser engine.
Note - You can safely delete the cache directory to save disk space. It can be
automatically regenerated. Do not delete the configuration directory; it cannot be
regenerated.
If the SUNWS_CACHE_NAME or SUNWS_CONFIG_NAME variable is set to a directory
that does not exist, the dialog box opens with the corresponding default directory
selected even though you have specified a custom directory.
Browsing Source Code
35
Figure 3–4
36
Source Browser Options Dialog Box
Use Default
Cache Directory
radio button
Allows you to choose to use the default cache directory (SunWS_cache).
Custom Cache
Directory radio
buton
Allows you to name a custom cache directory. If you select the radio
button, a text box is displayed into which you can type the new directory
name, which must not be a path name.
Use Default
Config
Directory radio
button
Allows you to choose to use the default config directory
(SunWS_config).
Custom Config
Directory radio
button
Allows you to name a custom config directory. If you select the radio
button, a text box is displayed into which you can type the new directory
name, which must not be a path name.
OK
Applies changes and closes the Source Browser Options dialog box.
Apply
Applies changes without closing the Source Browser Options dialog box.
Cancel
Closes the Source Browser Options dialog box without applying changes.
Help
Displays help for the Source Browser Options dialog box.
Using Sun WorkShop ♦ Revision A, February 1999
Graphing a Function
Using the Call Grapher, you can graphically inspect the relationships of the functions
in programs using ANSI C, C++, and Fortran. You can display the functions that
either call or are called by one or more selected functions.
You must have a source browsing database to view function relationships (see
“Source Browsing Databases” on page 28).
Note - You can graph virtual functions, but you should be aware that Sun WorkShop
cannot determine the actual function that would be called. For example: If main calls
b::d(), a virtual function that could actually call b1::d() or b2::d(), Sun
WorkShop cannot tell which function is called. The graph shows main calling b::d(),
but no connection between main and b1::d() or main and b2::d().
Call Graph Window
The Call Graph window provides a graphic representation of the call relationship of
functions and subroutines. Figure 3–5 shows the Call Graph window.
To change the colors used for node background, graph pane background, node
border, node text, and arrows between nodes in the Call Graph window, edit the
WORKSHOP resource file (see “Call Graph and Class Graph Window Colors” on page
131). Any color changes you make apply to both the Call Graph and Class Graph
windows (see “Class Graph Window” on page 40).
Browsing Source Code
37
Figure 3–5
Graph menu
Provides commands for modifying the graph of the function call.
Nodes menu
Provides commands for modifying the nodes displayed.
Function text
box
Allows you to enter the function or subroutine you want to graph. Click
the arrow at the end of the Function text box to access the list of
functions and subroutines previously graphed.
Add button
Adds a node with the given function to the Call Graph pane.
Find button
Moves the Call Graph pane to show the node for the given function or
subroutine.
Call Graph pane
Displays the relationships of functions and subroutines in the source. You
can select a single function or subroutine, or multiple functions and
subroutines, and reposition them in the Call Graph pane.
Expand Left
button
38
Call Graph Window
Shows all nodes that directly call the selected node (one level of parents).
Using Sun WorkShop ♦ Revision A, February 1999
Expand Right
button
Shows all nodes called directly by the selected function or subroutine
(one level of children).
Expand Both
button
Shows all nodes directly called by and all nodes that directly call the
selected node (one level of parents and children). Double-clicking on a
node is equivalent to Expand Both.
Collapse Left
button
Hides all nodes that directly call the selected node (one level of parents).
Collapse Right
button
Hides all nodes called directly by the selected (one level of children).
Show Source
button
Displays the source file containing the selected node in an editor window.
Starts an editor if none is running.
Message footer
Reports the number of nodes displayed, the number of nodes added, and
the number of nodes not displayed, as well as error messages.
Graphing a Function or Subroutine Call
To graph a function or subroutine:
1. Click the Source Browsing radio button in the Browsing window.
2. Look in the Browsing window title bar to be sure you are in the correct
browsing directory.
If not, choose Browse > Change Browsing Directory and use the Browsing
Directory dialog box to select the directory that contains the source browser
database.
3. Choose Browse > Graph Function Calls, or select a function in the source code
or Debugging window and choose Browse > Graph Function Calls.
4. Type the name of a function or subroutine in the Function text box and click
Add or press Return.
If you do not type a function or subroutine name in the text box, the Call
Grapher defaults to main.
To display information about the function or subroutine:
4 Click a node to select it.
4 Click one of the buttons below the Call Graph pane to view the information you
want. The footer of the window displays the number of nodes added and the
number of nodes displayed out of the number that exist for the current
application.
Browsing Source Code
39
4 From the Nodes menu, choose commands for other viewing options such as
showing, hiding, expanding, or collapsing nodes (see “Showing or Hiding Nodes”
on page 43).
4 Display the source of the class by selecting it in the Call Graph pane and choosing
Show Source from the Nodes menu.
Note - You can change the display of the Call Graph using the commands on the
Graph menu (see “Changing the Look of a Call or Class Graph” on page 43). You
can also print the Call Graph, as described in “Printing a Graph” on page 45.
Graphing Classes
Using the Class Grapher, you can graphically inspect the inheritance structure of
classes in C++ programs.
Class Graph Window
The Class Graph window provides a graphic representation of class hierarchies.
Figure 3–6 shows the Class Graph window.
To change the colors used for node background, graph pane background, node
border, node text, and arrows between nodes in the Class Graph window, edit the
WORKSHOP resource file (see “Call Graph and Class Graph Window Colors” on page
131). Any color changes you make apply to both the Class Graphi and Call Graph
windows (see “Call Graph Window” on page 37).
40
Using Sun WorkShop ♦ Revision A, February 1999
Figure 3–6
Class Graph Window
Graph menu
Provides commands for modifying the graph of the class hierarchies.
Nodes menu
Provides commands for modifying the nodes displayed.
Class text box
Allows you to enter the class you want to graph. Click the arrow at the
end of the Class text box to access the list of classes previously graphed.
Add button
Adds a node with the given class to the Class Graph pane.
Find button
Moves the ClassGraph pane to show the node for the given class.
Class Graph
pane
Displays a graphical presentation of class hierarchies.
Expand Left
button
Shows all parent classes of the selected class (one level of parents).
Expand Right
button
Shows all child classes of the selected class (one level of children).
Browsing Source Code
41
Expand Both
button
Shows all parent and child classes of the selected class (one level of
parents and children).
Collapse Left
button
Hides all parent classes of the selected class (one level of parents).
Collapse Right
button
Hides all child classes of the selected class (one level of children).
Collapse Both
button
Hides all parent and child classes of the selected class (one level of
parents and children).
Show Source
button
Displays the source file containing the selected class in an editor window.
Sun WorkShop starts an editor if one is not presently open.
Message footer
Reports the number of nodes displayed, the number of nodes added, and
the number of nodes not displayed, as well as error messages.
Graphing a Class Hierarchy
To graph a class hierarchy:
1. Choose Browse > Graph Classes, or select a class in the source code or
Debugging window and choose Browse > Graph Classes.
2. Type a class name in the Class text box and click Add Current Class or press
Return.
To display information about a class:
4 Click a node to select it.
4 Click one of the buttons below the Class Graph pane to display the information
you want. The footer of the window displays the number of nodes added and the
number of nodes displayed out of the number that exist for the current function.
4 From the Nodes menu, choose commands for other viewing options such as
showing, hiding, expanding, or collapsing nodes (see “Showing or Hiding Nodes”
on page 43).
4 Select a node and click Show Source to view the source in the editor window.
Note - You can change the display of the Class Graph window using the commands
on the Graph menu (see “Changing the Look of a Call or Class Graph” on page 43).
You can also print the class graph, as described in “Printing a Graph” on page 45.
42
Using Sun WorkShop ♦ Revision A, February 1999
Changing and Printing Graph Displays
The commands in the Graph and Nodes menus of the two grapher windows allow
you to magnify or shrink the graph; expand, collapse, show, or hide nodes; and print
the graph.
Changing the Look of a Call or Class Graph
You can change the magnification and rearrange the layout of your nodes to vary
your view of the graph. If you want to get a birds-eye view of a graph, you can
shrink it. You can also fit the entire graph into the window.
To enlarge the graph, choose Graph > Magnify. Use the scrollbars to view the entire
display or resize the window. You can incrementally enlarge the graph with the
Magnify command.
To reduce the graph, choose Graph > Shrink. You can shrink the graph until it is
reduced to a dot on the pane. Reset it to a readable size with the Reset Magnification
command.
To see the entire graph, choose Graph > Fit to Window. The graph shrinks or
enlarges to fit within the pane. If you resize the window, choosing Fit to Window
will resize the graph to fit within the new size of the pane.
To reset the magnification, choose Graph > Reset Magnification. If you changed the
size of the graph, use this command to reset the display to its original size. You
might have to use the scrollbars to find the location of the graph in the pane.
Showing or Hiding Nodes
You can simplify a complicated graph by showing only relevant nodes and hiding
the rest of the nodes in the background. You can view just nodes that have nodes
connected to them, or those with connected nodes in only one direction.
Expanding Nodes
Nodes that are expandable appear with a thicker box border. Double-clicking these
nodes displays the child and parent nodes (do the same thing by choosing Expand
Both).
To expand nodes:
Browsing Source Code
43
1. Select one or more nodes by holding down the Shift key and clicking on each
node.
2. From the Nodes menu, choose one of the Expand commands, or double-click
on the node to expand a single node in both directions.
Showing Nodes
To show all nodes in the database, choose Nodes > Show All.
To restore a previous node:
1. Click the arrow button at the end of the Function or Class text box to open the
history list.
2. Click the desired function name or class name to return the node to the pane.
Only the original nodes for the selected item are redisplayed in the pane. The
relationship of the chosen node to other nodes must be reconstructed.
Hiding Nodes
To hide nodes, choose one of the following commands from the Nodes menu:
Hide Selected
Hides the selected nodes from view.
Hide
Non-Selected
Hides all nodes but selected nodes from view
Hide
Unconnected
Hides all nodes that do not have connections to another node. You don"t
have to select a node to use this command.
To clear all nodes from the pane, choose Nodes > Clear All.
Changing the Node Layout
You can set default options to:
4 Display the nodes vertically instead of using the horizontal default.
4 Change the lines connecting the nodes to arrows to exemplify the directional flow
from one node to another.
4 Display function names in short or long form. The long form shows the function
name and its argument-type signature. For example:
44
Using Sun WorkShop ♦ Revision A, February 1999
Short form
handler_load_save
Long form
handler_load_save(unsigned long, inputevent)
To change the layout of the nodes:
1. Choose Graph > Options.
2. Choose from among the following:
Graph Layout
Select horizontal or vertical
Use
Arrowheads
Select yes or no
Function
Names
Select short or long (Call Grapher only)
3. Click OK.
To reset the layout, choose Graph > Reset Layout. All nodes return to their original
positions in the graph. You can select nodes and drag them to other positions in the
pane.
To select multiple nodes in the graph, hold down the Shift key and click each
additional node.
Printing a Graph
You can print the graph display from either the Call Graph or Class Graph window.
To print the graph:
1. Choose Graph > Print to open the Print Graph dialog box.
2. Type the number of copies and select the print parameters.
3. Type the name of the printer or the name of a file to which to print.
4. Click OK.
Browsing Source Code
45
Browsing Classes
Using the Class Browser, you can:
4 Browse a class—Show the class list and data function members. View class
interfaces and relationships.
4 Examine class relationships—Select a class and examine its base, derived, and
friend classes. Browse classes, structs, and unions referenced in the current class.
4 Graph a class—Graph the class hierarchy of a class selected in the Class Browser
window.
4 Show the source of a class—Show the source of a particular class in an editor
window.
Class Types that Can Be Examined
When you open the Class Browser window (see Figure 3–7), the Browser list contains
all classes of the type Class or Struct in the current source browser database.
Using the two checkboxes to the right of the Browser list, you can show all types,
just the classes and structs, or just the Unions.
Class Browser Window
You can view information about classes and their member and friend functions in
the Class Browser window. By navigating through the classes in the source code and
libraries, you can understand how the classes were defined and used. Figure 3–7
shows the Class Browser window.
46
Using Sun WorkShop ♦ Revision A, February 1999
Figure 3–7
Class Browser Window
Class menu
Provides commands for opening another Class
Browser window, displaying the source for a selected
class, and closing the Class Browser window.
View menu
Provides a list of member and friend functions to
examine.
Name text box
Allows you to enter the name of the class, struct, or
union to examine. Click the arrow at the end of the
text box to access a list of previously entered items.
Browsing Source Code
47
Browse button
Displays information about the selected class in the
Description pane.
Browser list
Displays all of the class types you can examine. Click
a class in the list to select it and the class name
appears in the Name text box. The Classes/Structs and
Unions checkboxes determine the class types shown.
Classes/Structs checkbox
Shows user-definable types, and any class declared
with the class-key struct, in the Browser list. All C and
C++ style structs are listed. Its members and base
classes are public by default.
Unions checkbox
Shows classes declared with the class-key union in the
Browser list; it can contain objects of different types at
different times. All C and C++ style unions are listed.
Description pane
Displays information about the given language
element.
Back button
Displays information about the class you selected
before the currently displayed class.
Forward button
Displays information about the class you selected after
the currently displayed class.
Message footer
Displays messages about operations in the Class
Browser window.
Browsing a Class
To browse a class, do the following:
1. Choose Browse > Browse Classes, or select a class in the source code or
Debugging window and choose Browse > Browse Classes.
2. Type the name of a class in the Name text box, or select a class from the
Browser list. Click the Classes/Structs and Unions checkboxes to filter the
classes and data function members listed, and click Browse.
To view information about the class, click an underlined base or derived class in the
Description pane. Use the Back and Forward buttons to redisplay information about
about the class you selected before or after the currently displayed class, respectively.
To view the source in the editor window, select a line (or a portion of a line)
containing a data member or friend function in the Description pane and click Show
Source.
48
Using Sun WorkShop ♦ Revision A, February 1999
Browsing Classes in Multiple Windows
Opening multiple browsing windows can help you examine and compare several
classes at a time. Any Class Browser windows opened in the same browsing session
share the same class list but do not share properties or class histories.
To open a new Class Browser window, do one of the following:
1. From the Class Browser, choose Class > Browse in New Window.
1. From the Class Grapher, select a class node and choose View > Show in Class
Browser.
1. From the Browsing window, turn on Source Browsing and choose Browse >
Browse Classes.
Relationship of Browsers and Graphers
Figure 3–8 shows how the Browsing window, the Call Graph window, the Class
Graph window, and the Class Browser window interrelate.
Browsing Source Code
49
Figure 3–8
How Browsing, the Graphers, and the Class Browser Interrelate
Exiting Browsing
To quit the current browsing process and close all browsing windows, choose Browse
> Exit Browsing in the Browsing window.
If you want to close the Browsing windows without killing the current browse
process, choose Browse > Close.
50
Using Sun WorkShop ♦ Revision A, February 1999
CHAPTER
4
Building Programs in Sun Workshop
Sun WorkShop provides you with the ability to run one build job at a time or several
build jobs concurrently. This chapter shows you how to quickly build a single
application, how to customize a build, and how to fix build errors using the Building
window and the Sun WorkShop editor of your choice.
This chapter is organized into the following sections:
4 “Building a Sun WorkShop Target” on page 51
4 “Building Window” on page 52
4 “Building a Program” on page 54
4 “Modifying a WorkShop Target” on page 59
4 “Removing a WorkShop Target” on page 59
4 “Customizing a Build” on page 59
4 “Fixing Build Errors” on page 69
4 “Running a Distributed Build” on page 73
4 Exiting Building
Building a Sun WorkShop Target
When you build a program in Sun WorkShop, you are actually building a WorkShop
target, which is an object derived from the following:
4 Build directory—The directory from which the build process is invoked and also
the default directory for the makefile.
4 Build command—The command that invokes the make utility, which reads the
makefile and builds the make targets.
51
4 Makefile—A file that contains entries that describe how to bring a make target up
to date with respect to those files on which it depends (called dependencies). Since
each dependency is a make target, it may have dependencies of its own. Targets
and file dependencies and subdependencies form a tree structure that make traces
when deciding whether or not to rebuild a make target.
4 Make target—An object that make knows how to build from the directions (rules)
contained in a particular makefile. For example, a make target could be all or
clean. Makefiles are generally designed so that the default target (the one you get
when you do not specify a target) is the most commonly built target.
When a WorkShop target is built, it is added to the list of WorkShop targets in the
Build menu and in the Edit Target command. When you begin a build, Sun
WorkShop looks for the first target in the WorkShop target list and builds it.
For information on the make utility, makefiles, and make targets, see Appendix B.”
Building Window
The Building window displays information on program compilation. You can open
the window by choosing Build > Show Build Window in the Sun WorkShop main
window or by starting a build operation.
From the Building window, you can:
4 Stop a build in progress
4 Edit build parameters
4 Save the build output to another file
4 View build errors
Figure 4–1 shows the Building window.
52
Using Sun WorkShop ♦ Revision A, February 1999
Figure 4–1
Building Window
Build menu
Provides commands for common build operations
Edit menu
Provides commands to accumulate data and to clear
the Build Output Display pane
View menu
Provides commands for navigating build errors in the
Build Output Display pane and for viewing
information on multiple build processes when running
a distributed make
Build button
Begins a build of the current WorkShop target
Stop Build button
Stops the current build in progress
Previous Error button
Moves the cursor to the previous build error in the
Build Output Display pane and shows that error
location in the text editor
Building Programs in Sun Workshop
53
Next Error button
Moves the cursor to the next build error in the Build
Output Display pane and shows that error location in
the text editor
Dmake Jobs Graph button
Opens the Dmake Jobs Graph window
Directory status field
Displays the path name of the current build directory
Target status field
Displays the name of the current make target
Build Output Display pane
Displays output for the current build operation
Build Information field
Displays information about the current build
Building a Program
You can begin a build without having to specify a build command, makefile, or
target. Or you can specify one or all of these. You can also customize a build by
specifying make options, specifying a build mode, overriding makefile macros, or
editing environment variables (see “Customizing a Build” on page 59).
Define New Target and Edit Target Dialog Boxes
You specify build parameters using the Define New Target and Edit Target dialog
boxes, which are basically identical. You use the Define New Target dialog box to
specify a new WorkShop target and the Edit Target dialog box to modify an existing
WorkShop target. Figure 4–2 shows the Define New Target dialog box.
54
Using Sun WorkShop ♦ Revision A, February 1999
Figure 4–2
Define New Target Dialog Box
Directory text box
Lets you type a build directory path. You can also
select a directory by clicking on the browse button.
Makefile text box
Lets you specify a makefile (the default file name is
makefile or Makefile. You can also select a
makefile by clicking on the browse button.
Target text box
Lets you specify a make target. You can also select a
target by clicking on the browse button.
Browse (..) buttons
Let you display dialog boxes in which you can choose
a build directory, makefile, or make target
Command text box
Lets you type a make command; the default command
is dmake (described in “Running a Distributed Build”
on page 73).
Options button
Opens the Make Options dialog box (see “Specifying
Make Options” on page 60). The Make Options dialog
box allows you to modify the parameters of a build
using the options provided.
Macros button
Opens the Make Macros dialog box (see “Using
Makefile Macros” on page 64), which allows you to
add, change, or delete macros to be passed into the
build.
Environment Variables button
Opens the Environment Variables dialog box (see
“Using Environment Variables” on page 67), which
allows you to add, change, or delete environment
variables to be passed into the build.
Building Programs in Sun Workshop
55
OK button
Applies the build parameters and closes the dialog
box.
Apply button
Applies the build parameters.
Build button
Applies the build parameters and builds the target.
Cancel button
Closes the dialog box without applying changes.
Help button
Displays online help for the dialog box.
Building With Default Values
You can begin a build without having to specify a build command, makefile, or
target. Sun WorkShop provides a default makefile name (makefile), a default make
target, and a default make command, dmake (see “Running a Distributed Build” on
page 73). All you need to supply is the path name for the build directory.
Default Makefile and Make Target
The Define New Target dialog box contains the value Default in the Makefile and
Target text boxes. If you do not specify a particular makefile or make target, Sun
WorkShop looks for a file named makefile in the build directory and uses the first
make target in that makefile. However, if make finds an SCCS history file
(s.makefile) that is newer than the file named makefile, Sun WorkShop uses the
most recent version of s.makefile. If makefile does not exist, Sun WorkShop
searches for a file named Makefile. Again, if an SCCS history file (s.Makefile)
exists that is newer than Makefile, Sun WorkShop uses the most recent version of
s.Makefile.
Using Default Values
To build a program using default build values:
1. Look in the Directory status field in the Building window to be sure you have
the correct build directory set.
2. If the current build directory is correct, click the Build button, choose Build >
Build in the Sun WorkShop main window or the Building window, or select a
WorkShop target from the list at the bottom of the Build menu in either
window.
3. If no build directory is displayed in the Directory status field or you want to
change build directories, choose Build > New Target to open the Define New
Target dialog box. Type the build path in the Directory text box.
56
Using Sun WorkShop ♦ Revision A, February 1999
You can also click the browse button to open a directory chooser. Choose a
directory in the list and click OK to load it into the Directory text box. Then click
Build at the bottom of the dialog box.
The build output is displayed in the Build Output display pane in the Building
window. Click the Stop Build button in the Building window or choose Build > Stop
Build to stop the build process.
Note - The next time you open the Building window, the build directory is set to the
last directory in which you ran a build job. You can see the path name in the
Directory status field.
Building With Nondefault Values
If you have a makefile with a unique name, a certain make target, or a specific build
command, specify it in the Define New Target dialog box or Edit Target dialog box
by clicking on the appropriate browse button (see Figure 4–2). Each browse button
displays a dialog box.
1. Type the name of the directory in which you want to build and click Apply to
apply the change.
You can also select another directory from the Set Build Directory dialog box. If
you have not specified a build directory, Sun WorkShop either tries to build in the
directory currently displayed in the build directory field or, if no directory is
displayed, displays an error message pop-up window.
2. Type the name of the makefile you want in the Makefile text box.
If you want to choose another makefile from the current build directory, type the
name of the makefile in the Makefile text box, or choose a makefile from the list
in the Set Makefile dialog box, and click OK.
You can run your build in a directory that is different from the one the makefile is
in. Just specify the full path name of the makefile in the Makefile text box.
3. Type the name of the make target you want in the Target text box.
Type the name of the make target in the Target text box, or choose another make
target in the current makefile in the Target Chooser dialog box, and click OK.
4. Type the name of the build command you want in the Command text box.
If the build command you specify is something other than make or dmake, you
can specify the command and any of its arguments in the Command text box.
The build command is formed by prepending setenv commands for any
environment variables specified through the Environment Variables dialog box
Building Programs in Sun Workshop
57
and by appending any of the make options specified through the Make Options
and Make Macros dialog boxes.
Note - If the path to the build command is not in your PATH environment
variable, you might have to specify the full command path.
5. Click Build in the dialog box to start a build with the settings you supplied.
The build output is displayed in the Build Output display pane in the Building
window. Click the Stop Build button in the Building window or choose Build > Stop
Build to stop the build process.
Collecting Build Output
Build output is cleared from the Build Output display pane each time you run a
build job. You can keep the build output from previous builds by setting the
Accumulate Output switch to on.
To collect build output, choose Edit > Accumulate Output.
The Accumulate Output command toggles the switch on and off. When a build is
performed, output for that build is displayed below the output for the previous
build. You can scroll through the pane to see the output for each build. To identify
specific build jobs, each build output begins with the build path and the name of the
build target.
To clear the build output log, choose Edit > Clear Results.
Saving Build Output
You can maintain a history of build output information for one or more build jobs by
saving the output to a file.
To save build output:
1. Choose Build > Save Output As.
2. Choose or create a file in which to save the output using the Save Build Output
dialog box.
The build output log is saved as a text file.
58
Using Sun WorkShop ♦ Revision A, February 1999
Modifying a WorkShop Target
To edit an existing WorkShop target, choose Build > Edit Target and choose a
WorkShop target from the list. The Edit Target dialog box opens, displaying the
current settings for the build directory, makefile, make target, and build command.
Edit any of these fields, as described in “Building With Nondefault Values” on page
57. Click Build to rebuild the WorkShop target with your new settings.
Removing a WorkShop Target
You can remove targets from the WorkShop target list and the Edit Target list in the
Build menu.
To remove a target:
1. Choose Build > Remove targets from menu in either the Sun WorkShop main
window or the Building window.
2. Select one or more targets from the list in the Remove targets from menu
dialog box.
Hold down the Control key and click to select more than one target name.
3. Click OK.
Customizing a Build
You can customize a build by changing make options, specifying a build mode,
using makefile macros, or using environment variables. To customize a build, choose
Build > Edit Target and choose a WorkShop target from the list. The Edit Target
dialog box opens. After making your changes, click Build to rebuild the WorkShop
target with your new settings.
Building Programs in Sun Workshop
59
Specifying Make Options
You can specify make options using the Options dialog box, shown in Figure 4–3.
Figure 4–3
Options Dialog Box
Category list
Allows you to select a category of make options.
OK button
Applies the changes and closes the dialog box
Apply button
Applies the changes but leaves the dialog box open
Cancel button
Closes the dialog box without applying changes
Help button
Displays online help for the dialog box
Table 4–1 describes the make options you can set using the dialog box.
60
Using Sun WorkShop ♦ Revision A, February 1999
TABLE 4–1
Options That You Can Set in the Options Dialog Box
Category
Option
Basic
Echo command lines but do not execute them (-n)
When an error occurs, continue with dependency branches that do not
depend on the target (-k).
Execute
Commands and
Display
Display reasons why make chooses to rebuild a target; make displays any
and all dependencies that are newer. The make displays options are also
read in from the MAKEFLAGS environment variable (-d).
Display detailed information on the dependency check and processing
(-ss).
Display the text of the makefiles read in (-D).
Display the text of the makefiles, make.rules file, the state file, and all
hidden-dependency reports (-DD).
Silent mode. Do not echo command lines before executing them.
Equivalent to the special-function target .SILENT: (-s).
Display instead
of executing
Print the complete set of macro definitions and target descriptions (-p).
Report dependencies only, do not build them (-P).
Question mode. make returns a zero or nonzero status code depending
on whether or not the target file is up to date (-q).
Miscellaneous
Touch the target files (making them appear up to date) instead of
performing their rules. This procedure can be dangerous when files are
maintained by more than one person. When the .KEEP_STATE: target
appears in the makefile, this option updates the state file just as if the
rules had been performed (-t).
Do not use the default rules in the default makefile
/usr/share/lib/make/make.rules (-r).
Let environment variables override macro definitions within makefiles
(-e).
Ignore error codes returned by commands. Equivalent to the
special-function target .IGNORE: (-i).
Distributed
Make
Mode: Choose the type of make process to run: serial, parallel, or
distributed (see “Specifying a Build Mode” on page 62) (-m).
Building Programs in Sun Workshop
61
TABLE 4–1
Category
Options That You Can Set in the Options Dialog Box
(continued)
Option
Maximum jobs: Specify the maximum numbers of jobs that are
distributed to the build servers (-j).
Runtime configuration file: Specify a runtime configuration file.
Build server group: Specify the name of the server group to which jobs
are distributed.
Temporary output directory: Specify the name of the directory to which
temporary output is to be written.
To specify a make option:
1. Click Options to open the Options dialog box.
2. Select the options you want from the Options dialog box.
Click the Category list to select a category of make options. The Options dialog
box gives you access to all the options to make and dmake. For information on
the distributed make options, see “Specifying a Build Mode” on page 62.”
3. Click Build to apply the options and start the build.
You can also specify make options through the Define New Target dialog box
available from the New Target command in the Build menu.
Specifying a Build Mode
To change the default build mode of dmake from serial to parallel or distributed::
1. Click Options to open the Options dialog box.
2. Select the Distributed Make category from the Category list.
3. Click the build mode you want and fill in any required text boxes in the
Options dialog box, as shown in Figure 4–4.
4. Click Build to set the options and start the build.
62
Using Sun WorkShop ♦ Revision A, February 1999
Figure 4–4
Options Dialog Box for Build Mode
Serial Mode
To build in serial mode, you simply click the serial radio button. There are no text
boxes for you to fill in.
Parallel Mode
To build in parallel mode, click the parallel radio button. Then specify the maximum
number of build jobs to be run in the Maximum jobs text box. If you do not specify a
maximum number of jobs, dmake uses two as the default.
Distributed Mode
To build in distributed mode, click the distributed radio button. Then specify the
maximum number of build jobs to be run in the Maximum jobs text box. If you do
not specify a maximum number of jobs, dmake uses the sum of the jobs specified for
the servers in the group.
If you choose not to use the default name and location provided in the Runtime
configuration file text box, type the name or path of your .dmakerc file (see
“.dmakerc File” on page 74) in this text box.
If you do not type the name of a group in the Build server group text box, dmake
uses the first group listed in the .dmakerc file. When running in distributed mode,
dmake distributes jobs to the following groups in order of precedence):
Building Programs in Sun Workshop
63
1. The group specified on the command line as an argument to the -g option
2. The group specified by the DMAKE_GROUP makefile macro
3. The group specified by the DMAKE_GROUP environment variable
4. The first group specified in the runtime configuration file
If you do not choose to use the default name and location provided in the Temporary
output directory text box, type the name of an output directory in this field.
For more information on distributed builds, see “Running a Distributed Build” on
page 73.
Using Makefile Macros
Makefile macros let you refer conveniently to files or command options that appear
more than once in the description file. (For information on defining macros, see
Appendix B.)
Using the Make Macros dialog box (see Figure 4–5), you can add makefile macros to
or delete them from the Persistent Build Macros list in your WorkShop target, and
then reassign values for makefile macros in the list. You can also add macros
currently defined in the makefile to the list and override their values.
All macros in the Persistent Build Macros list are saved with your WorkSet.
To open the Make Macros dialog box, click Macros in the Edit Target dialog box.
64
Using Sun WorkShop ♦ Revision A, February 1999
Figure 4–5
Make Macros Dialog Box
Persistent Build
Macros pane
Lists macros that will be saved with your WorkSet
More/Less
button
More opens the Filter text box and Makefile Macros list pane; the button
toggles to Less, which closes the pane
<<Add button
Lets you add a macro in the Makefile Mactros list to the Persistent Build
Macros list
Name text box
Lets you assign a name to a new macro or change the name of the
selected macro on the Persistent Build Macros list
Value text box
Lets you assign a value to the macro named in the Name text box
Add button
Adds the macro defined in the Name and Value text boxes to the
Persistent Build Macros list
Building Programs in Sun Workshop
65
Change button
Applies the values in the Name and Value text boxes to the selected
macro on the Persistent Build Macros list
Delete button
Deletes the selected macro on the Persistent Build Macros list
Delete All
button
Deletes all macros on the Persistent Build Macros list
Clear button
Clears the Name and Value text boxes
Filter text box
Lets you type a search pattern to filter the Makefile Macros list
Makefile Macros
list
Lists the macros defined in the makefile in the current WorkSet
OK button
Applies the changes and closes the dialog box
Apply button
Applies the changes but leaves the dialog box open
Cancel button
Closes the dialog box without applying changes
Help button
Displays online help for the dialog box
Adding a Macro
To add a macro to the Persistent Build Macros list:
1. Type the name of a macro in the Name text box.
2. Type a value for the macro in the Value text box.
If you make a mistake, click Clear to remove entries in the Name and Value text
boxes.
3. Click Add to add the new macro to the list.
4. Repeat the previous three steps to add other macros.
5. Click OK to close the dialog box.
Deleting a Macro
To delete a macro from the Persistent Build Macros list:
1. Select a macro in the list.
2. Click Delete (Delete All removes all macros in the list).
66
Using Sun WorkShop ♦ Revision A, February 1999
3. Click OK to establish the change and close the dialog box.
Changing a Macro
To change the value of a macro in the Persistent Build Macros list::
1. Select a macro in the list.
2. Type a new value in the Value text box and click Change.
3. Click OK to establish the change and close the dialog box.
4. Click Build in the Edit Target dialog box to start the build with the new values.
Reviewing and Overriding Makefile Macros
A macro definition that appears in the Persistent Build Macros list overrides any
macro with the same name that appears in the makefile.
To review the current macro definitions, click More to open the Makefile Macros list,
which displays all the macros that are defined in the makefile associated with the
build target. You can filter the list using the Filter text box.
To override the value of a makefile macro:
1. Select a macro in the Makefile Macros list.
2. Click <<Add to add the macro to the Persistent Build Macros list.
3. Type a new value in the Value text box and click Change.
4. Click OK to establish the change and close the dialog box.
The macro definition in the Persistent Build Macros list overrides the macro
definition in the makefile, and is saved with your WorkSet.
5. Click Build in the Edit Target dialog box to start the build with the new values.
Using Environment Variables
You can specify environment variables for your build. When you start the build,
setenv commands for these environment variables are prepended to the build
command.
Building Programs in Sun Workshop
67
Using the Environment Variables dialog box, you can add environment variables to
or delete them from the Persistent Environment Variables list in your WorkShop
target, and reassign values for environment variables in the list.
All macros in the Persistent Environment Variables list are saved with your WorkSet.
Note - The Persistent Environment Variables list for building your program is not
the same as the Persistent Environment Variables list for running your program
described in “Setting Environment Variables” on page 90.
To open the Environment Variables dialog box, click Environment Variables in the
Edit Target dialog box.
Adding an Environment Variable
To add an environment variable to the Persistent Environment Variables list::
1. Type the name of an environment variable in the Name text box.
2. Type a value for the variable in the Value text box.
If you make a mistake, click Clear to remove entries in the Name and Value text
boxes.
3. Click Add to add the environment variable to the Persistent Environment
Variables list.
4. Repeat the previous three steps to add other environment variables.
5. Click OK to close the dialog box.
Deleting an Environment Variable
To delete a variable from the Persistent Environment Variables list:
1. Select a variable from the list.
2. Click Delete (Delete All removes all environment variables in the list).
3. Click OK to establish the change and close the dialog box.
Changing the Value of an Environment Variable
To change the value of an environment variable in the Persistent Environment
Variables list:
68
Using Sun WorkShop ♦ Revision A, February 1999
1. Select an environment variable in the list.
2. Type a new value in the Value text box and click Change.
3. Click OK to establish the change and close the dialog box.
4. Click Build to start the build with the new build environment.
Reviewing and Overriding Environment Variables
An environment variable definition that appears in the Persistent Environment
Variables list overrides any environment variable with the same name that appears
in the current WorkShop process environment.
To review the current WorkShop process environment variable definitions, click More
to open the Current Environment list, which includes all the environment variables
that are currently defined in the WorkShop process environment. You can filter the
list using the Filter text box.
To override the value of an environment variable:
1. Select an environment variable in the Current Environment list.
2. Click <<Add to add the environment variable to the Persistent Environment
Variables list.
3. Type a new value in the Value text box and click Change.
4. Click OK to establish the change and close the dialog box.
The environment variable definition in the Persistent Environment Variables list
overrides the environment variable definition in the current WorkShop process
environment, and is saved with your WorkSet.
5. Click Build in the Edit Target dialog box to start the build with the new values.
Fixing Build Errors
The process of fixing build errors is simplified by the integration of the text editor
with the build process. When a build fails, the build errors are displayed in the Build
Output display pane of the Building window, as shown in Figure 4–6. Build errors
Building Programs in Sun Workshop
69
that have links to the source files containing the errors are highlighted and
underscored. Unrecognized errors are displayed with the rest of the build output
without highlighting or underscoring.
Note - Do not run a build job and a fix (recompilation of edited source files)
concurrently. The output for both jobs intermingles in the Build Output display pane
in the Building window. It can be difficult to discern the output of one job from the
other.
Figure 4–6
Build Errors in the Build Output Display Pane
Each error line gives the name of the file containing the error, the line number on
which the error occurs, and the error message.
Error messages issued by the C compiler include an additional glyph (
) in the build error message. Clicking on the glyph opens a pop-up window that
defines the associated error message.
70
Using Sun WorkShop ♦ Revision A, February 1999
Figure 4–7
Error Message Pop-up Window
Note - Only Sun compilers produce output that can be converted to hypertext links.
If you use a build command that does not call Sun compilers, you will not have links
to the source files from the build errors listed in the Building window.
Displaying the Source of an Error
Clicking on the underscored error immediately starts a text editor that displays the
source file containing the error. The source file is shown with the error line
highlighted and an error glyph appears to the left of the line (see Figure 4–8).
Note - By using the keyboard shortcuts F4 (next error) and Shift+F4 (previous error)
to navigate through the build errors, you can keep focus on the text editor window.
Building Programs in Sun Workshop
71
Figure 4–8
Text Editor Window Displaying Source File With Error
Fixing an Error
The following steps show how you can use the Building window and the text editor
to quickly fix build errors:
1. Click a highlighted error in the Build Output display pane.
The editor window opens, displaying the source file containing the error. You do
not have to search for the line containing the error—the error line is highlighted
in the editor and the cursor is already positioned at the line. The error message is
repeated in the footer of the text editor.
72
Using Sun WorkShop ♦ Revision A, February 1999
2. In the text editor, make sure the source file can be edited.
If the file is under SCCS control, check it out using the appropriate menu
commands in the text editor:
4 In the vi editor, choose Version > Checkout.
4 In the XEmacs editor, choose Tools > VC > Check out File file.
4 In the GNU Emacs editor, choose Tools > Version Control > Check Out.
3. Edit the source file containing the error.
4. In the Building window, click the Next Error button in the tool bar (or use the
keyboard shortcut F4) to go to the location of the next build error in the text
editor.
As you click Next Error, notice how each successive error in the build output is
highlighted and how the corresponding source line in the text editor is also
highlighted.
5. Save the edited file.
4 In the vi editor, choose File > Save.
4 In the XEmacs editor, choose File > Save file.
4 In the GNU Emacs editor, choose Files > Save buffer.
6. If the file is under SCCS control, check it in using the appropriate menu
commands in the text editor:
4 In the vi editor, choose Version > Checkin.
4 In the XEmacs editor, choose Tools > VC > Check in File file.
4 In the GNU Emacs editor, choose Tools > Version Control > Check In.
7. Click the Build button in the text editor’s tool bar to rebuild.
You can also build by clicking on the Build button in the Building window’s tool
bar or using the keyboard shortcut F3.
You can watch the Build Output display pane to follow the progress of the build.
Running a Distributed Build
Distributed Make (dmake) allows you to concurrently distribute the process of
building large projects, consisting of many programs, over a number of workstations
and, in the case of multiprocessor systems, over multiple CPUs. For a full description
of Distributed Make, see Appendix C.”
Building Programs in Sun Workshop
73
The default Sun WorkShop build command (dmake) provides three different build
modes:
4 Serial mode - dmake executes one job at a time on the local host (similar to make)
4 Parallel mode - dmake executes multiple jobs concurrently on the local host
4 Distributed mode - dmake executes multiple jobs over several build servers
In distributed mode, you can concurrently distribute over several servers the process
of building large projects that consist of many programs. dmake parses your
makefiles, determines which targets can be built concurrently, and distributes the
build for those targets over a number of build servers designated by you.
By default, dmake runs in serial mode. You can set it to run in parallel or distributed
mode in the Options dialog box (see “Specifying Make Options” on page 60).
Preparing for a Distributed Build
Before running a distributed build for the first time, you must create a configuration
file that specifies which machines are to participate as dmake build servers. In
addition, before a machine can be used as a build server, it must be configured to
allows jobs to be distributed to it.
A build server should be of the same architecture and running the same operating
system version as the dmake host. Be default, it is assumed that the path to the
dmake executables is the same for the dmake host as it is for the build server. If it is
not, you must customize the path attribute for that server (for further details see the
dmake(1) man page).
.dmakerc File
The .dmakerc file is a runtime configuration file. You must set up a runtime
configuration file to run a distributed build. The file contains groups (lists) of build
servers and the number of jobs distributed to each build server. The dmake utility
searches for this file on the dmake host to know where to distribute jobs. Generally,
this file is in your home directory.
You may enclose the names of groups and hosts in the .dmakerc file in double
quotes. Doing so allows more flexibility with respect to the character sequences that
may be part of the group and host names. For example, if the name of a group starts
with a digit it should be double-quoted:
group "123_sparc"
74
Using Sun WorkShop ♦ Revision A, February 1999
The dmake utility searches for a runtime configuration file in the following locations
and in the following order:
4 The path name specified on the command line using the -c option
4 The path name specified with the DMAKE_RCFILE makefile macro
4 The path name specified with the DMAKE_RCFILE environment variable
4 $(HOME)&/.dmakerc
If dmake does not find a runtime configuration file, it distributes two jobs to the local
host.
For information on setting up a runtime configuration file, see the dmake man page.
The following is a sample of a simple runtime configuration file where jupiter,
venus, saturn, mercury, and pluto are listed as build servers:
# My machine. This entry causes dmake to distribute to it.
jupiter { jobs = 1 }
venus
# Manager"s machine. She"s usually at meetings.
mercury { jobs = 4 }
pluto
The following runtime configuration file contains groups:
earth
{ jobs = 2 }
mars
{ jobs = 3 }
group sunos4.x {
host parasol
host summer
}
group lab1 {
host falcon
{ jobs = 3
host hawk
host eagle
{ jobs =
}
group lab2 {
host heron
host avocet
{ jobs = 3
host stilt
{ jobs = 2
}
group labs {
group lab1
group lab2
}
group sunos5.x
group labs
host jupiter
host venus
[ jobs =
host pluto
{ jobs =
}
}
3 }
}
}
2 }
3 }
Building Programs in Sun Workshop
75
dmake.conf File
To set up a machine to be used as a build server, you must create a configuration file
called /etc/opt/SPROdmake/dmake.conf file on the server’s file system.. Without
this file, dmake refuses to distribute jobs to that machine.
In the dmake.conf file, you specify the maximum number of jobs (from all users)
that can run concurrently on that build server. In addition, you may specify the
“nice” priority under which all dmake jobs should run. The following is an example
of a dmake.conf file:
max_jobs: 8
nice_prio: 5
Examining Multiple Build Jobs
If you are running Distributed Make (dmake in any mode), you can use the Jobs
Graph window to monitor the progress of the dmake run and to view the state of
each build job.
The graph identifies each build server. Build jobs are graphed in clusters per server.
The graph shows the length of time each build takes. Each job is indicated in the
graph by a line. The appearance of the line indicates whether the build is in progress
(series of dots), or whether it completed (solid green), or failed (solid red).
To open the Jobs Graph window from the Building window, click the Jobs Graph
button (see Figure 4–1) or choose View > Dmake Jobs Graph.
You can select a segment of one of the jobs in the graph to see its build output in the
Selected Job Output display at the bottom of the window.
Exiting Building
To kill the current build process and close all build windows, choose Build > Exit
Building in the Building window.
If you want to close the building windows without killing the current build process,
choose Build > Close.
76
Using Sun WorkShop ♦ Revision A, February 1999
CHAPTER
5
Debugging a Program
Sun WorkShop provides an integrated debugging service that can run a program in a
controlled fashion and inspect the state of a stopped program. Sun WorkShop gives
you complete control of the dynamic execution of a program, including the collection
of performance data.
You can determine where a program crashed, view the values of variables and
expressions, set breakpoints in the code, and run and trace a program. In addition,
machine-level and other commands are available to help you debug code. You can
use standard dbx commands in the Dbx Commands window.
This chapter is organized into the following sections:
4 “Debugging Features” on page 77
4 “Preparing a Program for Debugging” on page 78
4 “Starting Debugging” on page 79
4 “Sun WorkShop Debugging Windows” on page 80
4 “Basic Debugging Steps” on page 89
4 “Quick Mode” on page 109
Debugging Features
When debugging in Sun WorkShop, you have access to an extensive range of event
management, process control, and data inspection features that allow you to:
4 Run a program in Quick Mode with the debugger in the background, ready to
take over processing when a program is about to core dump
4 Run, stop, and continue execution
77
4 Set breakpoints at lines or in functions; trace program execution line by line across
a whole program or within a function; set watchpoints to stop or trace a program if
a specified value or expression changes or meets some other condition
4 Set multiple breakpoints or trace tags in C++ code—in all member functions of the
same name across a class, or in all members of a specified class
4 Save breakpoints for use in subsequent debugging sessions of the same program.
4 Single-step through program code one line at a time; step over or into function
calls; step up and out of a function call arriving at the line of the calling function
line after the call
4 Collect runtime performance data for later analysis by the Sampling Collector,
Sampling Analyzer, LoopReport, and LockLint utilities
4 Use runtime checking to automatically detect memory access errors, memory
leaks, and memory block usage
4 Look up declarations of identifiers and definitions of types, classes, and templates
4 Spot check the value of variables or expressions whenever the program is stopped;
monitor variables or expressions for changes over time; examine the call stack;
move up and down the call stack; and call functions in the program
4 Graphically display program variables including complex structures and arrays,
and monitor values during program execution using the data grapher and the
Data Display window
4 Debug multithreaded programs
4 Use the Fix and Continue feature to edit a file, recompile it with the same options,
install the new code in the program, and continue
4 Support C++ by supporting virtual functions, supporting C++ exceptions,
debugging with C++ templates, using function overloading for argument
resolution, and using default arguments
4 Use an embedded Korn shell for programmability (see “Using the Korn Shell” in
Debugging a Program With dbx for the differences between ksh-88 and dbx
command language)
4 Use the Program Input/Output window to provide an I/O command interface
separate from the dbx interaction in the Dbx Commands window
4 Follow programs as they fork
Preparing a Program for Debugging
To prepare an application for debugging, compile the application using the -g or
-g0 (zero) option, which instructs the compiler to generate debugging information
during compilation. For information on how to specify these options in your
78
Using Sun WorkShop ♦ Revision A, February 1999
makefile, see Appendix B” For more detailed information on preparing your
program for debugging, see Debugging a Program With dbx.
Starting Debugging
You can debug the current program, a program previously run or debugged in Sun
WorkShop, or a program that is new to Sun WorkShop (not part of your picklist).
The current program name appears in the Debugging window header. If you just
built a target, a program with the same name as the target (if it exists in the current
directory) is the current program.
To start debugging a program:
1. Select a debugging state.
Choose Debug > Quick Mode to run a program normally, with the option of
switching to debugging at any point. For more information on Quick Mode, see
“Quick Mode” on page 109.
Choose Debug > Debug Mode or click the Debug button in the Sun WorkShop
main window to debug the program using the full functionality of the debugger.
2. Select the program to debug.
To start debugging the current program, click the Debug button in the Sun
WorkShop main window.
To start debugging a program other than the current program, do one of the
following:
4 To debug a program previously run or debugged in Sun WorkShop, select the
program from the picklist in the Sun WorkShop main window or the
Debugging window.
4 To debug a program that is not on your picklist, load the new program by
choosing Debug > New Program.
4 To attach to another running process, choose Debug > Attach Process.
4 To debug a core dump file from an unsuccessful program execution, choose
Debug > Load Core File.
Your program is loaded and the primary Sun WorkShop debugging windows are
displayed (see “Sun WorkShop Debugging Windows” on page 80”).
3. Run your program by clicking on the Start or Go button, or choosing Execute >
Start or Execute > Go in the Debugging window.
Debugging a Program 79
Note - Before you begin debugging, you can change run parameters such as
arguments, the run directory, or environment variables (see “Changing Run
Parameters” on page 89).
Sun WorkShop Debugging Windows
Sun WorkShop simplifies the debugging task by providing you with an intuitive,
easy-to-use interface. When you start debugging, the Debugging window and a text
editor window (see “Editor Window” on page 83) are displayed. If you have created
custom buttons (see “Using the Button Editor” on page 85), the Custom Buttons
window is also displayed.
Debugging Window
You perform most debugging operations from the Debugging window, shown in
Figure 5–1, and the windows you can access from it.
80
Using Sun WorkShop ♦ Revision A, February 1999
Figure 5–1
Sun WorkShop Debugging Window
Debugging a Program 81
82
Debug menu
Provides commands to debug a program, process, or core file; customize
options; and manage sessions.
Execute menu
Provides commands to run or single-step through lines of code.
Data menu
Provides commands to evaluate the selection in the Debugging window.
Threads menu
Provides commands to hide and expose threads in the Threads/Sessions
pane.
Stack menu
Provides commands to move up, down, and pop the stack.
Checks menu
Provides commands to enable and use runtime checking.
Windows menu
Provides commands to open the Breakpoints, Data Display, and other
debugging windows.
Help menu
Provides commands to display online help.
Start button
Runs the program from the beginning.
Up button
Moves up the call stack one function.
Down button
Moves down the call stack one function.
Go button
Runs the program from the current location.
Interrupt button
Interrupts the program; equivalent to the dbx command Ctrl+C.
Step Into button
Single-steps into a function.
Step Over
button
Single-steps over the current function.
Step Out button
Steps past the end of the current function.
Fix button
Recompiles all changed files and continue debugging.
Debug Status
area
Displays information about the state of your program.
Data History
pane
Displays history when evaluating expressions, querying for type, and
modifying values.
Threads/
Sessions pane
If the Threads radio button is selected, lists information about the threads
in a multithreaded program. If the Sessions radio button is selected, lists
current debugging sessions.
Stack pane
Shows you the current state of the call stack and lets you move to
different stack frames.
Using Sun WorkShop ♦ Revision A, February 1999
Dbx Commands
window
Lets you enter and view the output of dbx commands (displayed only if
Show Dbx Commands Window in a separate window is set to No in the
Window Layout Category in the Debugging Options dialog box).
Message area
Displays messages about operations in the window.
Editor Window
The integration of Sun WorkShop with three text editors (vi, GNU Emacs, and
XEmacs) allows you to edit a program"s source code while using full debugging
functionality.
You can perform basic debugging operations from a text editor window displaying
the source code. Figure 5–2 shows the XEmacs editor window displaying source code
during debugging. In the editor window, you can view and modify source code.
When you start a debugging session, Sun WorkShop automatically displays the
programs"s main routine in an editor window. You can change the colors used to
highlight lines in the source code displayed in the editor window (current function,
breakpoint, and so on) by editing the WORKSHOP resource file (see “Highlight Colors
in Editor Windows” on page 130).
The editor window tool bar provides access to common debugging operations,
especially those that use a source component as an argument, plus buttons from
other parts of Sun WorkShop.
For information on choosing the editor for a Sun WorkShop session, see “Selecting
and Using Text Editors” on page 12.
Debugging a Program 83
Figure 5–2
Emacs Editor Window Displaying Source Code
Custom Buttons Window
The Custom Buttons window contains custom buttons you create using the Button
Editor or the dbx command button. If you have created custom buttons, the
window opens automatically when you start Sun WorkShop.
If you used a previous version of the debugger and your .dbxrc file includes
commands to create custom buttons, these buttons automatically appear in the
Custom Buttons window.
84
Using Sun WorkShop ♦ Revision A, February 1999
You can resize the Custom Buttons window and position the window wherever you
want, but you must close it separately.
Using the Button Editor
You can use the Button Editor (see Figure 5–3) to add, remove, or edit buttons in the
Custom Buttons window. Buttons you add to the Custom Buttons window are stored
in your Sun WorkShop options file. You no longer need to store buttons in your
.dbxrc file. You cannot add buttons to, or remove buttons from, your .dbxrc file
with the Button Editor.
Figure 5–3
Button Editor Window
Debugging a Program 85
To open the Button Editor, choose Windows > Button Editor in the Debugging
window.
You can add buttons from the button list to the Custom Buttons window. If you want
to add a button that is not on the button list, you must first import the button, if it
already exists (see “Adding Builtin Buttons to the Button Editor” on page 86”), or
create the button using the Create/Edit Button panel in the Button Editor (see
“Adding a Button to the Button Editor” on page 86”).
Adding Builtin Buttons to the Button Editor
To import buttons to the Button Editor:
1. Click Builtin Buttons to display the Button Palette.
The builtin button list in the Button Palette lists:
4 All the buttons that populate the tool bars in the Debugger window
4 A number of buttons that access functionality available only from the menus
(such as the Breakpoints button to open the Breakpoints window)
4 Some buttons that offer functionality not available on the tool bar or the menus
(such as the Dump button to print local variables)
2. Select the buttons you want to import to the Button Editor and click OK.
The buttons are added to the button list in the Button Editor.
Adding a Button to the Button Editor
To add a button to the Button Editor:
1. Decide whether you want to put text or an icon on the button.
2. To put text on the button, click the Text radio button and type the text in the
corresponding text box.
3. To put an icon on the button, click the Icon radio button, and type the file
name of an icon.
Click the browse button to display a dialog box you can use to choose an icon
file. The icon file must be in the .xpm file format. Sun WorkShop tool bar icons
are 20x20 pixels, and use only colors from the Sun WorkShop palette.
Tip - You can use the CDE application dticon to create an .xpm file. Most graphics
programs can also save files in .xpm format.
86
Using Sun WorkShop ♦ Revision A, February 1999
4. In the Dbx Command text box, type the dbx command you want executed
when the button is clicked.
Tip - Type commands in the Dbx Commands window to see what commands are
available.
5. If you want the button to execute a dbx command that takes an argument, you
must select one of the radio buttons under Append/Insert(%s) To Command On
Button Press to specify the text to append to the command.
4 The Nothing radio button is selected by default indicating that no text is to be
added to the command.
4 If you click the Selected Text radio button, the current Sun WorkShop selection
is appended to the command.
4 If you click the File: Line Number radio button, the file name and line number
of the selection are appended to the command.
6. If you want the argument embedded in the command rather than appended to
it, type %s in the command string to indicate the position of the argument.
For example, if you type the following command string in the Dbx Command
text box
stop at %s -temp
and select the File: Line Number of Selection radio button, the button will execute
the following command if it is clicked when line 25 in main.cc is selected:
stop at "main.cc":25 -temp
Note - The command string should contain only one %s, and it cannot contain an
escape sequence. For example, stop %%s -temp produces
stop %"main.cc":25.
7. Click Add and the button is added to the button list.
Adding the Buttons to the Custom Buttons Window
You can add the buttons in the button list in the Button Editor to the Custom Buttons
window.
To add a button to the Custom Buttons window, click Apply to add the new button
to the Custom Buttons window.
Debugging a Program 87
1.
Note - You can also add a button to the Custom Buttons window using the dbx
button command.
Editing an Existing Button
To edit an existing button in the Button Editor:
1. Select the button in the button list.
2. Edit its properties using the text boxes and radio buttons in the Create/Edit
Button panel, as described in “Adding a Button to the Button Editor” on page
86.
3. Click Change to apply the new properties to the button.
4. Click Apply to replace the button in the Custom Buttons window with the
edited button.
Rearranging Buttons
You can change the position of a button in the Custom Buttons window by moving it
up or down on the button list in the Button Editor.
To rearrange the buttons:
1. In the button list, select the button you want to move.
2. Click Move Up or Move Down until the button’s position in the button list
corresponds to where you want it to be displayed in the Custom Buttons
window.
3. Click Apply and the button is displayed in its new position in the Custom
buttons window.
Removing a Button
You can remove a button from the Custom Buttons window by deleting it from the
button list in the Button Editor.
To remove a button:
88
Using Sun WorkShop ♦ Revision A, February 1999
1. In the button list, select the button you want to delete.
2. Click Delete and the button is deleted from the button list.
3. To remove the button from the Custom Buttons window, click Apply.
Note - You can also remove a button from the Custom Buttons window using the
dbx unbutton command.
Note - You cannot permanently delete a button stored in your .dbxrc file using
the Button Editor. The button will reappear in your next debugging session. You
can remove such a button by editing your .dbxrc file.
Basic Debugging Steps
The following sections describe the basic steps to perform after you start debugging
a program. For more detailed information on any of the steps, see Debugging a
Program With dbx.
Changing Run Parameters
You can change run parameters such as arguments, the run directory, and
environment variables during a debugging session.
Specifying Program Arguments
You can specify program arguments when you load your program for debugging,
and edit them at any time once your program is loaded.
When you enter arguments in the text box that contain characters that have special
meaning to the shell, make sure you set them off with either a backslash (\) or
quotes (" "). The special characters are | & ; < > ( )$ ‘ \ " ’* ? [ ]Space Tab Newline.
To specify program arguments when loading a program, type the arguments in the
Arguments text box of the Debug New Program dialog box as if you were typing
them on the command line. Do not include the program name.
Debugging a Program 89
To edit program arguments once a program is loaded:
1. Choose Debug > Edit Run Parameters to open the Edit Run Parameters dialog
box.
2. Add or change arguments in the Arguments text box.
3. Click OK.
Specifying a Run Directory
You can specify a run directory when loading your program for debugging and
change the run directory at any time once a program is loaded. When your program
is loaded, the directory you selected as the run directory is made the current
working directory of the debugger.
To specify a run directory when loading a program:
1. Type the directory name in the Run Directory text box or click the browse
button to display the Run Directory dialog box, in which you can select the
directory name.
2. Click OK.
To change the run directory once a program is loaded:
1. Choose Debug > Edit Run Parameters to open the Edit Run Parameters dialog
box.
2. Type the directory name in the Run Directory text box or click the browse
button to display the Run Directory dialog box, in which you can select the
directory name.
3. Click OK.
Setting Environment Variables
You can specify the environment variables that are in effect when the program runs.
When you run the program, setenv commands for these environment variables are
prepended to the run command.
Using the Environment Variables dialog box, you can add or delete environment
variables to the Persistent Environment Variables list. All environment variables in
the Persistent Environment Variables list are saved with your WorkSet.
90
Using Sun WorkShop ♦ Revision A, February 1999
Note - The Persistent Environment Variables list for running your program is not the
same as the Persistent Environment Variables list for building your program
described in “Using Environment Variables” on page 67.
To open the Environment Variables dialog box:
4 If you are setting environment variables when loading the program, choose Debug
> New Program. In the Debug New Program dialog box, click Environment
Variables.
4 If you are changing an environment variables after a program is loaded, choose
Debug > Edit Run Parameters. In the Edit Run Parameters dialog box, click
Environment Variables.
Adding An Environment Variable
To add an environment variable to the Persistent Environment Variables list:
1. Type the name of an environment variable in the Name text box.
2. Type a value for the variable in the Value text box.
If you make a mistake, click Clear to remove entries in the Name and Value text
boxes.
3. Click Add to add the environment variable to the Persistent Environment
Variables list.
4. Repeat the previous three steps to add other environment variables.
5. Click OK to close the dialog box.
Note - Pressing the Return key after each step move the input focus to the next
step.
Deleting an Environment Variable
To delete a variable from the Persistent Environment Variables list:
1. Select a variable from the list.
2. Click Delete (Delete All removes all environment variables in the list).
3. Click OK to establish the change and close the dialog box.
Debugging a Program 91
Changing the Value of an Environment Variable
To change the value of an environment variable in the Persistent Environment
Variables list:
1. Select an environment variable in the list.
2. Type a new value in the Value text box and click Change.
3. Click OK to establish the change and close the dialog box.
Reviewing and Overriding Environment Variables
An environment variable definition that appears in the Persistent Environment
Variables list overrides any environment variable with the same name that appears
in the current debugging environment.
To review the current debugging environment variable definitions, click More to
open the Current Environment list, which includes all the environment variables in
the debugging environment for your program. You can filter the list using the Filter
text box.
To override the value of an environment variable:
1. Select an environment variable in the Current Environment list.
2. Click <<Add to add the environment variable to the Persistent Environment
Variables list.
3. Type a new value in the Value text box and click Change.
4. Click OK to establish the change and close the dialog box.
The environment variable definition in the Persistent Environment Variables list
overrides the environment variable definition in the current debugging
environment, and is saved with your WorkSet.
Note - To delete a variable and unset its value, you can use the dbx command
unset variable.
Stepping Through Your Code
You can view your code by stepping—that is, moving through your code one line at
a time. As you step, a green highlighted line known as the program counter marks
92
Using Sun WorkShop ♦ Revision A, February 1999
your place in the program. With each step, the program counter moves to the source
line which is next to be executed, always showing you the next line to be executed.
There are three ways to step:
Step Into
Proceed forward one source line; if the source line is a function call, the
debugger stops before the first statement of the function.
Step Over
Proceed forward one source line; if the source line is a function call, the
debugger executes the entire function without stepping through the
individual function instructions.
Step Out
Finish execution of the present function and stop on the source line
immediately following the call to that function.
Note - Sometimes after the current function finishes executing, the highlight returns
to the line of the call. In such cases, some extra post-call instructions remain to be
executed. Stepping into or over again does not call the function again.
To view your code by stepping:
1. Wait until your program stops, or interrupt execution by choosing Execute >
Interrupt, clicking the Interrupt button, or pressing Ctrl+Break.
2. In the editor window, step through your code one line at a time, moving
through functions, around functions, or out of functions:
4 To step forward in your program one source line, choose Execute > Step Into or
click the Step Into button (see Figure 5–1 or Figure 5–2) or press F8.
4 To step forward one source line in the current function, choose Execute > Step
Over or click the Step Over button or press F7.
4 To finish executing the current function and stop execution on the source line
immediately following the call to the function, choose Execute > Step Out or
click the Step Out button.
3. Continue executing your program by clicking on Go or choosing Execute > Go.
Setting Breakpoints
Set breakpoints to force the debugger to stop execution. You can set simple
breakpoints to stop at a line of code, or in a procedure or function.
Set advanced breakpoints to break in C++ classes, track changes in data, break on a
condition, break on special events, or create your own custom breakpoints.
Debugging a Program 93
You can set and clear breakpoints in the editor window (see Figure 5–2) or the
Breakpoints window (see Figure 5–4). In the editor window, you can set or clear a
breakpoint at a line of code or in a function. In the Breakpoints window, you can set
more complex breakpoints, such as a breakpoint when a signal occurs.
Setting Breakpoints in the Editor Window
To set a location breakpoint:
1. Click the line where you want the breakpoint.
2. Click the Stop At button.
The line is highlighted in red to indicate the breakpoint is set. If the line selected
is not an executable line of source code, the debugger sets the breakpoint at the
next line after the specified line that is executable.
To set a function breakpoint:
1. Select the name of the function where you want the breakpoint.
2. Click the Stop In button.
A message in the message area tells you that the breakpoint is set.
To remove a breakpoint, do the following:
1. Move the pointer to the line containing the breakpoint you want to remove.
2. Click the Clear At button to remove all breakpoints on the line.
Setting Breakpoints in the Breakpoints Window
To open the Breakpoints window, shown in Figure 5–4, choose Windows >
Breakpoints or Execute > Set Breakpoints in the Debugging window.
To set a location breakpoint:
1. If the Details pane is not in view, click the Add/Change Breakpoint button.
2. Choose At Location from the Event list and type the file name and the line
number in the text box, such as Foo.cc:21.
3. If it is not already set, choose Stop from the Action list.
94
Using Sun WorkShop ♦ Revision A, February 1999
4. Click Add.
The line is highlighted in red to indicate the breakpoint is set. If the line selected
is not an executable line of source code, the debugger sets the breakpoint at the
next line after the specified line that is executable.
To set a function breakpoint:
1. If the Details pane is not in view, click the Add/Change Breakpoint button.
2. Choose In Function from the Event list and type the function or procedure
name in the text box.
3. If it is not already set, choose Stop from the Action list.
4. Click Add.
The breakpoint is added to the list of currently active breakpoints.
To remove a breakpoint, do one of the following:
4 Select a breakpoint in the scrolling list and click Delete.
4 Click Delete All to remove all breakpoints.
Disable and re-enable breakpoints as you move through your program.
Debugging a Program 95
Figure 5–4
96
Breakpoints Window
Using Sun WorkShop ♦ Revision A, February 1999
Scrolling list
Shows the breakpoints and tracepoints assigned in your program. A
breakpoint or tracepoint can be in one of three states: — Enabled,
indicated by a red stop sign — Disabled, indicated by a gray, crossed-out
stop sign
— Executed, indicated by an arrow
Delete button
Deletes the breakpoint or tracepoint from the source code and removes it
from the scrolling list.
Delete All
button
Deletes all breakpoints and tracepoints from the source code and removes
them from the scrolling list.
Enable button
Enables the selected breakpoint or tracepoint and changes its glyph to a
red stop sign.
Disable button
Disables the selected breakpoint or tracepoint and changes its glyph to a
gray, crossed-out stop sign.
Disable All
button
Disables all breakpoints or tracepoints listed and changes their glyphs to
gray, crossed-out stop signs.
Enable All
button
Enables all disabled breakpoints or tracepoints listed and changes their
glyphs to red stop signs.
Show Source
button
Shows the source line of the selected breakpoint or tracepoint in the
editor window.
Add/Change
Breakpoints
button
Expands the Breakpoints window. Click to display options for adding or
changing a breakpoint in your program. This button toggles to Hide
Details.
Details pane
Lets you specify the details of a breakpoint.
Event list
Allows you to set where and when you want to pause program execution.
Event text box
Lets you specify the file name, line number, function name, class name,
and so forth, of an event.
Action list
Lets you set breakpoint actions such as stopping and
tracing.
Option list
Lets you place additional restrictions on a breakpoint or tracepoint.
Add button
Adds a breakpoint or tracepoint with the specified action, event, and
option to the source code. In the editor window, a stop sign glyph
appears to the left of the source line where the breakpoint or tracepoint
appears, and the line is highlighted in red. The breakpoint or tracepoint
also appears in the Breakpoints scrolling list.
Debugging a Program 97
Change button
Updates the event, action, and option of the selected breakpoint or
tracepoint.
Clear button
Removes all entries from the Event, Action, and Option text boxes.
Close button
Closes the Breakpoints window.
Help button
Displays online help for the Breakpoints window.
Collecting Performance Data
While running your program in the debugger, you can use the Sampling Collector to
collect performance data and write it to experiment files to be used by the Sampling
Analyzer. The Sampling Collector can gather program memory-usage data, execution
profile data excluding called function times, and execution profile data including
called function times. For more information on collecting and analyzing performance
data, see Chapter 6,”the Analyzing Program Performance With Sun WorkShop
manual, and the Sun WorkShop online help.
You can collect performance data only when you are running in the Sun WorkShop
Debugging window and runtime checking is turned off.
To collect performance data:
1. Choose Windows > Sampling Collector.
2. Type the complete path name for your experiment file in the Experiment File
text box.
3. Select whether you want to collect data for one run only or for all runs.
If you run the Sampling Collector for one run only, the Collector shuts off after
the experiment is created. If you leave the Collector on for all runs, the Collector
remains on even after the experiment is created.
4. Select the type(s) of data you want to collect.
If you have chosen to collect Execution Profile data, use the Collect Profile data
slider to specify an interval at which the Collector gathers samples.
5. Select either the Manually, on “New Sample” command radio button or the
Periodically radio button to determine when the Collector interrupts data
gathering to stop and summarize.
If you have selected the Periodically button, use the Period slider to define the
interval at which the Collector summarizes samples.
6. Start your program running in the debugger by clicking either Start or Go.
98
Using Sun WorkShop ♦ Revision A, February 1999
Runtime Checking
Runtime checking, or RTC, allows you to automatically detect runtime errors in an
application during the development phase. Using RTC, you can:
4 Detect memory access errors
4 Detect memory leaks
4 Collect data on memory use
4 Work with all languages
4 Work on code for which you do not have the source, such as libraries
To use runtime checking, you must turn on the type of checking you want to use
before you execute the program,. Then, when you run the program, runtime
checking compiles reports on your memory usage.
Setting Runtime Checking Options
You can customize runtime checking to set defaults for reporting options, error
reporting, and stack depth for reports.
To set Runtime Checking options:
1. Choose Debug > Debugging Options.
The Debugging Options dialog box is displayed.
2. Click the Category button and select Runtime Checking.
3. Click the desired settings in the Runtime Checking category. (For descriptions
of the Runtime Checking Options, see “Setting Runtime Checking Options” in
the online help.)
Starting Runtime Checking
To turn on memory use checking:
1. In the Debugging window, choose Windows > Runtime Checking.
The Runtime Checking window is displayed (see Figure 5–5).
2. In the Debugging window or the Runtime Checking window, choose Checks >
Enable Memuse Checking.
A blue recycling symbol with three arrows pointing in a circle appears in the
Debugging window status area and in the Runtime Checking window to remind you
that memory use checking is enabled
Debugging a Program 99
To turn on memory access checking:
1. In the Debugging window, choose Windows > Runtime Checking.
The Runtime Checking window is displayed (see Figure 5–5).
2. In the Debugging window or the Runtime Checking window, choose Checks >
Enable Access Checking.
A red circle with a white minus sign in the middle (the international Do Not
Enter sign) appears in the Debugging window and in the Runtime Checking
window to remind you that memory access checking is enabled.
100
Using Sun WorkShop ♦ Revision A, February 1999
Figure 5–5
Runtime Checking Window
File menu
Provides commands for opening and saving error
logs, clearing information from the Runtime Checking
window, and closing the window.
Leaks menu
Provides commands for controlling the detail level
and content of the memory leaks report.
Blocks menu
Provides commands for controlling the detail level
and content of the memory blocks report.
Options menu
Provides a command to display the Runtime Checking
category of the Debugging Options dialog box.
Debugging a Program 101
Checks menu
Provides commands for turning on memory use
checking and memory access checking.
Suppress Last Reported Error
button
Suppresses reporting of the last reported error when
you continue running your program. You can use this
button after an error is reported and when the
program is stopped or interrrupted.
View Report radio buttons
Control which runtime checking report is displayed in
the output display pane (Access, Memory Leaks, or
Memory Blocks)
Output Display Pane
Lists the access, memory leak, or memory use report,
with a separator line indicating each run of the
program or new report requested.
Tracing Code
Tracing collects information about what is happening in your program and displays
it in the Dbx Commands window. Program execution does not stop.
An unfiltered trace displays each line of source code as it is about to be executed,
which in all but the simplest programs produces volumes of output.
It is more useful to filter a trace to display information about events in your
program. For example, you can trace each call to a function, every member function
of a given name, every function in a class, or each exit from a function. You can also
trace changes to a variable.
An event is the association of a program event with a debugging action. A typical
event is a change in the value of a specified variable. A handler manages debugging
events. The trace listing in the Breakpoints window is called a trace handler because
it manages the trace, a type of event.
To set up a trace:
1. In the Breakpoints window, if the Details pane is not displayed, click the Add/
Change Breakpoint button.
2. From the Event list box, choose the type of event you want to trace.
3. Type any event information, such as the name of a function, or the file name
and line number of a location, in the text box.
4. Choose Action > Trace.
5. Click Add.
102
Using Sun WorkShop ♦ Revision A, February 1999
Note - You can control the speed of the trace using the Debugging Behavior
category in the Debugging Options dialog box (See the Debugging online help for
information on setting debugging options.)
Examining Values and Data
An evaluation is a one-time spot-check of the value of an expression. You can
evaluate expressions at any time from the editor window or the Debugging window.
You can track the changes in a value each time the program stops using the Data
Display window.
The results of an evaluation are listed in the Data History pane of the Debugging
window. A dashed line indicates that the evaluation context has changed since the
last evaluation. The Data History pane maintains a list of expressions you previously
evaluated in a history list. You can clear the Data History pane at any time by
choosing Data > Clear History.
To evaluate an expression using the editor window, select the target variable or
expression in the source display. Then do one of the following:
4 Click the Evaluate button or choose WorkShop > Evaluate > Selected to find the
value of the selected expression.
4 Click the Evaluate * button or choose WorkShop > Evaluate > As Pointer to
evaluate where a pointer-type expression points.
The value is shown in the Data History pane. A separator line is inserted into the
Data History pane list whenever the evaluation context changes.
To evaluate an expression using the Debugging window:
1. In the Expression text box, type or paste the variable or expression.
If the expression you want to examine is visible in the Debugging or editor
window, you can select the expression, then choose Data > Evaluate Selected.
2. Click the Evaluate radio button.
3. Click the Evaluate button or choose Data > Evaluate Selected.
Note - While the program is stopped, you can change the value of a variable or
expression using the Assign button.
Debugging a Program 103
Monitoring Data Values
The Data Display window allows you to watch the changes in the value of an
expression during program execution. A set of expressions you choose is
automatically evaluated every time a program stops executing—at a breakpoint, at a
step, and when the program is interrupted. When the value of an expression
changes, the value is highlighted in boldface.
From the Data Display window, you can display pop-up windows to view additional
information about an expression, giving you control over the information you are
viewing.
To monitor the value of an expression:
1. Open the Data Display window by choosing Windows > Data Display or
clicking Display in the Debugging window.
2. Type an expression in the window by doing one of the following:
4 Type the expression in the Expression text box and click the Display button.
4 Choose Display > New Expression in the Data Display window and type the
expression in the text box in the New Expression panel that is displayed.
3. Place the pointer anywhere in the Data Display window and press the right
mouse button to display the Selected Display Item pop-up menu.
Choose commands from the menu to view context and type information, compare
current and previous values, show pointer aliases, and graph arrays.
Examining the Call Stack
The call stack represents all currently active routines—those that have been called
but have not yet returned to their respective caller. In the stack, the functions and
their arguments are listed in the order that they were called. The initial function
(main() for C and C++ programs) is at the top of the Stack pane; the function
executing when the program stopped is at the bottom of the Stack pane. This
function is known as the stopped in function.
The stopped in function is listed in the Stopped In status line in the Debug Status
area of the Debugging window (see Figure 5–1). The source code of the stopped in
function is displayed in the editor window with the next line to be executed
highlighted in green.
The Evaluation Context line in the status area provides the name of the context
function, which determines the scope resolution search order that applies when you
provide a symbol name in various debugging operations.
You can examine the call stack by doing any of the following:
4 Move up one level in the stack by clicking the Up button or choosing Stack > Up.
104
Using Sun WorkShop ♦ Revision A, February 1999
4 Move down one level in the stack by clicking the Down button or choosing Stack
> Down.
4 Remove multiple frames by placing your cursor next to the frame you want to
return to and choosing Stack > Pop to Current Frame.
4 Remove the function you are stopped in from the stack by choosing Stack > Pop.
4 Remove multiple frames by placing your pointer next to the frame you want to
return to and choosing Stack > Pop to Current Frame.
Debugging Multithreaded Programs
When a multithreaded program is detected, the Sessions/Threads pane on the
Debugging window opens. This pane can be toggled between displaying sessions
and displaying threads. For a multithreaded program, the pane lists information
about the threads in the currently selected process. The current thread is marked
with a green arrow.
To view the context of another thread:
1. Click the thread in the Threads pane.
The call stack dynamically updates to reflect the context of the selected thread.
The source display also updates. The context function and stopped in function are
changed to their respective values for the new thread.
2. To resume program execution, click Go.
To hide a thread:
1. Click the thread in the Threads pane.
2. Choose Threads > Hide Selected.
You can expose threads to help in managing them. To show all hidden threads,
choose Threads > Expose Hidden.
Customizing Debugging Sessions
You can set new defaults for debugging performance, output, language, and so on by
choosing Debug > Debugging Options. The Debugging Options dialog box is
displayed. Using this window, you can customize a debugging session or change
defaults for the entire debugger. You can also set many of the defaults by setting
environment variables with the dbxenv command.
Debugging a Program 105
For detailed information on customizing your debugging session, see Debugging a
Program With dbx.
Debugging Processes Simultaneously
You can debug more than one program at a time, with each program connected to a
separate debugging session. Following are three examples of programs you may
want to debug simultaneously:
4 A process and the child process it forks
4 A client and server program
4 Two related programs
Although you are debugging multiple sessions, you can see the context of only one
session at a time. The Active Sessions dialog box (see Figure 5–6) maintains a list of
all debugging sessions so that you can move between them. The current program is
marked with an arrow. When you switch to a different session, the Debugging
window, the editor window, the Dbx Commands window, and the other displays
reflect the context of the new session.
Figure 5–6
Active Sessions Dialog Box
Debugging multiple sessions consumes resources and may slow down your system.
The Debugging window states how many active sessions you have. To remove
sessions you no longer need, click Quit Session or Detach in the Active Sessions
dialog box.
If you are debugging a program, and you ask to debug another program, a message
tells you that you are currently debugging a program. You will be prompted to
terminate or detach the current session and load a new debugging session, reuse the
current session, or debug both sessions. Choose to debug both only if you want to
debug both programs simultaneously.
106
Using Sun WorkShop ♦ Revision A, February 1999
Managing Sessions
During a Sun WorkShop session, you can debug any number of programs. A list of
these programs is maintained in the Active Sessions dialog box and in the Sessions
Display in the Debugging window, so you can easily terminate, detach, quit, or move
between programs. The current program is marked with an arrow.
To manage your sessions using the Active Sessions dialog box:
1. In the Debugging window, choose Debug > Manage Sessions.
The Active Sessions dialog box opens.
2. Select a program from the scrolling list.
3. Click one of the following buttons:
Set Current
Makes the selected program the current program. The Stack pane, the
editor window, and other displays update to reflect the context of the
selected program.
Terminate
Terminates the program without terminating the debugging session.
Detach
Detaches the selected program without terminating the program or the
debugging session.
Quit Session
Terminates the selected program and removes the debugging session.
If you have only one session and you click this button, the session is
removed and the Debugging window notes that there are no
debugging sessions.
4. Click Close.
To manage your sessions in the Sessions display of the Debugging window:
1. If the Sessions/Threads Pane is not open, drag the sash above the Stack Pane to
open it.
2. If the pane is showing the Threads Display, click the Sessions radio button at
the top of the pane.
Note - Be careful when debugging multiple programs. Debugging more than two
programs may slow down your system considerably. Always be sure to
terminate, detach, or quit a session you no longer need.
Debugging a Program 107
Quitting a Debugging Session
Debugging multiple sessions can consume resources and slow down your system. If
you no longer need a debugging session, use Quit Session to detach a running
process or terminate a loaded process. The debugging session is not preserved.
To quit the current debugging session:
1. In the Debugging window, choose Debug > Manage Sessions.
2. From the list, select the session you want to quit.
3. Click Quit Session.
Note - The Terminate command terminates debugging of the current process, but
preserves the debugging session. When you load another program, it should load
faster than the first one you loaded because the session is already started.
Keeping the debugging session around, however, takes up swap space. If you are
running out of swap space, use Quit Session to terminate the program and quit
the debugging session.
Debugging a Child Process
When a process forks a child process, you can choose to debug the parent process,
the child process, or both. You can also override the normal deletion of all
breakpoints from the forked process.
The Sampling Collector is disabled for a forked process.
If you consistently follow the same process across executions, you can bypass the
Follow Fork dialog box by designating the default action you want to take.
To set the default for a forked process:
1. From the Debugging window, choose Debug > Debugging Options.
2. Choose Category > Forks and Threads.
3. Click the appropriate radio button:
108
Using Sun WorkShop ♦ Revision A, February 1999
Parent
The fork is ignored and the parent is followed. This is the default
behavior.
Child
Debugging switches to the forked child. The process ID of the current
process changes to the child’s process ID. The parent continues as if it
had been detached, and the child process is suspended as if it had
been attached. Use Go or Step Into to execute the child process.
Both
A second debugging session is launched to debug the child process,
and becomes the current session. The parent’s debugging session
remains as an active process. The child process is suspended as if it
had been attached.
Ask User
Whenever a fork is detected, the Follow Fork dialog box opens,
allowing you to choose between the parent, the child, or both
processes at the same time. You can examine the state of your
program each time to see which fork you want to follow.
4. Click OK to apply your choices to the current session, or click Save As
Defaults and then click OK to use them as the new defaults.
The selected action occurs whenever the process executes fork().
To allow the child to inherit the parent’s breakpoints when the new fork will not
execute a different process:
1. From the Debugging window, choose Debug > Debugging Options.
2. Choose Category > Forks and Threads.
3. At Child process inherits parent’s breakpoints, click the checkbox to enable it.
4. Click OK to apply your choices to the current session, or click Save As
Defaults and then click OK to save your choices as the new defaults.
Quick Mode
Quick Mode is a debugging feature that allows you to run your program normally
but with debugging ready in the background to take over the process at any point. If
Debugging a Program 109
your program terminates abnormally, the debugger is there to save the program
before it core dumps.
If all you want to do is run your program as quickly as possible, but you might still
need to do some debugging, select Quick Mode when you start the debugger. The
Debugging window opens, but otherwise your program runs exactly as if you were
running it from the shell; the symbols for the program are not loaded.
If the program encounters a condition that would cause it to terminate, the debugger
switches to Debug Mode, and the symbols for the program are loaded. This causes a
delay, but leaves you with an active program and full debugging functionality.
When you are running your program in Quick Mode, you can switch to Debug
mode whenever execution is interrupted—for example, at a breakpoint or when you
manually interrupt execution by clicking on the Interrupt button.
Advantages of Quick Mode
Quick Mode offers the following advantages:
4 When a program encounters a segmentation fault or some other abnormal
condition, Sun WorkShop steps in before the program terminates, leaving you with
an active program and full debugging functionality. If you had run the program
without Quick Mode, Sun WorkShop would have terminated the program. You
would then have to debug a core file using a restricted set of debugging actions.
4 You can interrupt your program at any point in the process and automatically
bring the debugger into control to set breakpoints, watch data, and browse
through source code. You don"t have to restart your program to get access to
debugging functionality.
4 When you run in Quick Mode, your program runs quickly, but you have the
security of knowing all of the debugging functionality is available if you need it.
4 Your only initial time lag comes from opening the Debugging window. Symbol
tables aren"t loaded.
4 Your program never crashes and produces a core dump. The debugger always
stops the program first.
4 You have full debugger functionality with a program that was about to crash.
(When you attach to a core file, you can only use limited debugger functions.)
4 When the Debugger takes over for a program that was about to crash, you can
pop back through function calls.
When to Use Quick Mode
Use Quick Mode when you:
110
Using Sun WorkShop ♦ Revision A, February 1999
4 Think you are finished debugging
4 Want to avoid waiting for symbols to load
4 Want to test a fix you made
As you debug your program, you can toggle between Debug Mode and Quick Mode
to take advantage of the best features of each.
How to Switch to Quick Mode
You can choose to run your program in Quick Mode or Debug Mode whenever you
select a program to run or debug.
You can toggle between Quick Mode and Debug Mode for the current program from
the Debug menu in the Sun WorkShop main window or in the Debugging window.
If you want to change your defaults so that future programs automatically start in
Quick Mode, choose Options > Debugging Options in the Sun WorkShop main
window. Then choose Debugging Performance from the Category list in the
Debugging Options window and click Save As Defaults.
Quick Mode Example
Suppose you made a change to a program and are confident that the change works.
After rebuilding the program, you choose Quick Mode from the Debug menu, so
that the program runs with minimal overhead. As this is the first time you have run
or debugged a program since opening Sun WorkShop, there is a slight delay as the
Debugging window opens.
You start your program by clicking the Start button or choosing Execute > Start in
the Debugging window. It runs normally until it encounters a segmentation fault.
Before the program can terminate and create a core dump, Sun WorkShop switches
into Debug Mode and loads the symbols for your program. You now have access to
the full debugging functionality of Sun WorkShop and can debug the program as if
you had started debugging in Debug Mode. Eventually, after making many changes,
fixing them, and continuing, you rebuild your program.
You again select Quick Mode before running the program.
This time, no initial pause is noticeable, but your program appears to be stuck in an
infinite loop. Clicking on the Interrupt button stops the program and loads the
debugging symbols. You can now view data values, set breakpoints, and do any
other needed debugging actions to track down your bug.
Convinced the third time is the charm, you rebuild your program, re-enable Quick
Mode, and run the program again. Your program runs without a flaw.
Debugging a Program 111
Exiting Debugging
To quit all processes currently under the control of Sun WorkShop and close all
debugging windows, choose Debug > Exit Debugging in the Debugging window.
If you want to close the Debugging window without quitting the processes under the
control of Sun WorkShop, choose Debug > Close. The processes under the control of
Sun WorkShop continue running, using memory and CPU time, and Sun WorkShop
continues to store data on these processes.
112
Using Sun WorkShop ♦ Revision A, February 1999
CHAPTER
6
Analyzing Program Performance
This chapter describes the basics of how to use the Sampling Collector and Sampling
Analyzer to performance-tune applications in Sun WorkShop. For more detailed
information on these and other performance-profiling tools included in Sun
WorkShop, see Analyzing Program Performance With Sun WorkShop and Sun
WorkShop online help.
This chapter is organized into the following sections:
4 “Performance Profiling in Sun WorkShop” on page 113
4 “Collecting Performance Data” on page 115
4 “Analyzing Performance Data” on page 116
Performance Profiling in Sun WorkShop
The Sampling Collector, available from the Debugging window, gathers performance
data during the execution of an application and saves it to an experiment file. The
Sampling Analyzer, a separate tool available from the Sun WorkShop main window,
displays collected performance data and, if paging is causing a bottleneck, can create
a file to instruct the linker to remap functions in memory.
The UNIX prof and gprof performance-profiling tools generate only user CPU
information. With the Sampling Collector and Sampling Analyzer, you can get
information about I/O time, system time, text and data page fault times, program
sizes, and execution statistics, in addition to user CPU information.
Figure 6–1 illustrates the basic performance-tuning architecture in Sun WorkShop.
113
Figure 6–1
Performance-Tuning Architecture
The Sampling Collector gathers performance data from the application and writes it
to an experiment record. The Sampling Analyzer displays that experiment data
online and can print the data to either a file or a printer. Additionally, the Sampling
Analyzer can create a mapfile for the linker, and you can then recompile the
application.
The following sections describe the basic steps involved in collecting and analyzing
performance data. For more detailed information on any of the steps, see Analyzing
Program Performance With Sun WorkShop, and “Analyzing Performance Data” and
“Collecting Performance Data” in the online help for Sun WorkShop.
114
Using Sun WorkShop ♦ Revision A, February 1999
Building the Application
Before collecting performance data you must build your application. For information
on building, see Chapter 4” and the online help.
Collecting Performance Data
The Sampling Collector gathers performance data about a program as it runs
through the Debugging window. To view the results of the experiment file you
collect, you must use the Sampling Analyzer, which is available separately through
the Sun WorkShop main window or can be displayed by choosing Collect > Analyze
from the Sampling Collector.
When you create an experiment file in the Sampling Collector, you also create a
hidden directory in the same directory as the experiment file. The hidden directory
name is preceded by a dot (.)—for example, if the experiment file is called
test.1.er, the hidden directory is called .test.1.er. Files in this directory
contain information on segments, modules, lines, and functions.
Note - The Analyzer list field (selected from the Section list) in the WorkSet window
lists the experiments associated with the current WorkSet and allows you to add or
delete experiments using the Add Experiment and Delete Experiment buttons.
Types of Data You Can Collect
You can collect three types of data:
4 Address space — Process address space represented as a series of segments, each of
which contains a number of pages
4 Execution profile (excluding called function times) — Time consumed by functions
(but not called functions), modules, and segments during execution
4 Execution profile (including called function times) — Time consumed by functions
(including called functions), modules, and segments during execution
For more information on choosing the type of data to collect, see Analyzing Program
Performance With Sun WorkShop, and “Choosing the Type of Data to Collect” in the
Sun Workshop online help.
Analyzing Program Performance
115
Frequency of Sample Collection
Samples are sets of data collected over specific periods of time while an application
is running.
You can specify the frequency of sample collection by moving the Collect Profile data
slider to the desired number of samples per second. Both data accuracy and
collection overhead increase as the number of samples collected per second increases.
Collecting Data
To collect performance data:
1. From the Debugging window, disable runtime checking and choose Windows >
Sampling Collector to open the Sampling Collector.
2. In the Experiment File text box, type the complete path name for the
experiment file to be created.
3. Using the Collect Data radio buttons, select whether you want to collect data
for one run only or for all runs.
If you select for one run only, the Sampling Collector turns off after an
experiment is created. If for all runs is selected, the Sampling Collector remains
turned on even after the experiment is created.
4. Load the program into the Debugging window and run it by clicking either
Start or Go.
Analyzing Performance Data
After you collect performance data with the Sampling Collector, you can view it only
through the Sampling Analyzer, a separate tool available from the Sun WorkShop
main window or by choosing Collect > Analyze in the Sampling Collector window.
The three types of data you can collect with the Sampling Collector separate into
nine types of data available to analyze; each of these nine types of data has one or
two Analyzer display options associated with it.
116
Using Sun WorkShop ♦ Revision A, February 1999
Types of Data You Can View and Analyze
You can analyze the following types of data by selecting them from the Data list in
the Sampling Analyzer window:
4 Process Times — Summary of process state times (includes User Time, System
Wait Time, System Time, Text Page Fault Time, and Data Page Fault Time)
4 User Time — Time spent in the user process state from the execution of
instructions
4 System Wait Time — Time the process is sleeping in the kernel but is not in the
suspend, idle, lock wait, text fault, or data fault state
4 System Time — Time the operating system spent executing system calls
4 Text Page Fault Time — Time spent faulting in text pages
4 Data Page Fault Time — Time spent faulting in data pages
4 Program Sizes — Sizes in bytes of the functions, modules, and segments of your
application; in conjunction with Address Space data, allows you to examine the
size of your application and helps you establish specific memory requirements
4 Address Space — Reference behavior of both text pages and data pages; in
conjunction with Program Sizes data, allows you to examine the size of your
application and helps you establish specific memory requirements
4 Execution Statistics — Overall statistics on the execution of the application
For more information on selecting a data type, see “Selecting Data Types” in the Sun
WorkShop online help.
Display Options
The Sampling Analyzer offers five ways to view collected performance data:
4 Overview — The default display provides a high-level overview of the
performance behavior of the application, including:
4
Number of samples that were taken during the collection process
4
Breakdown of the process activity for each sample during the collection process
4
Breakdown of the process activity averaged over selected samples
4
Percentage of the entire experiment that you’re viewing
4 Histogram — Summary of the amount of time spent executing functions, files, and
load objects
4 Cumulative — Cumulative amount of time spent by a function, file, or load object,
including the time spent in called functions, files, or segments
Analyzing Program Performance
117
4 Address Space — Information about memory usage
4 Statistics — Aggregate data about performance and system resource usage
For more information on selecting a display option, see “Selecting Display Options”
in the Sun WorkShop online help.
Comparing Samples
By choosing View > New Window in a Sampling Analyzer window, you can open a
new Analyzer window to compare two samples or view the same set of samples in
two different ways.
Reordering Program Functions
If text page faults are consuming a lot of your application’s time, the Sampling
Analyzer can reorder your program, generating a mapfile containing an improved
ordering of functions. With the most-used functions grouped together on the same
set of pages, a function is more likely to already be in memory when called.
The −-M option passes the mapfile to the linker, which then relinks your application
and produces a new executable application with a smaller text address space size.
After you have reordered your application you can run a new experiment and
compare the original version with the reordered one.
To reorder an application, compile the application using the −-xF option.
The −-xF option is required for reordering. This option causes the compiler to
generate functions that can be relocated independently.
For C applications, type:
cc -xF -c a.c b.c cc -o application_name a.o b.o
For C++ applications, type:
CC -xF -c a.cc b.cc CC -o application_name a.o b.o
For Fortran applications, type:>
f77 -xF -c a.f b.f f77 -o application_name a.o b.o
118
Using Sun WorkShop ♦ Revision A, February 1999
If you see the following warning message, check any files that are statically linked,
such as unshared object and library files, because these files may not have been
compiled with the −-xF option:
ld: warning: mapfile: text: .text%function_name: object_file_name: Entrance criteria no
named file, function_name, has not been compiled with the −-xF
option.
1. Load the application in Sun WorkShop for debugging.
2. Start the Sampling Collector by choosing Windows > Sampling Collector from
the Debugging window.
3. Run the application in Sun WorkShop.
4. Load the specified experiment into the Sampling Analyzer.
5. Create a reordered map in the Sampling Analyzer by choosing Experiment >
Create Mapfile. In the file chooser, enter the samples to be used, the mapfile
directory, and the name of the mapfile to be created, and click OK.
The mapfile contains names of functions that have user CPU time associated with
them. It specifies a function ordering that reduces the size of the text address
space by sorting profiling data and function sizes in descending order. All
functions not listed in the mapfile are placed after the listed functions.
6. Link the application using the new mapfile.
For C applications, type:
cc -Wl -M mapfile_name a.o b.o
For C++ applications, type:
CC -M mapfile_name a.o b.o
For C applications, the −-M option causes the compiler to pass −-M mapfile_name
to the linker.
For Fortran applications, type:
f77 -M mapfile_name a.o b.o
Analyzing Program Performance
119
Printing
You can print a plain text version of the current display or a text summary of the
experiment (including average sample times for each data type and the frequency of
use of functions, modules, and segments). Choose Experiment > Print or Experiment
> Print Summary in the Sampling Analyzer window and type the appropriate
information in the dialog box.
Exporting Experiment Data
You can export collected experiment data to files for use by other programs (such as
spreadsheets or custom-written applications).
To export experiment data to an ASCII file:
1. Type the directory of the experiment file to be exported in the Directory text
box and the name of the file in the File text box.
2. Choose Experiment > Export.
3. Click OK to save the experiment data under the given file name.
120
Using Sun WorkShop ♦ Revision A, February 1999
CHAPTER
7
Merging Source Files
Merging lets you compare two text files, merge two files into a single new file, and
compare two edited versions of a file against the original to create a new file that
contains all new edits.
This chapter explains how to start Merging, load it with files, and save the output
file. The chapter is organized into the following sections:
4 “Understanding Merging” on page 121
4 “Starting Merging” on page 122
4 “Working With Differences” on page 123
4 “Merging Automatically” on page 125
4 “Saving the Output File” on page 126
Understanding Merging
Merging loads and displays two text files for side-by-side comparison, each in a
read-only text pane. Any differences between the two files are marked. A merged
version of the two files, which you can edit to produce a final merged version is
diaplayed.
When you load the two files to be merged, you can also specify a third file from
which the two files were created. When you have specified this ancestor file, Merging
marks lines in the descendants that are different from the ancestor and produces a
merged file based on all three files.
121
Figure 7–1
Merging Window With Loaded Files
The merged version contains two types of lines:
4 Lines common to both input files
4 Resolved differences
Starting Merging
To start Merging from the WorkShop main window, choose Tools > Merging.
Loading Files
To load files into Merging:
1. Choose File > Open.
2. In the Directory text box, select a working directory.
122
Using Sun WorkShop ♦ Revision A, February 1999
This is the default directory used to select and save files. The browse button to
the right of the text box displays a dialog box in which you can select a directory.
3. In the Left File and Right File text boxes, select the two files you want to
compare.
4. If you are comparing the files against a common ancestor, type the earlier
version of the two files in the Ancestor File text box.
An ancestor file is required to use Auto Merge.
5. If you want to specify the name of the output file, type it in the Output File
text box.
The name filemerge.out is the default, and the file is stored in the working
directory.
6. Click Open to load the files.
Figure 7–1 illustrates a loaded Merging window. The names of the left file, right
file, and output file are displayed above each text pane. In a three-way
comparison, the name of the ancestor file is displayed in the window header.
Setting Merging Options
Use the Options menu to set various Merging options. The menu items enable you to:
4 Create a merged version of the files automatically
4 Control whether files scroll separately or by corresponding lines
4 Customize tab stops
4 Set how white space and case differences are handled
Working With Differences
Merging operates on differences between files. When Merging discovers a line that
differs between the two files to be merged (or between either of the two files and an
ancestor), it marks the lines in the two files with glyphs corresponding to how the
lines differ. Together, these marked lines are called a difference. As you move through
the files from one difference to the next, the lines that differ and their glyphs are
highlighted.
Merging Source Files 123
Current, Next, and Previous Differences
The highlighted difference is called the current difference. The differences
immediately before and immediately after are called the previous difference and the
next difference.
Resolved and Remaining Differences
A difference is resolved if the changes to a line are accepted. A remaining difference is
one that has not yet been resolved.
If the Auto Merge option is selected, Merging resolves differences automatically.
Understanding Glyphs
Glyphs help you understand the differences between files. There are three types of
glyphs:
Glyph Type
Meaning
Plus sign (+)
New line
Minus sign (-)
Deleted line
Vertical bar (|)
Change in line
No glyph
No changes in line
When you designate a common ancestor file, glyphs next to the lines in each file
indicate when the lines differ from the corresponding lines in the ancestor:
4 If a line is identical in all three files, there is no glyph.
4 If a line was added to one or both of the descendants, then a plus sign (+) shows
where the line was added, and the line is highlighted.
4 If a line is present in the ancestor but was removed from one or both of the
descendants, then a minus sign (-) shows where the line was removed, and the
line is highlighted and in strikethrough font.
4 If a line is in the ancestor but has been edited in one or both of the descendants,
then a vertical bar (|) shows where the line was changed, and the characters that
differ are highlighted.
When a difference is resolved, the glyph changes to an outline font.
124
Using Sun WorkShop ♦ Revision A, February 1999
Moving Between Differences
You can move between differences using the buttons above the two panes or the
Navigate menu. Use the Previous and Next buttons to scroll through the differences
without accepting them. Choose Navigate > Find to navigate to a particular text
string. Choose Navigate > Goto Line to navigate by line numbers.
You can also navigate between differences by using the popup menu that is available
in the Child and Parent panes. Click the right mouse button in either pane to open
the menu.
Resolving Differences
To resolve a difference, accept the change in either the left or right pane:
1. To accept a difference, click the Accept button.
1. To accept the difference and move to the next difference, click the Accept &
Next button.
Note - When Merging is invoked by a Resolve transaction in the Configuring
window of Sun WorkShop TeamWare, the Reload button is added to the Merging
window. Clicking the Reload button at any point during resolution reloads the
files, abandons all the conflicts that have been resolved, and starts over. The files
are reloaded from disk, and any nonconflicting differences are resolved if the
Auto Merge option is selected. You can then proceed by accepting one or the
other version of the remaining lines that conflict.
Setting Difference Options
Choose Options > Diff Options to customize Merging to ignore certain kinds of
differences between files. You can set Merging to ignore trailing or embedded white
space and to ignore differences in case.
Merging Automatically
Merging can resolve differences automatically, based on the following rules:
4 If a line has not changed in all three files, it is placed in the output file.
Merging Source Files 125
4 If a line has changed in one of the descendants, the changed line is placed in the
output file. Changes could be the addition or removal of an entire line, or an edit
to a line.
4 If identical changes have been made to a line in both descendants, the changed
line is placed in the output file.
4 If a line has been edited in both descendant files so that it is different in all three
files, no line is placed in the output file. You must decide how to resolve the
difference—either by choosing a line from a descendant, or by editing the merged
file by hand.
When Merging automatically resolves a difference, it changes the glyphs to outline
font. Merging lets you examine automatically resolved differences to be sure that it
has made the correct choices.
You can disable Auto Merge by choosing Options > Auto Merge. When automatic
merging is disabled, the output file contains only the lines that are identical in all
three files. You must resolve the differences.
If you do not specify an ancestor file, Merging has no reference with which to
compare a difference between the two input files. Consequently, Merging cannot
determine which line in a difference is likely to represent the desired change. The
result of an auto merge with no ancestor is the same as disabling automatic merging:
Merging constructs a merged file using only lines that are identical in both input
files. You must resolve the differences.
Saving the Output File
Save the output file by clicking the Save button or choosing File > Save. The name of
the output file is the name you specify in the Output File text box.
To change the name of the output file while saving, choose Save As and fill in the
new file and directory names in the Save As dialog window.
126
Using Sun WorkShop ♦ Revision A, February 1999
APPENDIX
A
Setting Sun WorkShop Resources
Sun WorkShop uses two resource files to determine the default colors and fonts used
in its windows, and several other options. You may want to change some of these
defaults to adapt the Sun WorkShop user interface to your individual preferences.
This appendix describes Sun WorkShop resources that you can set and gives you the
information you need before changing the settings.
This appendix organized into the following sections:
4 “Sun WorkShop Resource Files” on page 127
4 “Resources Available for Editing” on page 128
4 “Changing a Resource” on page 129
4 “Changing Wide Character Fonts in Hyperlink Windows” on page 129
4 “Sun WorkShop Resources” on page 130
4 “ESERVE Resources” on page 140
Sun WorkShop Resource Files
Sun WorkShop uses two resource files:
4 WORKSHOP contains the resource settings for the Sun WorkShop windows,
including the browser, debugger, and online help.
4 ESERVE contains the resource settings for the edit server (see Chapter 1).
Each resource file has two variations, one for CDE (Common Desktop Environment)
and one for non-CDE. The files are located in the following directories in your Sun
WorkShop installation directory (the default installation directory is /opt):
127
/opt/SUNWspro/WS5.0/lib/locale/<lang>/app-defaults/CDE
/opt/SunWspro/WS5.0/lib/locale/<lang>/app-defaults/non-CDE
Note - Consult with your system administrator for assistance if you have difficulty
locating the resource files; Sun WorkShop may be installed in a different directory at
your site.
The Sun WorkShop program loads the correct resource file automatically based on
whether the CDE window manager is running or not. The only difference between
the CDE and non-CDE variations is that the latter does not define generalized color
and font resources for Motif elements; it allows the CDE Style Manager control to
these elements.
Resources Available for Editing
Both the WORKSHOP and ESERVE files contain comments that indicate what a group
of resources pertains to. For example, the following group of resources controls the
colors used in the text editors for highlighting:
! Resources for highlight colors used by WORKSHOP in the editors
WORKSHOP.curPCColor:
#8BD98B
WORKSHOP.visitPCColor: #EDC9FF
WORKSHOP.breakptColor:
#FF9696
The types of Sun WorkShop resources you can edit include the following:
4 Highlight colors used by Sun WorkShop in the editors
4 Colors used in the Data Grapher window of the debugger
4 Colors for non-Common Desktop Environments
4 Colors for hyperlink windows
4 Automatic text wrapping
4 Fonts for hyperlinks, and certain monospace fonts and proportional fonts
For details on each of the resources, see “Sun WorkShop Resources” on page 130 and
“ESERVE Resources” on page 140.
Resources that affect components in the core Sun WorkShop product do not affect
TeamWare components or any components started from the Tools menu. Be sure to
read the comments that precede each set of resource definitions.
128
Using Sun WorkShop ♦ Revision A, February 1999
Changing a Resource
To change a resource definition, do the following:
1. Create a file called WORKSHOP or ESERVE in your home directory or some other
directory as specified in your XFILESEARCHPATH or XAPPLRESDIR
environment variable.
2. Change directories to the location of the file that contains the resource you
want to change.
The default path names for the WORKSHOP and ESERVE files are listed in “Sun
WorkShop Resource Files” on page 127. Consult with your system administrator
for assistance if you have difficulty locating the files.
3. Open the resource file and copy only the resource definitions you want to
change.
4. Paste the resource definitions into the file you created in your home directory.
5. Change the resource settings and start Sun WorkShop.
If Sun WorkShop is already running, exit and restart it.
Note - If you modify the default colors in Sun WorkShop to use a non-specified
color, you can cause Sun WorkShop to fill up the color map.
Changing Wide Character Fonts in
Hyperlink Windows
Many of the windows in Sun WorkShop use hyperlinks to other windows to
facilitate the display of related information. For example, clicking on a build error in
the Building window causes an editor window to display the source code file that
contains the error.
Certain resources serve as flags indicating that non-ASCII characters written to a
hyperlink display are to be interpreted as multi-byte characters. The multi-byte
characters are displayed in the font indicated by the resource.
Setting Sun WorkShop Resources
129
The resources should be set only in locales in which there is to be multibyte
interpretation of non-ASCII characters.
The names of these resources, as they would appear if set in the WORKSHOP resource
file, are the following:
WORKSHOP*HTML*WCfont:
WORKSHOP*HTML*boldWCFont:
WORKSHOP*HTML*plainWCFont:
WORKSHOP*HTML*plainboldWCFont:
WORKSHOP*HTML*Font:
WORKSHOP*HTML*boldFont:
WORKSHOP*HTML*plainFont:
WORKSHOP*HTML*plainboldFont:
Each WC font resource corresponds to a non-WC font resource. If the WC font
resource is set, WC font dimensions determine the line spacing and baseline of text
elements written in both the WC font and corresponding non-WC font. The purpose
is to produce consistent spacing of a line where ASCII and multi-byte characters are
mixed. The WC font dimensions are also used for formatting a line written only in
the non-WC fonts.
Note - Where WC font resources are set for hyperlink displays of multi-byte
characters and you change a WC font resource, the size and spacing of WC fonts
should be proportional to the size and spacing of non-WC fonts. To get proportional
formatting you might need to modify the resources for non-WC fonts.
Sun WorkShop Resources
Table A–1 through Table A–17 list the Sun WorkShop color and font resources that
you can change in the WORKSHOP resource file.
Highlight Colors in Editor Windows
The resources listed in Table A–1 control the colors used to highlight functions,
breakpoints, query matches, and build errors in source code displayed in the text
editor windows (for an example of highlighting, see Figure 5–2).
130
Using Sun WorkShop ♦ Revision A, February 1999
TABLE A–1
Highlight Colors in Sun WorkShop Editors
Resource Name
Description
Default Value
WORKSHOP.curPCColor:
Current function
#8BD98B
WORKSHOP.visitPCColor:
Visited function
#EDC9FF
WORKSHOP.breakptColor:
Breakpoint
#FF9696
WORKSHOP.disabledBreakptColor
Disabled breakpoint
#BDBDBD
WORKSHOP.matchColor:
Pattern or symbol match
#99CFFF
WORKSHOP.errorColor:
Current build error
#FFCC40
Data Graph Window Colors
The resources listed in Table A–2 control the colors used in the graph types in the
Data Graph window of the debugger (see Debugging a Program With dbx).
TABLE A–2
Data Graph Window Colors
Resource Name
Description
Default Value
WORKSHOP.dgLineColor:
Color for Line graph type
#OOOOFF
WORKSHOP.dgFillColor:
Color for Fill graph type
#FDF5E6
WORKSHOP.dgMeshColor:
Color for Mesh graph type
#OOOOFF
Call Graph and Class Graph Window Colors
The resources listed in Table A–3 control the colors of the nodes, the lines (or arrows)
connecting the nodes, and background color of the graph pane in the Call Graph
window (see Figure 3–5) and the Class Graph window (see Figure 3–6).
Setting Sun WorkShop Resources
131
TABLE A–3
Resources for Class Graph and Call Graph Windows
Resource Name
Description
Default Value
WORKSHOP*labelNodeBackground: Background color of each node
#EFEFEF
WORKSHOP*viewBackground:
Graph pane background (Default
uses X"s Old Lace)
#FDF5E6
Arrow between nodes
#000000
Node properties when unhighlighted
WORKSHOP*arcForeground:
WORKSHOP*nodeForegroundColor: Node border
#000000
WORKSHOP*labelNodeForeground: Node text
#000000
Node properties when highlighted
WORKSHOP*arcHighlightColor:
Arrow between nodes
#FF0000
WORKSHOP*nodeHighlightColor:
Node border
#FF0000
Help Window Colors
Table A–4 lists the color resource settings for the standard Help window and the
smaller Quick Help window.
TABLE A–4
Colors for General Help Viewer
Resource Name
Description
Default
Value
Colors for Help viewer
WORKSHOP*XmDialogShell.DtHelpDialog*DisplayArea.background:
132
Background
color
White
WORKSHOP*XmDialogShell*XmDialogShell.DtHelpDialog*DisplayArea.background
Background
color
White
WORKSHOP*XmDialogShell.DtHelpDialog*DisplayArea.foreground:
Black
Using Sun WorkShop ♦ Revision A, February 1999
Foreground
color
TABLE A–4
Colors for General Help Viewer
(continued)
Resource Name
Default
Value
Description
WORKSHOP*XmDialogShell*XmDialogShell.DtHelpDialog*DisplayArea.foreground
Foreground
color
:
Black
Colors for Quick Help viewer
WORKSHOP*XmDialogShell.DtHelpQuickDialog*DisplayArea.background: Background
color
White
WORKSHOP*XmDialogShell*XmDialogShell.DtHelpQuickDialog*DisplayArea.background
Background
color
White
WORKSHOP*XmDialogShell.DtHelpQuickDialog*DisplayArea.foreground: Foreground
color
Black
WORKSHOP*XmDialogShell*XmDialogShell.DtHelpQuickDialog*DisplayArea.foreground
Foreground
color
Black
Audible Warnings
The resource listed in Table A–5 enables you to turn off audible warning beeps. The
possible values are −XmBell and −XmNONE.
TABLE A–5
Resource for Audible Warnings
Resource Name
Description
Default Value
WORKSHOP*audibleWarning:
Turns audible beeps on and off
XmBell
Debugger Buttons
The resource listed in Table A–6 enables you to set the delay in milliseconds before
debugger and text editor buttons are disabled when dbx starts. This disabling
prevents button flashes when you are stepping through code. If you are running Sun
WorkShop on a slow system or over an ISDN line, you may want to increase this
delay.
Setting Sun WorkShop Resources
133
TABLE A–6
Resource for Debugger Button Disable Delay
Resource Name
Description
Default Value
WORKSHOP.ButtonDisableDelay
Delays disabling of debugger and
text editor buttons when dbx starts
250
Dbx Commands and Program I/O Window
Output Lines
The resource listed in Table A–7 sets the number of lines of output to save in the Dbx
Commands window and the Program Input/Output window.
TABLE A–7
Number of Output Lines Saved in Dbx Commands and Program I/O Windows
Resource
Description
Default Value
WORKSHOP*dtTerm.saveLines
Number of output lines saved
1000
Browser Used to Display Web Updates
The resource listed in Table A–8 enables you to change the default path for the
browser used to display the Sun WorkShop Web Updates page (see “Web Updates”
on page 7).
TABLE A–8
Web Updates Browser
Resource
Description
Default Value
WORKSHOP.browser
Path to browser used to display Web
Updates
sdtwebclient
Hyperlink Resources
The resources listed in Table A–9 set the font type, weight, and angle used in
hyperlinks in the windows and dialog boxes of the English version of Sun
134
Using Sun WorkShop ♦ Revision A, February 1999
WorkShop. For examples of hyperlinks in Sun WorkShop windows, see Figure 4–6,
which shows build error links in the Building window, and Figure 5–1, which shows
function links in the Stack pane of the Debugging window.
TABLE A–9
Hyperlink fonts for "C" locale (English)
Resource Name
Default Value
WORKSHOP*HTML*BoldFont:
-*-lucida-bold-r-normal-*-12-*-*-*-*-*-iso8859-1
WORKSHOP*HTML*PlainFont:
-*-lucidatypewriter-medium-r-normal-*-12-*-*-*-*-*iso8859-1
WORKSHOP*HTML*PlainboldFont: -*-lucidatypewriter-bold-r-normal-*-12-*-*-*-*-*iso8859-1
Table A–10 lists hyperlink WC font resources for locales with multi-byte characters. If
set, non-ASCII characters written to HTML displays are interpreted as multi-byte
characters and displayed with font indicated by the resource.
TABLE A–10
Hyperlink fonts for Japanese locale
Resource Name
Default Value
WORKSHOP*HTML*boldWCFont:
-jis-fixed-medium-r-normal–16-150-75-75-c-160-*-0
WORKSHOP*HTML*plainWCFont:
-jis-fixed-medium-r-normal–16-150-75-75-c-160-*-0
WORKSHOP*HTML*plainboldWCFont:
-jis-fixed-medium-r-normal–16-150-75-75-c-160-*-0
Automatic Text Wrapping
The resource listed in Table A–11 lets you set text to automatically wrap or start a
new line in a Sun WorkShop window. The default value is true, meaning that text
automatically wraps when it meets a window border.
Setting Sun WorkShop Resources
135
TABLE A–11
Automatic Wrapping of Text
Resource Name
Default Value
WORKSHOP*HTML*wrapPreformatText:
True
The resource listed in Table A–12 enables you to turn vertical scrollbars off or on.
TABLE A–12
Availability of Vertical Scrollbars
Resource Name
Default Value
WORKSHOP*HTML*verticalScrollbarAlways:
True
Motif-specific Resources
Table A–13 through Table A–17 list resources that are specific to Motif environments
only and are not used by CDE.
TABLE A–13
Fonts for Motif (non-CDE) Windowing Systems
Resource Name
Description
Default Value
WORKSHOP.labelFontList:
Font types for labels
-*-lucida-medium-r-normal-*-12-*-*-*-*-*-*-*
WORKSHOP.buttonFontList:
Font types on
buttons
-*-lucida-medium-r-normal-*-12-*-*-*-*-*-*-*
WORKSHOP.textFontList:
Font types in lists
-*-lucidatypewriter-medium-r-normal-*-12-**-*-*-*-*-*
In your resource file, uncomment the resources listed in Table A–14 to change the
fonts in a specific Sun WorkShop window.
136
Using Sun WorkShop ♦ Revision A, February 1999
TABLE A–14
Fonts for Specific Windows
Resource Name
Default Value
WORKSHOP*ipeDbxCommandWindow*userFont:
-*-lucidatypewriter-medium-r-normal-*-12-*-*-*-*-*iso8859-1:
WORKSHOP*ipeProgramIOShell*userFont:
-*-lucidatypewriter-medium-r-normal-*-12-*-*-*-*-*iso8859-1:
WORKSHOP*threadsList*fontList:
-*-lucidatypewriter-medium-r-normal-*-12-*-*-*-*-*iso8859-1
WORKSHOP*handlerList*fontList:
-*-lucidatypewriter-medium-r-normal-*-12-*-*-*-*-*iso8859-1
WORKSHOP*processList*fontList:
-*-lucidatypewriter-medium-r-normal-*-12-*-*-*-*-*iso8859-1
This resource listed in Table A–15 is applicable to text in a tabular format, such as
tables.
TABLE A–15
Font Used in Tabular Windows
Resource Name
Default Value
WORKSHOP.DataMonospacedFont:
-*-lucidatypewriter-medium-r-normal-*-12-*-*-*-*-*-*-*
Window Foreground and Background Colors
Table A–16 lists the resources that control the foreground and background colors
used in most Sun WorkShop windows.
Setting Sun WorkShop Resources
137
TABLE A–16
138
Colors for Sun WorkShop Windows, Dialog Boxes, Menus, and Buttons
Resource Name
Description
Default Value
WORKSHOP*foreground:
Foreground
color of
windows (text
such as labels)
#000000
WORKSHOP*XmTextField*background:
Background
color of text
boxes
#FFFFFF
WORKSHOP*XmText*background:
Text color
#FFFFFF
WORKSHOP*threadsList.background:
Background
color of Threads
pane
#FFFFFF
WORKSHOP*ipeDbxCommandWindow*dtTerm.background:
Background
color of Dbx
Commands
window
#FFFFFF
WORKSHOP*ipeProgramIOShell*dtTerm.background:
Background
color of
Program Input/
Output window
#FFFFFF
WORKSHOP*XmDrawingArea.background:
Background
color of Stack
pane, Data
Display, and so
forth
#FFFFFF
WORKSHOP*background:
Background
color of Sun
WorkShop
windows
#DEDEDE
WORKSHOP*XmPushButton*background:
Background
color of buttons
#DEDEDE
WORKSHOP*XmMenuShell*background:
Background
color of menus
#DEDEDE
Using Sun WorkShop ♦ Revision A, February 1999
TABLE A–16
Buttons
Colors for Sun WorkShop Windows, Dialog Boxes, Menus, and
(continued)
Resource Name
Description
Default Value
WORKSHOP*XmList*background:
Background
color of lists
such as Match
list in Browsing
window
#DEDEDE
WORKSHOP*topShadowColor:
Color of
shadows at top
and left edges
of buttons, text
boxes, and so
forth
#FFFFFF
Scrollbar Background and Toggle Button Colors
Table A–17 lists the resources for the colors of the scrollbar background (trough), and
the colors in toggle buttons to indicate toggle on or off.
TABLE A–17
Colors for Trough and Toggle Buttons Used in Sun WorkShop
Default
Value
Resource Name
Description
WORKSHOP*HTML*troughColor:
Background color for
scrollbars
#DEDEDE
WORKSHOP*XmToggleButton.selectColor:
Color for checkboxes when
selected
#FF9696
WORKSHOP*XmToggleButton.fillOnSelect:
Fill checkbox when selected
true
WORKSHOP*XmToggleButtonGadget.selectColor:
Color for radio buttons
when selected
#FF9696
WORKSHOP*XmToggleButtonGadget.fillOnSelect:
Fill radio button when
selected
true
Setting Sun WorkShop Resources
139
ESERVE Resources
The following tables lists the ESERVE resources that you can change.
Emacs Editor Default Path Names
The resources listed in Table A–18 are used by the edit server to invoke the GNU
Emacs and XEmacs text editors. If a fully qualified path is specified, it is executed.
TABLE A–18
Default Paths for Emacs Editors
Resource Name
Default Value
ESERVE*defaultGnuEmacsPath:
emacs
ESERVE*defaultXEmacsPath:
xemacs
The values for these resources can either be fully qualified paths or the base name of
the command (for instance, myfavoriteemacs).
If a basename is used then it is invoked from the PATH environment variable.
Blinking Pointer
Table A–19 lists the resource to change the pointer in text editor windows to a
non-blinking pointer. Default setting is for a blinking pointer. Set to 0 for a
non-blinkng pointer.
TABLE A–19
140
Blinking Pointer Resource
Resource Name
Default Value
ESERVE*DtTerm.blinkRate:
250
Using Sun WorkShop ♦ Revision A, February 1999
Fonts for Motif Environments
Table A–20 lists font resources for the text editor windows that are specific to Motif
environments only and are not used by CDE.
TABLE A–20
Fonts for Motif (non-CDE) windowing systems
Resource Name
Default Value
ESERVE.labelFontList:
-*-lucida-medium-r-normal-*-12-*-*-*-*-*-*-*
ESERVE.buttonFontList:
-*-lucida-medium-r-normal-*-12-*-*-*-*-*-*-*
ESERVE.textFontList:
-*-lucidatypewriter-medium-r-normal-*-12-*-*-*-*-*-*-*
ESERVE*dtTerm*userFont:
-*-lucidatypewriter-medium-r-normal-*-12-*-*-*-*-*-*-*
Text Editor Window Colors
Table A–21 lists the resource for foreground and background colors in the text editor
windows.
TABLE A–21
Colors for Sun WorkShop Windows, Dialog Boxes, Menus, and Buttons
Resource Name
Description
Default Value
ESERVE*foreground
Foregroundcolor of windows (text
such as labels)
black
ESERVE*background:
Background color of windows
#dededededede
ESERVE*XmPushButton*background: Background color of buttons
#dededededede
ESERVE*XmMenuShell*background: Background color of manus
#dededededede
Scrolling List Background Color
Table A–22 lists the resource for the background color for scrolling lists available
from a text editor.
Setting Sun WorkShop Resources
141
TABLE A–22
Read-only Text Areas (lists)
Resource Name
Description
Default Value
ESERVE*XmList*background:
Background color of scrolling lists
#dededededede
Writable Text Area Background Color
Table A–23 lists colors for areas in the text editor windows containing text, other
than menus and buttons (not applicable to Emacs and XEmacs).
TABLE A–23
Writable Text Areas
Resource Name
Default Value
ESERVE*XmTextField*background:
white
ESERVE*XmText*background:
white
ESERVE*dtTerm*background:
white
ESERVE*readwriteBackground:
white
Audible Warnings
The resource listed in Table A–24 enables you to turn off audible warning beeps. The
possible values are −XmBell and −XmNONE.
TABLE A–24
142
Resource for Audible Warnings
Resource Name
Description
Default Value
ESERVE*audibleWarning:
Turns audible beeps on and off
XmBell
Using Sun WorkShop ♦ Revision A, February 1999
Browser Used to Display Web Updates
The resource listed in Table A–25 enables you to change the default path for the
browser used to display the Sun WorkShop Web Updates page (see “Web Updates”
on page 7).
TABLE A–25
WebUpdates Browser
Resource
Description
Default Value
ESERVE.browser
Path to browser used to display Web Updates
sdtwebclient
Setting Sun WorkShop Resources
143
144
Using Sun WorkShop ♦ Revision A, February 1999
APPENDIX
B
The make Utility and Makefiles
You can use the make utility and makefiles to help automate building of an
application with Sun WorkShop. This appendix provides some basic information
about the make utility, makefiles, and makefile macros. It also refers you to dialog
boxes in Sun WorkShop that allow you to set makefile options and to add, delete,
and override makefile macros.
The make Utility
The make utility applies intelligence to the task of program compilation and linking.
Typically, a large application may exist as a set of source files and INCLUDE files,
which require linking with a number of libraries. Modifying any one or more of the
source files requires recompilation of that part of the program and relinking. You can
automate this process by specifying the interdependencies between files that make
up the application along with the commands needed to recompile and relink each
piece. With these specifications in a file of directives, make insures that only the files
that need recompiling are recompiled and that relinking uses the options and
libraries you want.
The Makefile
A file called makefile tells the make utility in a structured manner which source
and object files depend on other files. It also defines the commands required to
compile and link the files.
145
Each file to build, or step to perform, is called a target. Each entry in a makefile is a
rule expressing a target object’s dependencies and the commands needed to build or
make that object. The structure of a rule is:
target: dependencies-listTAB build-commands
4 Dependencies. Each entry starts with a line that names the target file, followed by
all the files the target depends on.
4 Commands. Each entry has one or more subsequent lines that specify the Bourne
shell commands that will build the target file for this entry. Each of these
command lines must be indented by a tab character.
FORTRAN 77 Example
Suppose you have a program of four source files and the makefile:
makefile
commonblock
computepts.f
pattern.f
startupcore.f
Assume both pattern.f and computepts.f have an INCLUDE of commonblock,
and you wish to compile each .f file and link the three relocatable files, along with
a series of libraries, into a program called pattern.
The makefile looks like this:
pattern: pattern.o computepts.o startupcore.o
f77 pattern.o computepts.o startupcore.o -lcore77 \
-lcore -lsunwindow -lpixrect -o pattern
pattern.o: pattern.f commonblock
f77 -c -u pattern.f
computepts.o: computepts.f commonblock
f77 -c -u computepts.f
startupcore.o: startupcore.f
f77 -c -u startupcore.f
The first line of this makefile indicates that making pattern depends on
pattern.o, computepts.o, and startupcore.o. The next line and its
continuations give the command for making pattern from the relocatable.o files
and libraries.
146
Using Sun WorkShop ♦ Revision A, February 1999
C++ Example
Suppose you have a program of five source files and the makefile:
manythreads.cc
Makefilemany.cc
thr.cc
misc.h
defines.h
The target files are many, manythreads, and thrI.
The makefile looks like this:
all: many manythreads thrI
many: many.cc
CC -o many many.cc -g -D_REENTRANT -lm -lnsl -lsocket -lthread
thrI: thr.cc
CC -o thrI thr.cc -g -D_REENTRANT -lm -lnsl -lsocket -lthread
manythreads: manythreads.cc
CC -o manythreads -g -D_REENTRANT manythreads.cc -lnsl \
-lsocket -lthread
The first line of this makefile groups a set of targets with the label all. The
succeeding lines give the commands for making the three targets, each of which has
a dependency on one of the source files.
The make Command
The make command can be invoked with no arguments, simply:
demo% make
You can add a number of options to the make command for your application using
the Options dialog box in Sun WorkShop (see “Specifying Make Options” on page
60).
The make utility looks for a file named makefile or Makefile in the current
directory and takes its instructions from that file.
The make utility:
4 Reads makefile to determine all the target files it must process, the files they
depend on, and the commands needed to build them
The make Utility and Makefiles
147
4 Finds the date and time each file was last changed
4 Rebuilds any target file that is older than any of the files it depends on, using the
commands from makefile for that target
Macros
The make utility’s macro facility allows simple parameterless string substitutions. For
example, the list of relocatable files that make up the target program pattern can
be expressed as a single macro string, making it easier to change.
A macro string definition has the form:
NAME = string
Use of a macro string is indicated by
$(NAME)
which is replaced by make with the actual value of the macro string named.
This example adds a macro definition naming all the object files to the beginning of
makefile:
OBJ = pattern.o computepts.o startupcore.o
Now the macro can be used in both the list of dependencies as well as on the f77
link command for target pattern in makefile:
pattern: $(OBJ)
f77 $(OBJ) --lcore77 --lcore --lsunwindow
\
--lpixrect --o pattern
For macro strings with single-letter names, the parentheses may be omitted.
Creating Macros With the Make Macros Dialog
Box
You can use the Make Macros dialog box in Sun WorkShop to add macros to or
delete macros from the Macros list in your WorkShop target, and reassign values for
makefile macros in the list. For detailed information on using the dialog box, see
“Using Makefile Macros” on page 64.
148
Using Sun WorkShop ♦ Revision A, February 1999
Overriding of Macro Values
The initial values of makefile macros can be overridden with command-line options
to make. For example, suppose you have the following line at the top of makefile:
FFLAGS=-u
and the compile-line of computepts.f:
f77 $(FFLAGS) -c computepts.f
and the final link:
f77 $(FFLAGS) $(OBJ) -lcore77 -lcore -lsunwindow \ lpixrect -o pattern
Now a simple make command without arguments uses the value of FFLAGS set
above. However, this can be overridden from the command line:
demo% make "FFLAGS=-u -O"
Here, the definition of the FFLAGS macro on the make command line overrides the
makefile initialization, and both the -O flag and the -u flag are passed to f77.
Note that "FFLAGS=" can also be used on the command line to reset the macro so
that it has no effect.
Note - You can use the Make Macros dialog box in Sun WorkShop to override the
value of a macro (see “Using Makefile Macros” on page 64).
Suffix Rules in the make Utility
To make writing a makefile easier, the make utility has default rules that it uses
depending on the suffix of a target file. Recognizing the .f suffix, make uses the f77
compiler—passing as arguments any flags specified by the FFLAGS macro, the -c
flag, and the name of the source file to be compiled.
The example below demonstrates this rule twice:
OBJ = pattern.o computepts.o startupcore.o
FFLAGS=--u
pattern: $(OBJ)
f77 $(OBJ) -lcore77 -lcore -lsunwindow
\
--lpixrect --o pattern
pattern.o: pattern.f commonblock
f77 $(FFLAGS) -c pattern.f
computepts.o: computepts.f commonblock
startupcore.o: startupcore.f
The make Utility and Makefiles
149
make uses default rules to compile computepts.f and startupcore.f.
Similarly, the suffix rules for .f90 files invoke the f90 compiler.
More Information
A number of good, commercially published books on how to use make as a program
development tool are currently available, including Managing Projects with make, by
Oram and Talbott, from O’Reilly & Associates.
150
Using Sun WorkShop ♦ Revision A, February 1999
APPENDIX
C
Using the dmake Utility
This appendix describes the way the Distributed Make (dmake) utility distributes
builds over several hosts to build programs concurrently over a number of
workstations or multiple CPUs.
4 “Basic Concepts” on page 151
4 “Understanding the dmake Utility” on page 155
4 “Using the dmake Utility” on page 160
Basic Concepts
Distributed make (dmake) allows you to concurrently distribute the process of
building large projects, consisting of many programs, over a number of workstations
and, in the case of multiprocessor systems, over multiple CPUs. The dmake utility
parses your makefiles and:
4 Determines which targets can be built concurrently
4 Distributes the build of those targets over a number of hosts designated by you
The dmake utility is a superset of the make utility.
To understand dmake, you should know about:
4 Configuration files (runtime and build server)
4 The dmake host
4 The build server
151
Configuration Files
The dmake utility consults two files to determine to which build servers jobs are
distributed and how many jobs can be distributed to each.
Runtime Configuration File
The dmake utility searches for a runtime configuration file on the dmake host to
know where to distribute jobs. Generally, this file is in your home directory on the
dmake host and is named .dmakerc. It consists of a list of build servers and the
number of jobs to be distributed to each build server. See “The dmake Host” on page
152” for more information.
Build Server Configuration File
The /etc/opt/SPROdmake/dmake.conf file is in the file system of build servers.
It specifies the maximum total number of dmake jobs that can be distributed to each
build server by all dmake users. In addition, it may specify the “nice” priority under
which all dmake jobs should run.
See “The Build Server” on page 154 for more information.
The dmake Host
The dmake utility searches for a runtime configuration file to determine where to
distribute jobs. Generally, this file must be in your home directory on the dmake host
and is named .dmakerc. The dmake utility searches for the runtime configuration
file in these locations and in the following order:
1. The path name you specify on the command line using the -c option
2. The path name you specify using the DMAKE_RCFILE makefile macro
3. The path name you specify using the DMAKE_RCFILE environment variable
4. $(HOME)/.dmakerc
If a runtime configuration file is not found, the dmake utility distributes two jobs to
the dmake host.
You edit the runtime configuration file so that it consists of a list of build servers and
the number of jobs you want distributed to each build server. The following is an
example of a .dmakerc file:
# My machine. This entry causes dmake to distribute to it.
falcon
{ jobs = 1 }
hawk
eagle
{ jobs = 3 }
# Manager’s machine. She’s usually at meetings
heron
{ jobs = 4 }
152
Using Sun WorkShop ♦ Revision A, February 1999
avocet
4 The entries: falcon, hawk, eagle, heron, and avocet are listed build servers.
4 You can specify the number of jobs you want distributed to each build server. The
default number of jobs is two.
4 Any line that begins with the # character is interpreted as a comment.
Note - This list of build servers includes falcon which is also the dmake host. The
dmake host can also be specified as a build server. If you do not include it in the
runtime configuration file, no dmake jobs are distributed to it.
You can also construct groups of build servers in the runtime configuration file. This
provides you with the flexibility of easily switching between different groups of
build servers as circumstances warrant. For instance, you may define groups of build
servers for builds under different operating systems, or you may define groups of
build servers that have special software installed on them.
The following is an example of a runtime configuration file that contains groups of
build servers:
earth
mars
{ jobs = 2 }
{ jobs = 3 }
group lab1 {
host falcon { jobs = 3 }
host hawk
host eagle
{ jobs = 3 }
}
group lab2 {
host heron
host avocet
host stilt
}
{ jobs = 3 }
{ jobs = 2 }
group labs {
group lab1
group lab2
}
group sunos5.x {
group labs
host jupiter
host venus { jobs = 2 }
host pluto { jobs = 3 }
}
4 Formal groups are specified by the group directive and lists of their members are
delimited by braces ({}).
Using the dmake Utility
153
4 Build servers that are members of groups are specified by the optional host
directive.
4 Groups can be members of other groups.
4 Individual build servers can be listed in runtime configuration files that also
contain groups of build servers; in this case, dmake treats these build servers as
members of the unnamed group.
In order of precedence, the dmake utility distributes jobs to the following:
1. The formal group specified on the command-line as an argument to the −-g
option
2. The formal group specified by the DMAKE_GROUP makefile macro
3. The formal group specified by the DMAKE_GROUP environment variable
4. The first group specified in the runtime configuration file
The dmake utility allows you to specify a different execution path for each build
server. By default dmake looks for the dmake support binaries on the build server in
the same logical path as on the dmake host. You can specify alternate paths for build
servers as a host attribute in the .dmakerc file. For example:
group lab1 {
host falcon { jobs = 10 , path = "/set/dist/sparc-S2/bin" }
host hawk { path = "/opt/SUNWspro/bin"
}
}
You can use double quotation marks to enclose the names of groups and hosts in the
.dmakerc file. This allows you more flexibility in the characters that you can use in
group names. Digits are allowed, as well as alphabetic characters. Names that start
with digits should be enclosed in double quotes. For example:
group "123_lab" {
host "456_hawk" { path = "/opt/SUNWspro/bin"
}
}
The Build Server
The /etc/opt/SPROdmake/dmake.conf file is in the file system of build servers.
Use this file to limit the maximum number of dmake jobs (from all users) that can
run concurrently on a build server snd to specify the “nice” priority under which all
dmake jobs should run. The following is an example of an
/etc/opt/SPROdmake/dmake.conf file. This file sets the maximum number of
dmake jobs permitted to run on a build server (from all dmake users) to be eight.
max_jobs: 8
nice_prio: 5
154
Using Sun WorkShop ♦ Revision A, February 1999
Note - If the /etc/opt/SPROdmake/dmake.conf file does not exist on a build
server, no dmake jobs will be allowed to run on that server.
Understanding the dmake Utility
To run a distributed make, use the executable file dmake in place of the standard
make utility. You should understand the Solaris make utility before you use dmake.
If you need to read more about the make utility, see the Solaris Programming
Utilities Guide. If you use the make utility, the transition to dmake requires little if
any alteration.
Impact of the dmake Utility on Makefiles
The methods and examples shown in this section present the kinds of problems that
lend themselves to solution with dmake. This section does not suggest that any one
approach or example is the best. Compromises between clarity and functionality
were made in many of the examples.
As procedures become more complicated, so do the makefiles that implement them.
You must know which approach will yield a reasonable makefile that works. The
examples in this section illustrate common code-development predicaments and
some straightforward methods to simplify them using dmake.
Using Makefile Templates
If you use a makefile template from the outset of your project, custom makefiles that
evolve from the makefile templates will be:
4 More familiar
4 Easier to understand
4 Easier to integrate
4 Easier to maintain
4 Easier to reuse
The less time you spend editing makefiles, the more time you have to develop your
program or project.
Using the dmake Utility
155
Building Targets Concurrently
Large software projects typically consist of multiple independent modules that can
be built concurrently. The dmake utility supports concurrent processing of targets on
multiple machines over a network. This concurrency can markedly reduce the time
required to build a large project.
When given a target to build, dmake checks the dependencies associated with that
target, and builds those that are out of date. Building those dependencies may, in
turn, entail building some of their dependencies. When distributing jobs, dmake
starts every target that it can. As these targets complete, dmake starts other targets.
Nested invocations of dmake are not run concurrently by default, but this can be
changed (see “Restricting Parallelism ” on page 159 for more information).
Since dmake builds multiple targets concurrently, the output of each build is
produced simultaneously. To avoid intermixing the output of various commands,
dmake collects output from each build separately. The dmake utility displays the
commands before they are executed. If an executed command generates any output,
warnings, or errors, dmake displays the entire output for that command. Since
commands started later may finish earlier, this output may be displayed in an
unexpected order.
Limitations on Makefiles
Concurrent building of multiple targets places some restrictions on makefiles.
Makefiles that depend on the implicit ordering of dependencies may fail when built
concurrently. Targets in makefiles that modify the same files may fail if those files are
modified concurrently by two different targets. Some examples of possible problems
are discussed in this section.
Dependency Lists
When building targets concurrently, it is important that dependency lists be accurate.
For example, if two executables use the same object file but only one specifies the
dependency, then the build may cause errors when done concurrently. For example,
consider the following makefile fragment:
all: prog1 prog2
prog1: prog1.o aux.o
$(LINK.c) prog1.o aux.o -o prog1
prog2: prog2.o
$(LINK.c) prog2.o aux.o -o prog2
When built serially, the target aux.o is built as a dependent of prog1 and is
up-to-date for the build of prog2. If built in parallel, the link of prog2 may begin
before aux.o is built, and is therefore incorrect. The .KEEP_STATE feature of make
detects some dependencies, but not the one shown above.
156
Using Sun WorkShop ♦ Revision A, February 1999
Explicit Ordering of Dependency Lists
Other examples of implicit ordering dependencies are more difficult to fix. For
example, if all of the headers for a system must be constructed before anything else
is built, then everything must be dependent on this construction. This causes the
makefile to be more complex and increases the potential for error when new targets
are added to the makefile. The user can specify the special target .WAIT in a
makefile to indicate this implicit ordering of dependents. When dmake encounters
the .WAIT target in a dependency list, it finishes processing all prior dependents
before proceeding with the following dependents. More than one .WAIT target can
be used in a dependency list. The following example shows how to use .WAIT to
indicate that the headers must be constructed before anything else.
all: hdrs .WAIT libs functions
You can add an empty rule for the .WAIT target to the makefile so that the makefile
is backward-compatible.
Concurrent File Modification
You must make sure that targets built concurrently do not attempt to modify the
same files at the same time. This can happen in a variety of ways. If a new suffix rule
is defined that must use a temporary file, the temporary file name must be different
for each target. You can accomplish this by using the dynamic macros $@ or $*. For
example, a .c.o rule that performs some modification of the .c file before compiling
it might be defined as:
.c.o:
awk -f modify.awk $*.c > $*.mod.c
$(COMPILE.c) $*.mod.c -o $*.o
$(RM) $*.mod.c
Concurrent Library Update
Another potential concurrency problem is the default rule for creating libraries that
also modifies a fixed file, that is, the library. The inappropriate .c.a rule causes
dmake to build each object file and then archive that object file. When dmake archives
two object files in parallel, the concurrent updates will corrupt the archive file.
.c.a:
$(COMPILE.c) -o $% $<
$(AR) $(ARFLAGS) $@ $%
$(RM) $%
Using the dmake Utility
157
A better method is to build each object file and then archive all the object files after
completion of the builds. An appropriate suffix rule and the corresponding library
rule are:
.c.a:
$(COMPILE.c) -o $% $<
lib.a: lib.a($(OBJECTS))
$(AR) $(ARFLAGS) $(OBJECTS)
$(RM) $(OBJECTS)
Multiple Targets
Another form of concurrent file update occurs when the same rule is defined for
multiple targets. An example is a yacc(1) program that builds both a program and
a header for use with lex(1). When a rule builds several target files, it is important
to specify them as a group using the + notation. This is especially so in the case of a
parallel build.
y.tab.c y.tab.h: parser.y
$(YACC.y) parser.y
This rule is actually equivalent to the two rules:
y.tab.c: parser.y
$(YACC.y) parser.y
y.tab.h: parser.y
$(YACC.y) parser.y
The serial version of make builds the first rule to produce y.tab.c and then
determines that y.tab.h is up-to-date and need not be built. When building in
parallel, dmake checks y.tab.h before yacc has finished building y.tab.c and
notices that y.tab.h does need to be built, it then starts another yacc in parallel
with the first one. Since both yacc invocations are writing to the same files
(y.tab.c and y.tab.h), these files are apt to be corrupted and incorrect. The
correct rule uses the + construct to indicate that both targets are built simultaneously
by the same rule. For example:
y.tab.c + y.tab.h: parser.y
$(YACC.y) parser.y
158
Using Sun WorkShop ♦ Revision A, February 1999
Restricting Parallelism
Sometimes file collisions cannot be avoided in a makefile. An example is xstr(1),
which extracts strings from a C program to implement shared strings. The xstr
command writes the modified C program to the fixed file x.c and appends the
strings to the fixed file strings. Since xstr must be run over each C file, the
following new .c.o rule is commonly defined:
.c.o:
$(CC) $(CPPFLAGS) -E $*.c | xstr -c $(CC) $(CFLAGS) $(TARGET_ARCH) -c x.c
mv x.o $*.o
The dmake utility cannot concurrently build targets using this rule since the build of
each target writes to the same x.c and strings files. Nor is it possible to change
the files used. You can use the special target .NO_PARALLEL: to tell dmake not to
build these targets concurrently. For example, if the objects being built using the
.c.o rule were defined by the OBJECTS macro, the following entry would force
dmake to build those targets serially:
.NO_PARALLEL: $(OBJECTS)
If most of the objects must be built serially, it is easier and safer to force all objects to
default to serial processing by including the .NO_PARALLEL: target without any
dependents. Any targets that can be built in parallel can be listed as dependencies of
the .PARALLEL: target:
.NO_PARALLEL:
.PARALLEL: $(LIB_OBJECT)
Nested Invocations of Distributed Make
When dmake encounters a target that invokes another dmake command, it builds
that target serially, rather than concurrently. This prevents problems where two
different dmake invocations attempt to build the same targets in the same directory.
Such a problem might occur when two different programs are built concurrently, and
each must access the same library. The only way for each dmake invocation to be
sure that the library is up-to-date is for each to invoke dmake recursively to build
that library. The dmake utility recognizes a nested invocation only when the
$(MAKE) macro is used in the command line.
If you nest commands that you know will not collide, you can force them to be done
in parallel by using the .PARALLEL: construct.
When a makefile contains many nested commands that run concurrently, the
load-balancing algorithm may force too many builds to be assigned to the local
Using the dmake Utility
159
machine. This may cause high loads and possibly other problems, such as running
out of swap space. If such problems occur, allow the nested commands to run
serially.
Using the dmake Utility
You execute dmake on a dmake host and distribute jobs to build servers. You can also
distribute jobs to the dmake host, in which case it is also considered to be a build
server. The dmake utility distributes jobs based on makefile targets that dmake
determines (based on your makefiles) can be built concurrently. You can use a
machine as a build server if it meets the following requirements:
4 From the dmake host (the machine you are using) you must be able to use rsh,
without being prompted for a password, to remotely execute commands on the
build server. See man rsh(1) or the system AnswerBook documentation for more
information about the rsh command. For example:
demo% rsh build_server which dmake
/opt/SUNWspro/bin/dmake
4 The bin directory in which the dmake software is installed must be accessible
from the build server. See the share(1M) and mount(1M) man pages or the
system AnswerBook documentation for more information about creating shared
filesystems.
4 By default, dmake assumes that the logical path to the dmake executables on the
build server is the same as on the dmake host. You can override this assumption
by specifying a path name as an attribute of the host entry in the runtime
configuration file. For example:
group sparc-cluster {
host wren
{ jobs = 10 , path = ‘‘/export/SUNWspro/bin’’}
host stimpy { path = ‘‘/opt/SUNWspro/bin’’
}
4 The source hierarchy you are building must be:
4
4
Accessible from the build server
Mounted under the same name
From the dmake host you can control which build servers are used and how many
dmake jobs are allotted to each build server. The number of dmake jobs that can run
on a given build server can also be limited on that server.
160
Using Sun WorkShop ♦ Revision A, February 1999
Note - If you specify the -m option with the parallel argument, or set the
DMAKE_MODE variable or macro to the value parallel, dmake does not scan your
runtime configuration file. Therefore, you must specify the number of jobs using the
-j option or the DMAKE_MAX_JOBS variable or macro. If you do not specify a value
this way, a default of two jobs is used.
Note - If you modify the maximum number of jobs using the -j option, or the
DMAKE_MAX_JOBS variable or macro when using dmake in distributed mode, the
value you specify overrides the values listed in the runtime configuration file. The
value you specify is used as the total number of jobs that can be distributed to all
build servers.
Controlling dmake Jobs
The distribution of dmake jobs is controlled in two ways:
1. A dmake user on a dmake host can specify the machines to use as build servers
and the number of jobs to distribute to each build server.
2. The “owner” on a build server can control the maximum total number of dmake
jobs that can be distributed to that build server. The owner is a user who can alter
the /etc/opt/SPROdmake/dmake.conf file.
Note - If you access dmake from the GUI (Building window), use the online help to
know how to specify your build servers and jobs. If you access dmake from the
coommand line, see the dmake man page (dmake.1).
Using the dmake Utility
161
162
Using Sun WorkShop ♦ Revision A, February 1999
APPENDIX
D
Browsing Source With
sbquery, sb_init, and sbtags
This appendix:
4 Describes sbquery, one of the command-line utilities for browsing source code
4 Tells you how to work with source files whose database information is stored in
multiple directories
4 Describes the sbtags command, which provides a quick and convenient method
for collecting browsing information from source files
The information in this chapter pertains mainly to the use of the command line to
complete tasks also available from within Sun WorkShop. For more conceptual
information on using source browsing, see Chapter 3” and the Sun WorkShop online
help.
This appendix is organized into the following sections:
4 “Browsing Source With sbquery” on page 163
4 “Controlling the Browser Database With sb_init” on page 168
4 “Collecting Browsing Information With sbtags ” on page 174
Browsing Source With sbquery
The sbquery command provides you with a command-line browsing environment
that you can access from terminals and from workstations emulating terminals.
163
Understanding sbquery
The command-line interface to the Source Browsing mode of Sun WorkShop is
sbquery.
To issue a query from the command line, type sbquery, followed by any
command-line options and their arguments, followed by the symbol you want to
search for:
sbquery [options] symbols
All lines that contain symbols are displayed.
sbquery displays a list of matches that includes the file in which the symbol
appears, the line number, the function containing the symbol, and the source line
containing the symbol.
By default, sbquery searches for symbols in the database in the current working
directory. If you want to browse a database stored in another directory, see
“Controlling the Browser Database With sb_init” on page 168.
Command Reference
To obtain a list of the sbquery command-line options, type sbquery at the shell
prompt. Table D–1 lists and describes the options.
TABLE D–1
sbquery Options
Arguments
Description
-break_lock
Breaks the lock on a locked database. This argument
might be needed if the update of the index file is
aborted. The next time you issue a query you might
get a message telling you that the database is locked.
After using this option, your database may be in an
inconsistent state. To ensure consistency, remove the
database directory and recompile your program.
164
-help
Displays a synopsis of the sbquery command.
Equivalent to typing sbquery with no options.
-help_focus
Displays a list of the focus options available for
querying only specific program types in a directory.
Use focus options to issue a query limited to specific
units of code such as programs or functions.
Using Sun WorkShop ♦ Revision A, February 1999
TABLE D–1
sbquery Options
(continued)
Arguments
Description
-help_filter
Displays a list of the languages for which filter
options are available. Use filtering options to search
for symbols based on how they are used in a program.
max_memory size
Sets the approximate amount of memory, in
megabytes, that should be allocated before sbquery
uses temporary files when building the index file.
-no_update
Does not rebuild the index file when you issue a
query following compilation. If you do not include
this option and issue a query following compilation or
recompilation, then the database updates and
processes your query.
-o file
Sends query output to a file.
-show_db_dirs
Lists all database directories scanned when you issue
a query. The list includes the following:
the database directory in the current working directory
and all other database directories specified by the
import or export commands in your sb_init file.
-version | -V
Displays the current version number.
-files_only
Lists only the files where the symbols you are
searching for appear.
-no_secondaries
Returns only the primary match. A secondary match
is an identifier inside a macro. You might want to turn
off secondary matches if you are doing a lot of filtered
querying, and the symbols you are querying on are
used in a lot of macros.
-no_source
Displays only the file name and line number
associated with each match.
-symbols_only
Displays a list of all symbols that match the patterns
in your search pattern. Useful when you use
wildcards in a query.
-pattern symbol
Queries on symbol, which may contain special
characters, including a leading dash (-). This option
allows you to query on a symbol that looks like a
command-line option. For instance, you can query on
the symbol -help, and sbquery distinguishes it from
the regular option -help.
Browsing Source With sbquery, sb_init, and sbtags
165
TABLE D–1
sbquery Options
(continued)
Arguments
Description
-no_case
Makes the query case-insensitive.
-sh_pattern
Uses shell-style expressions when issuing a query that
includes wildcards. This wildcard setting is the
default; include this option if you are doing other
pattern matching on the same command line.
See sh(1) for more information about shell-style
pattern matching.
-reg_expr
Uses regular expressions when issuing a query that
includes wildcards. If you do not include this option,
shell-style patterns are assumed.
-literal
Does not use any wildcard expressions for the query.
Useful when you want to search for a string that
contains meta characters from other wildcard schemes.
Two types of options are available to help you narrow your search: filter options (see
Table D–2) and focus options (see Table D–3.)
Filter Language Options
The filter options listed in Table D–2 are used to search for symbols based on how
they are used in a program. For example, you could limit your search to declarations
of variables.
sbquery -help_filter language
TABLE D–2
166
Filter Language Options
Filter Option
Description
ansi_c
C
sun_as
Assembly language
sun_c_plus_plus
C++
Using Sun WorkShop ♦ Revision A, February 1999
TABLE D–2
Filter Language Options
(continued)
Filter Option
Description
sun_f77
FORTRAN 77
sun_f90
Fortran 90
Focus Options
The focus options listed in Table D–3 limit your search to specific classes of code,
such as particular programs, functions, or libraries.
sbquery focus_option symbol
TABLE D–3
Focus Options
Focus Option
Description
-in_program program
Limit query to matches in program.
-in_directory directory
Limit query to matches in directory.
-in_source_file source_file
Limit query to matches in source_file.
-in_function function
Limit query to matches in function.
-in_class class
Limit query to matches in class.
-in_template template
Limit query to matches in template.
-in_language language
Limit query to matches in language.
Note - If you include two or more focus options, a match is returned if it is found
with any of the supplied focus options.
Browsing Source With sbquery, sb_init, and sbtags
167
Environment Variables
Environment variables provide information that affects the operation of sbquery
(and of source browsing in Sun WorkShop). For more information on sb_init, see
“Controlling the Browser Database With sb_init” on page 168.”
TABLE D–4
Environment Variables
Variable
Description
HOME
The name of your login directory
PWD
The full path name of the current directory
SUNPRO_SB_ATTEMPTS_MAX
The maximum number of times the index builder tries
to access a locked database
SUNPRO_SB_EX_FILE_NAME
The absolute path name of the file
sun_source_browser.ex
SUNPRO_SB_INIT_FILE_NAME
The absolute path name of the sb_init file
Controlling the Browser Database With
sb_init
This section describes how to work with source files whose database information is
stored in multiple directories. As a default, the database is built in the current
working directory and searches that database when you issue a query.
Understanding sb_init
The text file sb_init is used by the Source Browsing mode of Sun WorkShop, the
compilers, and sbtags to obtain control information about the source browsing
database structure. Use sb_init if you want to work with source files whose
database information is stored in multiple directories.
The sb_init file should be placed in the directory from which source browsing, the
compilers, and sbtags are run. These tools look in the current working directory for
the sb_init file.
168
Using Sun WorkShop ♦ Revision A, February 1999
Moving the sb_init File
The default is to look in the current working directory for the sb_init file. To
instruct Sun WorkShop and the compiler to search for the sb_init file in another
directory, set the environment variable SUNPRO_SB_INIT_FILE_NAME to
/absolute/pathname/sb_init.
File Commands
To use an sb_init command, add the command to the file. The sb_init file is
limited to the following commands:
4 import—Reads databases in directories other than the current working directory.
4 export—Writes database component files associated with specified source files to
directories other than the current working directory of the compiler. This
command also acts as an import command.
4 automount-prefix—Enables you to browse source files on a machine other
than the one on which you compiled your program.
4 replacepath—Specifies how to modify paths to file names found in the
database, allowing you to move a database.
Command Reference
import
import /pathname
to directory
This command allows the Source Browsing mode of Sun WorkShop to read
databases in directories other than the current working directory. Use of the import
command enables you to retain separate databases for separate directories.
For example, you may want to set up administrative boundaries so that
programmers working on Project A cannot write into directories for Project B and
vice versa. In that case, Project A and Project B each need to maintain their own
databases, both of which can then be read but not written by programmers working
on the other project.
In Figure D–1, the current working directory is /project/source1. The database
in source2 is read by including either of these commands in the
source1 sb_init file:
Browsing Source With sbquery, sb_init, and sbtags
169
import /project/source2
import ../source2
Figure D–1
import Example
export
export prefix
into path
This command causes the compilers and sbtags to write database component files
associated with source files to directories other than the current working directory
used by the Source Browsing mode of Sun WorkShop and the compiler.
Whenever the compiler processes a source file whose absolute path starts with prefix,
the resulting browser database (.bd) file is stored in path.
The export command contains an implied import command of path, so that
exported database components are automatically read by the Source Browsing mode
of Sun WorkShop.
The export command enables you to save disk space by placing database files
associated with identical files, such as #include files from /usr/include, in a
single database, while still retaining distinct databases for individual projects.
If your sb_init files include multiple export commands, then you must arrange
them from the most specific to the least specific. The compiler scans export
commands in the same order that it encounters them in the sb_init file.
In Figure D–2, to place the .bd file and index file created for files from
/usr/include in a database subdirectory in the sys subdirectory, the user included
this export command in the sb_init file for source1:
170
Using Sun WorkShop ♦ Revision A, February 1999
export /usr/include into /project/sys
Figure D–2
export Example 1
If the configuration had included a source2 directory with a sb_init file
containing the same export command, then you would save disk space because you
did not create two identical database files. For the stdio.h files, the compiler would
create a single database file for stdio.h in the sys subdirectory.
The sb_init file contains an implied export/into. command that instructs the
compiler to put database files created for source files not explicitly mentioned by an
export command in the current working directory. In Figure D–2, the .bd files
associated with a.cc and b.cc are placed in the database subdirectory in the
source1 directory.
When you include the export command in the sb_init file, an implied import
command causes the specified database to be read. Given the configuration in Figure
D–2, the database in the sys subdirectory, as well as the database in the source1
directory, is searched each time you issue a query.
As another example, suppose the user included this export command in the
sb_init file for source1:
export /project/include into /project/include
Browsing Source With sbquery, sb_init, and sbtags
171
As shown in Figure D–3, this places the database files and index file created for files
from /project/include in the database subdirectory in the /project/include
subdirectory. An implied import command caused the database in
/project/include to be read.
Figure D–3
export Example 2
The database files are stored in a common subdirectory even though the command
located the include file in a nonstandard location. The export command saves
disk space if the project includes multiple references from many different directories
to the same include file.
replacepath
replacepath from_prefix
to_prefix
This command specifies how to modify path names in the source browsing database.
In general, from-prefix corresponds to the automounter “mount point” (the path name
where the automounter actually mounts the file system); and to-prefix corresponds to
the automounter “trigger point” (the path name known and used by the developer).
There is considerable flexibility in how an automounter is used; the method can vary
from host to host.
Path replacement rules are matched in the order that they are found and matching
stops after a replacement is done.
The default replacepath command is used to strip away automounter artifacts:
172
Using Sun WorkShop ♦ Revision A, February 1999
replacepath /tmp_mnt
When used for this purpose, the command should be given as the mount point as
the first argument and the trigger point as the second argument.
automount-prefix
automount-prefix mount_point
trigger_point
The automount-prefix command enables you to browse on a machine other than
the one on which you compiled your program. This command is identical to the
replacepath command except that automount-prefix path translations occur at
compile time and are written into the database.
The automount-prefix command defines which automounter prefixes to remove
from the source names stored in the database. The directory under which the
automounter mounts the file systems is the mount_point; the trigger_point is the prefix
you use to access the exported file system. The default is /.
If the path in the database fails, the path translations from both commands (that is,
automount_prefix and replacepath) are used to search for source files while
browsing.
At first glance, searching both paths may not seem possible; the browser database
that is created when you run the compiler contains the absolute path for each source
file. If the absolute path is not uniform across machines, then Sun WorkShop will not
be able to display the source files when it responds to a query.
To get around this problem, you can do either of the following:
4 Ensure that all source files are mounted at the same mount point on all machines.
4 Compile your programs in an automounted path. A reference to such a path
causes the automounter to automatically mount a file system from another machine.
There is a default automount-prefix command that is used to strip away
automounter artifacts:
automount-prefix /tmp_mnt
/
The default rule is generated only if no automount-prefix commands are
specified.
For more information on using the automounter, see the automount(1M) man page.
Browsing Source With sbquery, sb_init, and sbtags
173
cleanup-delay
This command limits the time elapsed between rebuilding the index and the
associated database garbage collection. The compilers automatically invoke
sbcleanup if the limit is exceeded. The default value is 12 hours.
Collecting Browsing Information With
sbtags
The sbtags command provides a quick and convenient method for collecting
browsing information from source files, enabling you to collect minimal browsing
information for programs that do not compile completely.
Understanding sbtags
The sbtags command collects a subset of the information available through
compilation. The reduced information restricts some browsing functionality. A
database generated by sbtags enables you to perform queries on functions and
variables and to display the function call graph.
A tags database:
4 Cannot issue queries about local variables
4 Cannot browse classes
4 Cannot graph class relationships
4 Has limited ability to issue complex queries
4 Has limited ability to focus queries
4 Has less reliability than compiled information
Once a file has been changed, it often need not be scanned again to incorporate
changes into the database.
An sbtags database is based on a lexical analysis of the source file. Though it does
not always correctly identify all the language constructs, it will operate on files that
will not compile and is faster than recompilation.
sbtags recognizes definitions for variables, types, and functions. It also collects
information on function calls. No other information is collected (in particular, other
semantic information for complex queries is not collected).
The functionality of sbtags is similar to ctags and etags, except for the Call
Grapher information. You may mix direct queries to the database for definitions and
graphing with pattern-matching queries.
174
Using Sun WorkShop ♦ Revision A, February 1999
With an sbtags generated database:
4 Class Browser and Class Grapher features are not available.
4 The database does not contain information on all symbols and strings. It contains
information on functions, classes, types, variable definitions, and calls to functions.
4 Time is saved since the sbtags program runs faster than the compiler.
4 The database size is much smaller than the size of your source code.
4 The database content is not guaranteed to be semantically correct because the
sbtags program performs only simple syntactic and semantic analysis and may
sometimes be in error.
4 A database is generated even if the source code cannot be compiled because the
code is incomplete or semantically incorrect.
Generating an sbtags Database
To generate a browsing database using sbtags , type sbtags , followed by the
name of the file (or files) for which you want to generate the database:
sbtags file ...
Browsing Source With sbquery, sb_init, and sbtags
175
176
Using Sun WorkShop ♦ Revision A, February 1999
Index
Index-177