1
PBML 100
OCTOBER 2013
because it biases the model to favor shorter segments. We refer to this labeling scheme
as SL-NUM and to the (unnumbered) labeling scheme outlined in Section 1 as, simply,
SL.
Generally, for all subsequent experiments, when indicating a dataset of size M, we
perform ten-fold cross-validation to assess performance results, that is, our training
data has size 0.9M for each of the ten folds. Throughout, as a performance measure,
we use word error rate, the fraction of wrongly segmented sequences.
5.1. Phonological Segmentation
For phonological segmentation, we generate random samples of size M = 25, 000
for German, English, Dutch, and French in the manner indicated in Section 4. We first
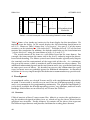
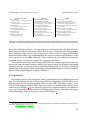
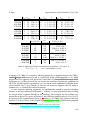
assess, in Table 3, how well our SL modeling performs as a part prediction model PM.
We see that k∗ , the true number of parts of a given sequence, on average coincides
with k̂, the predicted number of parts, in about 97% of the cases for German, Dutch,
and French, and in about 91% of the cases for English. Thus, if we used our LM models
with k̂, we would have error rates of at least 3% for German, Dutch, and French, and at
least 9% for English. Higher upper {
bounds on performance
can be reached by instead
}
considering the intervals B1 (k̂) =
k̂ − 1, k̂, k̂ + 1 wherein to search for k∗ . In fact,
as shown in the table, the probability that k∗ is in B1 (k̂) is considerably above 99% for
all four datasets. These findings encourage us to use our sequence labeling models SL as
prediction models PM.
[
{
}]
PSL [k∗ = k̂] PSL k∗ ∈ k̂ − 1, k̂, k̂ + 1
German-25K
English-25K
Dutch-25K
French-25K
97.5 ± 0.25
90.9 ± 0.44
96.5 ± 0.29
97.1 ± 0.26
99.8 ± 0.13
99.3 ± 0.27
99.9 ± 0.08
99.9 ± 0.08
Table 3. Probability that k∗ is identical to k̂ as predicted by SL model or is in B1 (k̂)
in %. Phonology data.
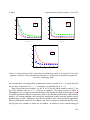
Next, in Figure 1, we plot error rates in terms of N (for the LM Ngram models; we
use k̂ from the SL models). We see that for the LM-C models, performance levels off at
about N = 10 or N = 11, while for the LM-W models, performance levels off already at
N = 6 or N = 7. This is understandable as the word level models operate on entities
of a larger size, namely, segments. We also usually see a convergence of both error
rates as N gets larger. We omit similar graphs for window sizes w in the SL models,
120