1
Operating Instructions Detective Audiometer
6 Performing Manual Pure-tone Tests
6.1 Changing from an automatic to a manual test
The automatic audiometry test can be over-ridden at any time in order to continue with a manually
administered test. Press STOP (11) at any time during the automatic test to pause the test. Press
STOP (11) again in order to end the automatic test and continue with a manual presentation of the
tones. “Test Finished “will be displayed on the screen to indicate that the automatic test has been
stopped.
6.2 Testing in manual mode
Press the STOP button (11) twice as stated above in order to stop automatic testing and begin
manual testing. Any thresholds that were stored during the automatic test will remain on the
screen.
By pressing either the ◄ button (17) or the ► button (20), the frequencies can be selected.
Choose the frequency to be tested and increase the test level by pressing the ▲ button (21) or
decrease the test level by pressing the ▼ button (19). The chosen test level is shown on the display.
.A tone will be presented when you touch the STIMULUS button (11). As soon as the button is
touched, the STIMULUS field on the display is highlighted. If the field is already highlighted when
starting the test, the Interruption Mode is selected.
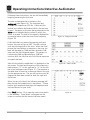
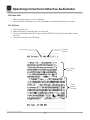
The tone is presented as cross-hairs in the audiogram view (Figure 1A). The horizontal axis indicates
the frequencies (250 Hz - 8 kHz) and the vertical axis indicates the levels at which the test tone is
given.
Frequency of the tone being presented in the table view is indicated by the column in which the
cursor is located. The level of the signal is displayed as a numerical value under the current test
frequency (Figure 1B).
When the patient pushes the patient response switch to signal that he/she just heard the test tone,
the RESPONSE field is highlighted on the display. When the patient’s hearing threshold is
established, or screening protocol has been met, press the ENTER key to manually store the result
on the screen. The level and frequency of the response is marked by an “O” for the right ear or an
“X” for the left ear in the audiogram view. The response in the table view is stored as a numerical
value in the row for the appropriate ear.
The cross-hairs automatically go on to the next frequency. Change level with arrow keys as
described above. Save the patient’s response by pressing the ENTER button (15). The
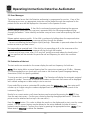
measurements are connected by a line in the audiogram view (Figure 2).
Proceed with the test as described above for all of the other test frequencies. The next measured
points will be reflected on the table. After saving the results at the highest test frequency, the
cross-hairs automatically return to the test results at 1 kHz.
12