1
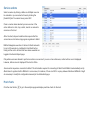
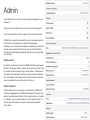
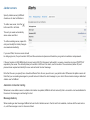
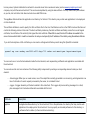
A click anywhere in the pie chart will open the Host Status page. From here you can drill-down on each individual host and see
detailed information about the host and its monitored services and also start, stop or restart services.
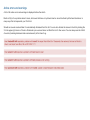
Events in last 24-hours
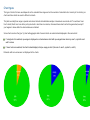
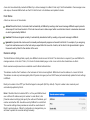
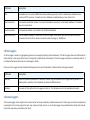
This chart plot events coming in from Monit over the last 24-hours. Events are plotted from right to left. That is, the most recent event
are plotted rightmost in the chart. This is a stacked bar chart and each bar represent an aggregate of events in a 10-minute time
frame. The chart plots the following colorful events:
green !
Success, a previous reported error was fixed
red!
Failure, a service failed
!
orange !
!
!
!
!
Changed, such events are sent when Monit start/stop, when an action
is performed, or when a service fire a change event. For instance if a
file checksum or a process pid changes.
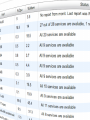
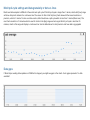
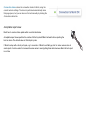
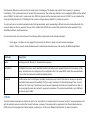
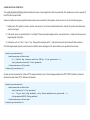
If you hoover the mouse pointer over a plot-point, a popup window is
displayed with event information as indicated in the picture to the right.
Click on a plot-point to open the events log.