1
Services Uptime Report
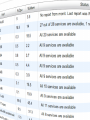
If you click a host entry in the Host uptime report, the service report is displayed
with uptime and downtime for services monitored by Monit on that host. As
with the Host report, the uptime is based on both succeeded and failed events.
Resolution is in minutes and the combined downtime for a service must
accumulate to at least one minute for the service to appear with downtime in
the table.
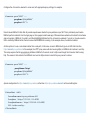
The uptime and downtime of services are calculated similar to the Host report;
1. If a matching failed and succeeded event is found within the selected range, the difference in time between the two events is
counted as service downtime.
2. For open ended failed events, that is; failed events without a matching
succeed event, the service downtime is counted as the difference between
now and the failed event's timestamp.
β
This report work around the fact that Monit does not maintain services (failed) state over a Monit restart/reload nor during
service un-monitoring. If the host stops sending status to M/Monit, the downtime is added to the Monit service only, as it is
unclear whether the host is completely down or if the network connection to M/Monit is down. This may add some inaccuracy
to the computed downtime, though in practice it should work well. However, because of these exceptions this report is a beta
and the numbers should be seen as more informative than authoritative.
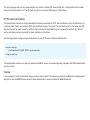
Grayed out entries
1. If the Host is inactive or ignored all services in the table are grey.
2. Services that are in an unmonitored state are marked as grey. Their uptime/downtime is set to zero unless they have actual
downtime within the selected date range. Unmonitored services are not included in the total average numbers unless they have
downtime.
3. Services that once existed in your Monit control file (.monitrc) but since has been removed may show up if the selected range is
wide enough. These historical services are grayed out.