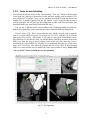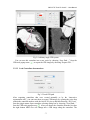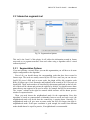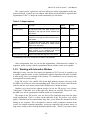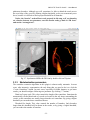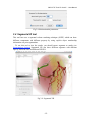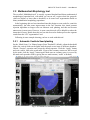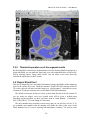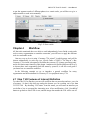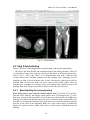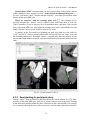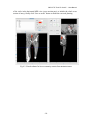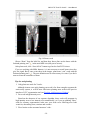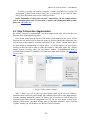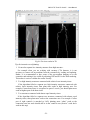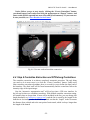
1
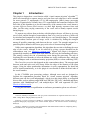
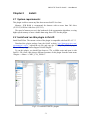
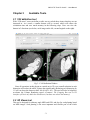
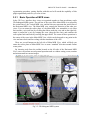
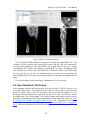
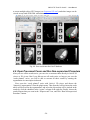
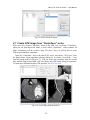
CMIV CTA Tools For OsiriX
User Manual
For Version beta 0.1
CMIV, Linköping University
Sweden
Table of Contents
Introduction
Install
Available tools
VOI definition tool
2D Views tool
Interactive segment tool
Segmental VR tool
Mathematical Morphology tool
Export Result tool
Workflow
Step 1 VOI Definition
Step 2 Seed planting
Step 3 Interactive Segmentation
Step 4 Centerlines
Centerlines
Extraction
and
CPR
along
the
Save Results for the Future
Open Proceeded
Procedure
Cases
and
Run
Non-supervised
Create CPR Image from “Centerlines” series
CMIV CTA Tools For OsiriX -- User Manual
Chapter 1
Introduction:
This plugin is designed on a core function called “virtual contrast injection” algorithm1,2,3,
which was introduced to separate arteries and veins from each other but is now extended
for more general CT angiography (CTA)/ MR angiography (MRA) image processing
purposes, in particular for coronary artery CTA segmentation and centerline extraction. The
basic idea of this algorithm is to use the connectivity of the contrast in the vessel lumen to
separate different contrast-filled structures or other high intensity structures from each
other, just like using varying connectivity of the vessel wall to bluntly separate vessels
during surgery.
To separate two objects from each other with this plugin, the user will have to give two
sets of seeds, and the strength of connectedness from every voxel to each set of seeds will
be calculated and compared to decide which object a voxel should belong to. The strength
of connectedness between pairs of image voxels is calculated by finding the strongest
among all possible connecting paths between the two voxels. The strength assigned to a
particular path is defined as the lowest gray-scale value of elements along the path.
Unlike most segmentation algorithms, this algorithm does not aim at defining the exact
edge of the vessels, although it can be achieved by giving a proper threshold on the
connectedness map (see Interactive segment tool). Instead, this plugin is designed to
separate high intensity structures from each other but still keep the surrounding soft tissue.
This strategy reduces the risk of introducing errors during the processing. The task of
localizing the vessel boundary is left to the human user in the visualization step, which can
utilize techniques such as maximum intensity projection (MIP) or volume rendering (VRT).
The Centerline extraction also depends on this connectedness theory. The strongest path
between seeds and each voxel will always follow the ridge of the intensity of the input
images. Using the object membership information via prior segmentation, the distal end
will be located automatically, so in our plugin it is not needed to define the distal ends of
the vessel branches.
In this CTA/MRA post processing package, although most tools are designed to
facilitate the segmentation procedure based on “virtual contrast injection” algorithm,
different parts can also work independently, which gives this plugin ability to accomplish
diverse tasks, such as arbitrary angle MPR and CPR with “2D views”, threshold and binary
operation with “MathMorph tool”, and multiple-object VRT with segmental VR (See:
Details of different tools).
If using this software for a publication or conference presentation, please use reference 3.
1 Tizon X, Smedby Ö. Segmentation with gray-scale connectedness can separate arteries and veins in
MRA. J Magn Reson Imaging 2002;15(4):438-45.
2 Löfving A, Tizon X, Persson P, Smedby Ö. Angiographic visualization of the coronary arteries in
computed tomography angiography with virtual contrast injection. The Internet Journal of Radiology
2006;4(2)
3 Wang C, Smedby Ö. Coronary artery Segmentation and Skeletonization based on Competing Fuzzy
Connectedness Tree. Accepted by MICCAI 2007.
-1-
CMIV CTA Tools For OsiriX -- User Manual
Chapter 2
Install:
2.1 System requirements:
This plugin is able to run on any Mac that can run OsiriX2.6 or later.
Memory: 2GB RAM is recommend for datasets with no more than 500 slices
(512*512). 4GB for 1000 slices (512*512).
The speed of memory access is the bottleneck of the segmentation algorithm, so using
higher speed memory is more valuable than using faster CPU for this plugin.
2.2 Install and run this plugin in OsiriX:
Install OsiriX first. The current version of the plugin is compatible with OsiriX 2.6-2.7.5
Download the plugin package from the OsiriX website: http://homepage.mac.com/
rossetantoine/ osirix/ , unpack the zip file, and copy the “CMIV_CTA_TOOLS.plugin”
file to “/Library /Application Support /OsiriX/Plugins /”
To run this plugin, you should first choose a CTA or MRA series and open it with
OsiriX’s 2D viewer, then choose different functions of this plugin from the main menu
“Plugins -> Others -> CMIV_CTA_TOOLS”.
Fig 2-1. Location of OsiriX’s plugins.
-2-
CMIV CTA Tools For OsiriX -- User Manual
Chapter 3
Avaliable Tools
3.1 VOI definition tool
With “VOI cutter”, users can define a cubic area to exclude those tissues that they are not
interested in. As a result, a smaller dataset will be created, which will reduce the
calculation time and save much memory in the following steps. Users can view the
dataset in 3 directions (see below; axial image on the left, coronal/sagittal on the right).
Fig 3-1. VOI definition Window
Since all operations in this plugin are carried out in 3D, even a small reduction in each
dimension will reduce the whole volume data significantly (Reducing each dimension by
1/5 will cut down the dataset to half: 0.80.80.8 0.5) . This tool will also be helpful to
accelerate the Volume Rendering speed. (Comment: The Cropping Box tool in VR
interface of Osirix only hides the outside area, but does not release the memory).
3.2 2D Views tool
This tool is designed for arbitrary angle MPR and CPR, and also for seed planting based
on MPR images. Seed planting is the most important and flexible part of the whole
-3-
CMIV CTA Tools For OsiriX -- User Manual
segmentation procedure, getting familiar with this tool will extend the capability of this
plugin significantly and save you a lot of time.
3.2.1
Basic Operation of MPR views
In the 2D Views interface, three views are organized together to form an arbitrary angle
2D Orthogonal MPR system. The red line of the cross in the Main MPR view represents
the section line of the Vertical MPR view, and the blue one represents the section line of
the Horizontal MPR view. The Main MPR view controls the direction of the other two
views. You can rotate the reslice plane of the Main MPR view around the x axis (blue
line) and the y axis (red line) by scrolling the sliders under the view and on the right side,
rotate it around the z axis by rotating the cross (drag the blue line), and translate the
reslice plane back and forth by scrolling the upper slider. The center of these operations is
the center of the cross in the Main MPR View, which can be dragged to any point in the
view and move back and force along with the translation of the view.
There are several buttons on the left side of Main MPR View, which will help you
rotate the reslice plane of Main MPR View to some “standard” direction around current
center point.
By choosing tools from the toolbar located on the left side of the Horizontal MPR
View, users can perform several general operation such as window setting, zoom, rotation
and measurement on current images.
Fig 3-2. 2D Orthogonal MPR system
-4-
CMIV CTA Tools For OsiriX -- User Manual
3.2.2
Tools for seed planting
The tools on the left-up corner are for “seed planting”. There are 7 kinds of default seeds
in the seeds list, which give the names of some structures usually used in coronary CTA
and peripheral CTA images. Users can also add their own kinds of seeds and remove the
default ones. It should be pointed out that the “barrier” seed is a special kind of seed, it
will not propagate and will also stop the propagation of other seeds from each side. You
should not name your own kind of seeds with this word.
You can use 3 different tools (virtual catheter tool, freehand painting tool and rectangle tool) to plant those seeds, and each tool can be combined with any kind of seed.
Virtual catheter ( ): This is a root definition tool, which is usually used to mark the
root of a certain branch of vessels for example LCA or RCA, and then cut it off from
other parts of the vessels . This marker is also used as a start point for automatic centerline extraction. To use this tool, first, you should choose it and draw an arrow in the main
MPR view from the root of artery pointing to the distal end, then adjust the arrow’s
direction in the vertical MPR view (actually it is reconstructed along the axis of the arrow
now), and, if necessary, also adjust the position and size of the circle in the horizontal
MPR view (cross section now) to include the whole cross section of artery, finally click
“Save as Seeds” button to finish the root seed planting.
Fig 3-3. Seed planting
-5-
CMIV CTA Tools For OsiriX -- User Manual
Freehand painting tool ( ): this tool is frequently used to plant non-vessel structure,
such as “other” (meaning those parts that you do not want to show in the results) or
“bones” seeds. To use it, just choose one kind of seeds from the list and click the
icon,
then you can draw seeds directly on the main MPR view. You can change the width of
the brush or switch Draw/Erase mode with the brush status controls.
Rectangle plane tool ( ): As the name suggests, this tool is designed to create a
rectangle plane in the 3D volume. To use it, choose it first, as mentioned above, and draw
a line(section line) in the main MPR view, then adjust the rectangle area in the vertical
MPR view, finally click “convert to seeds” button to convert it to seeds. One thing
worth mentioning is that the plane created by the rectangle plane tool is a 3D “airtight”
plane, which guarantees the connection between two sides will be completely cut open.
This character is essential for “barrier” seed, so if you want to use a “barrier” to separate
two structure, you should always use Rectangle plane tool.
Any kind of seed can be deleted in any direction MPR images. Even if only a short
section line of a long curve is shown in the Main MPR view from current angle, after you
select it and delete it with “backspace” key, the whole curve will be removed too.
See Introduction of Workflow to learn more about seed planting.
3.2.3
Working with CPR images
3.2.3.1 Create Centerlines by hand
To create a new centerline by hand, you should choose “Add Points” from the CPR tool
list ( ) and start to draw a polygon in the Main CPR View. As you define the centerline,
a CPR will be created at the same time in the lower right part of the screen (replacing the
vertical MPR). When you create a 2D point for the polygon on current slice, actually the
3D information of this point will be recorded to calculate the projected position of this
point when you rotate the Main MPR View. You can not change this 3D information with
any kind of CPR tools, so if you make a mistake at a certain point, you will have to delete
it and all the points after it by clicking the “backspace” key, and redraw the centerline
from that point. The “Edit Points” tool is only used to modify the projected 2D centerline,
which means that all the modification will be lost after rotation of the Main MPR View.
-6-
CMIV CTA Tools For OsiriX -- User Manual
Fig 3-4. arbitrary angle CPR system
You can save this centerline into a new series by choosing “Save Path…” from the
CPR tools popup menu ( ), or export the CPR images by choosing “Export CPR…”.
3.2.3.2 Load Centerlines from markers
Fig 3-5 Load CPR path
After exporting centerlines that were created manually or by the “interactive
segmentation tool”, you can reuse them to create CPR images, by opening the series that
contain the centerline markers with the OsiriX 2D viewer and then choosing “2D Views”
from the plugin menu. Open centerline selecting dialog box by choosing “Load Path…”
from the CPR tools popup menu ( ). After you choose the centerline from the list, then
the right bottom MPR view will change into a CPR image along the centerline. The
-7-
CMIV CTA Tools For OsiriX -- User Manual
resample rate (which means how many points of all the markers would be used to create
the centerline) should generally be set to 1 if the centerline is created by hand, and 5 or
higher if the centerline is created automatically by this plugin.
Note: the path loaded will be smoothed (with a cubic B-spline approximation; if
resample ratio>0). After you define a centerline manually, you can save the path
first and then load it again in the new created series, where your centerline will be
soomthed.
3.2.3.3 General Operation of CPR View
Whenever you create a centerline manually or automatically, the centerline will be
projected into current reslice plane of the Main MPR View at real time speed, the CPR
view (the Vertical MPR View in MPR mode) represents a curved surface, orthogonal to
the main MPR view in each point of the curve, and the Cross Section View(the
Horizontal MPR View in MPR mode) represents a cross section plane perpendicular to
projected centerline at current point (determined by the distance to the root point given by
the translate slider of the Cross Section View ). By rotating the Main MPR View, you
will be able to project the centerline in any direction and reconstruct CPR images along
the centerline from an arbitrary angle. When you scroll the translate slider on the right
side of the Cross Section View, the reference cross in the Main MPR view will be moved
to the point of intersection between the centerline and current cross section plane, and the
sliders for the CPR View (the Vertical MPR View) will not respond to your operation in
CPR mode.
One hint: after using general tools (such as WW/WL, Move and Zoom) while viewing
CPR images, remember to choose “New Points” or “Edit Points” from the CPR tools list
( ) again before you rotate or translate the Main MPR view, or the centerline will be
hidden and CPR view will go back to vertical MPR. But even if that happens, you can
always go back to the CPR view as long as you choose one of the CPR tools again.
-8-
CMIV CTA Tools For OsiriX -- User Manual
3.3 Interactive segment tool
Fig 3-6. Segmentation Options
This tool is the “brain” of this plugin. It will collect the information created in former
steps and try to segment structures from each other using a algorithm called “virtual
contrast injection”.
3.3.1
Segmentation Options
If you are not using a wizard, before you run this segmentation you will have to do some
simple configuration to the algorithm.
First of all, you should choose the corresponding seeds that have been created in
former steps. The seeds are usually created by the 2D Views tool, but you can also use
OsiriX 2D viewer’s ROI tools to create seeds, the plugin will be able recognize seeds
ROIs of follow types: Oval, Rectangle and brush(all seeds created in 2D Views tool are
brush ROI). Those seeds markers are classified by their names and listed on the left side.
All of them will be chosen and put into the right list by default. You should remove those
names that are not supposed to be used as seeds, for example the ROI for measurement.
The “export” column in the right list controls which structure will be shown preview
window or exported results.
Then, you need choose the neighborhood mode for the segmentation. Since this
algorithm is based on connectedness relationship between seeds and each voxel, the
neighborhood mode will decide how the connectivity is passing down. Generally, 26neighborhood mode will give more accurate results but will cost longer time than 6neighborhood mode. If the space resolution is good enough, the results from different
mode should almost be equal. In practice, 26-neighborhood is recommended.
-9-
CMIV CTA Tools For OsiriX -- User Manual
The “export results” options are only used when you run the segmentation in the nonsupervised mode, in which you can choose what format results should be exported after
segmentation. Table 3-1 shows the result formats that you can choose.
Table 3-1: Export options
Name
Function
Series
Number
Format
Into one series
all structures that have been chosen to be
exported in the right list will be exported into
one series
1
DICOM
Into separate series
each structure that has been chosen to be
exported in the right list will be exported into a
new series
N
As Masks
all structures that have been chosen to be
exported will be exported as masks (brush
ROI) into a new series
1
ROI
Centerlines
extract centerlines of those structure that have
been chosen to be exported and export
centerlines’ markers into a new series
1
ROI
Connectedness Map
export connectedness Map into a new series
1
DICOM
*
*
DICOM
n is decided by how many structures are chosen to be exported.
After configuration, now you can run the segmentation. “Run interactive window” is
suggested, unless you have run the segmentation before and the results are acceptable.
3.3.2
Working with Interactive Window
Although in many cases the first round seed planting in 2D View tool is enough to get
acceptable segment results, in some complicated cases the algorithm will make a mistake
at some tricky place, for example in the coronary CTA sometime a part of ventricle may
be recognized as coronary artery.
In the 3D preview view, double click on the high intensity structure, the cross in the
left MPR view will move to the corresponding point. Then you can select a label from the
seeds list and use your mouse to draw some freehand curve on that structure.
Another way to preview the segment results is to use the 2D preview view (choose
“2D Results” of the table view on the right side). When you scroll the 2D preview view,
the MPR view will be synchronized with the result view automatically.
The images in the 2D preview view are slices of the connected maps from the latest
round segmentation. There is a slider on the right side of the 2D preview view, which
applies a threshold on the connectedness map. Any voxels below this threshold will not
belong to any structure. This is designed to remove weakly connected structure from
vessels, for example sometime pulmonary vessels are connected with coronary artery via
lung tissue, setting a relatively high threshold (default value: -700 HU) can remove those
-10-
CMIV CTA Tools For OsiriX -- User Manual
pulmonary branches. Although you will, sometimes, be able to shrink the result area to
the exact edge of the vessel by defining a higher threshold, we do not recommend you to
do so, because it is difficult to find a proper threshold for all branches.
Notice: the “barrier” seeds will not work properly in this step, so if you intend to
set a barrier between two structures, save the current seeds, go back to “2D views”
and use the “rectangle tool”.
Fig 3-7. Synchronize MPR with 3D Point by double click on 3D point.
3.3.3
Skeletonization parameters
The centerline extraction algorithm in this plugin is almost totally automatic. In most
cases, after interactive segmentation, the only thing that you need to do is to click the
“Create Centerlines” button. In some cases, especially for MRA datasets, to get better
results, you should configure following two parameter (by clicking “?” button):
Distal end’s gray-scale: This value controls the length of the centerlines. Sometime the
automatically created distal ends of vessels are located in the soft tissue surrounding the
vessels, so the centerlines are usually longer than the real centerlines. By giving a higher
threshold you can make those centerlines shorter.
Threshold for length: This value controls the number of branches. Only branches
longer than this threshold will be shown in the results, so by giving a higher threshold,
you can reduce the number of branches.
-11-
CMIV CTA Tools For OsiriX -- User Manual
Fig 3-8 Skeletonization parameters
3.4 Segmental VR tool
This tool here uses a segmental volume rendering technique (SVRT) which can show
different components with different property by using explicit object membership
information via prior segmentation.
To use this tool to view the results, you should export segments as masks (see
Segmentation Options). Segmental VR can show different segments with different
opacity, different color and different WW/WL.
.
Fig 3-9. Segmental VR
-12-
CMIV CTA Tools For OsiriX -- User Manual
3.5 Mathematical Morphology tool
The so-called “MathMorph tool” is actually a general threshold and binary mathematical
morphological operation tool, with which you can cut off a region where the grayscale
values are higher or lower than a threshold, or do some basic segmentation based on
binary mathematical morphology operations.
In the beginning, this tool was introduced into this plugin to create seeds for ventricles
automatically, but after some improvement in the core function, this virtual contrast
injection algorithm no longer relies on elaborate seed planting, and this tool became
unnecessary in most cases. However, in some cases this tool will be helpful to reduce the
interaction of users. Beside that, this tool can also be used to further process the segment
results from the “CFC segmentation” tool.
Following is some example showing you how to work with this tool.
3.5.1
Automatic Ventricle Seed planting
Set the “Mask Source” to “Binary Images From Threshold” (default), adjust the threshold
slider (the vertical slider on the right) until the mask covers most of the heart chambers.
Choose “Erosion” operation and accept the default operator. Click the “Apply” button
and wait a while, look at the result mask. If part of the coronary arteries are still covered
by the mask, click the “Apply” button again. Make sure no coronary artery is covered by
the mask and export the result by giving the new mask a name (“result” as default).
Fig. 3-10. Interface of MathMorph tool
-13-
CMIV CTA Tools For OsiriX -- User Manual
Fig. 3-11. Heart chamber seeds created by MathMorph tool
3.5.2
Threshold operation on of the segment results
By choosing ROIs created by the Segmentation tool in the Existing Mask list and giving a
proper threshold, you can make the mask only cover one segmented object of this series,
and by choosing export “image under masks” you can create a new series that only
contains the object that you have chosen.
3.6 Export Result tool
This tool is designed to save any kind of information (images and ROIs) of the temporary
series in the current 2D viewer. Unlike the intrinsic “Export DICOM” function of OsiriX
2D viewer, this tool will not record the image as a “screen capture”, which allows you to
reconstruct 3D images from this series on any kind of DICOM workstation.
The default series name for the new series is taken from the title of the 2D window. If
you are using our plugin, every new created series will be given a default name
depending on the operation you have just done, such as “seeds planted”, “Centerlines”
and “ CPR of RCA”. You can change it if necessary.
The series number does not matter in most cases, and you can just leave it to be “0” to
get a random series number. But this number will decide the order of the series in the
OsriX database list, so if you are working with multi-phase coronary CTA, and you want
-14-
CMIV CTA Tools For OsiriX -- User Manual
to put the segment results of different phases in a certain order, you will have to give a
unique number to each series manually.
Fig 3-12 Save results
Chapter 4
Workflow
All the tools mentioned above are able to work independently, but to finish certain tasks
such as artery segmentation or centerline extraction, you will have to apply the different
tools in a reasonable order.
One easy way to do so is using “Coronary CTA wizard”, in which proper tools will be
chosen automatically in each step (see “Quick Guide of CMIV CTA Plug-in”). But,
Coronary CTA wizard is designed to facilitate the coronary CTA image processing only,
and it also limits some function of this plugin. Another more flexible and powerful way is
to choose those tools sequentially from the menu by yourself, it will also work great if
you know how to control the workflow.
In the following example we try to introduce a general workflow for artery
segmentation and skeleonization for Coronary CTA or peripheral artery CTA.
4.1 Step 1 VOI (volume of interest) Definition
To reduce the VOI as much as you can will accelerate the rest procedure and save you a lot
of memory. So don’t skip this step unless the dataset you are working on is less than
512*512*100. By choosing “VOI cutter” from the menu, you will enter an interface you
can define a box to surround the interesting area. After modification, click “Save&Exit”
button to go back to OsiriX 2D viewer, and the image data outside the VOI will be cut off.
-15-
CMIV CTA Tools For OsiriX -- User Manual
Fig 4-1. VOI definition
4.2 Step 2 Seed planting
Choose “2D views” from plugin menu, to start planting seeds for the segmentation.
This step is the most flexible and complicated part of the whole procedure. There are
several kinds of seeds in the seeds list, which give the names of different kind structure,
such as “LCA”, “RCA” and “Bone”. You can paint those seed with 3 different tools
(virtual catheter tool, freehand painting tool and rectangle tool). Although you can
combine any kind of seeds with any type of tools, choosing the right kind of tool for
different kind of seeds will make you work easier and get better results. Here we
introduce two examples for coronary artery seed planting and peripheral artery seed
planting. Hope they will give you a hint on how to work with your own cases.
4.2.1
Seed planting for coronary artery
First, define artery roots with the virtual catheter tool ( ). Choose LCA or RCA
from the seeds’ label list, and choose virtual catheter tool by clicking on the “ ” icon,
then draw an arrow in the main MPR view (left part of screen) from the root of the artery
pointing to the distal end, and then adjust the arrow’s direction in the vertical MPR view
(actually it is reconstructed along the axis of the arrow now), and also adjust the position
and size of the circle in the horizontal MPR view (cross section now) to include the
whole cross section of artery, finally click “Save as seeds” button to finish the root seed
planting.
-16-
CMIV CTA Tools For OsiriX -- User Manual
Second, plant “other” (structures that you don’t want to show in the results, such as
cardiac chambers, aorta, sternum, liver etc.) seeds with the freehand painting tool ( ).
To use it, just choose “other” from the list and click the icon, then you can draw seeds
directly on the main MPR view.
Third, set “barriers” with the rectangle plane tool ( ). The rectangle tool is
specially designed for “barrier” seed to separat vessels from each other or from the
“other” structures. To use it, choose it first, as mentioned above, and draw a line (section
line) in the main MPR view, then adjust the rectangle area in the vertical MPR view, and
finally click the “Save as seeds” button to convert it to seeds.
In general, in the first round seed planting you need only plant two root seeds for
“LCA” and “RCA” with the virtual catheter tool, and several seeds for “other” part with
the freehand painting tool. Rectangle “barrier” is needed only where the arteries are too
close to other high intensity structure, such as heart chambers, to separate them from each
other.
Fig 4-2. Virtual catheter for RCA
4.2.2
Seed planting for peripheral artery
Choose “Artery” from the label list, and then choose the virtual catheter tool ( ). Draw
an arrow in the main MPR view (left part of screen) from the root of the artery pointing
to the distal end, and then adjust the arrow’s direction in the vertical MPR view (actually
it is reconstructed along the axis of the arrow now), and also adjust the position and size
-17-
CMIV CTA Tools For OsiriX -- User Manual
of the circle in the horizontal MPR view (cross section now) to include the whole cross
section of artery, finally click “Save as seeds” button to finish the root seed planting.
Fig 4-3 Virtual catheter for lower extremity arteries from abdominal aorta
-18-
CMIV CTA Tools For OsiriX -- User Manual
Fig 4-4 Bones seeds
Choose “Bone” from the label list, and then draw brown lines on the bones with the
freehand painting tool ( ) in the main MPR view(left part of screen).
After plant seeds, click “Save & Exit” button to go back to OsiriX 2D viewer.
If you are working with MRA datasets, it is not necessary to mark bones since they
give low signal. But if some veins show in the images, plant some “vein” seeds with the
freehand painting tool ( ). The root definition tool is not necessary for veins if you don’t
want to create the centerlines of them.
Tips for seed planting:
1. Only plant root seeds for Vessels:
Although in most cases only planting root seeds is far from enough to segment the
entire artery system, it will be more efficient to planting more seeds in the preview
interface of CFC segmentation tool (seeWorking with Interactive Window).
2. Put seeds in high intensity area:
Based on the character of our segment algorithm, those seeds will propagate in
high intensity area to low intensity area automatically, so if you are planting “other”
seeds for coronary segmentation, make sure your seeds cover following area: both
ventricles, descending aorta, sternum and vertebra.
3. Place barrier on the unwanted structure’s side:
-19-
CMIV CTA Tools For OsiriX -- User Manual
A barrier is usually set between ventricles or bones and arteries to prevent the
propagation of heart seeds leak to artery area or conversely. If you want an intact
artery, place the barrier closer to the ventricle or bones.
Notice: Remember to click “Save as seeds” button after you use virtual catheter
tool or rectangle plane tool. To learn how to operate the Orthogonal MPR system,
please see 2D Views tool.
4.3 Step 3 Interactive Segmentation
By choose “Interactive segmentation” tool from plugin menu, you will reach the core
function of the segmentation procedure.
First, choose seeds from the left list (The names of all markers in this series will be
listed on the left, and all will be chosen as seeds by default), and decide which ones you
want to show in the results by selecting check boxes in the “export” column. Since this is
the first round of segmentation of current series, we would suggest you run inactive
window so that you will be able to refine the results by add more seeds. The “Export
results” option is useless when you run inactive window. 26-neighborhood mode is
recommended for most CTA datasets. (To learn more about those options, see Interactive
segment tool)
Fig 4-5. Select seeds to export
After a while, you will be able see the segment result in the Preview Window.
Sometime those results are good enough, but sometime there will be some high intensity
structure hanging around the vessels, or some parts of arteries are still missing. By
choosing proper label from the components list, you can use your mouse to draw more
markers (“plant seeds”) on those missing parts or unwanted structures. After click the
“Update” button, you will be able to see the new result in seconds.
-20-
CMIV CTA Tools For OsiriX -- User Manual
Fig 4-6. Preview results in 3D
Tips for interactive seed planting:
1. No need to separate low intensity structure from high structure:
For example when you are working with coronary CTA datasets, it is not
necessary to remove all myocardium from the coronaries by seeding and updating.
Rather, it is recommended to have some of the myocardium hanging on to the
coronaries and making it less visible by adjusting WW and WL in the final rendering.
This makes it easier to validate the results visually.
2. Two high intensity structures connected with relative lower intensity tissue:
If the algorithm failed to segment two high intensity structures connected with
relative lower intensity tissue, then plant more seeds at high intensity area. For
example if some bone tissue is recognized as part of vessels, you should plant more
seeds at highest part of the bone tissue.
3. Two structures connected with almost equal intensity tissue:
If the algorithm failed to segment two structures connected with almost equal
intensity tissue, then plant more seeds at the connection area. For example if some
part of right ventricle is attached to LAD, planting more “other” seeds at the
connection area but seeds should still be in the ventricle area.(“berrier” seeds don’t
work in this step)
-21-
CMIV CTA Tools For OsiriX -- User Manual
Notice: Before you go to next step by clicking the “Create Centerlines” button,
you should export your results first using the popup menu at “Export” button. And
those results will be exported into new series and saved in memory. If you want save
it onto your disk, see “Save Results for the Future”
Plant
new seeds
Fig 4-6. Use new seeds to break the connection
4.4 Step 4 Centerline Extraction and CPR along Centerlines
The centerline extraction is an almost completely automatic procedure. The only thing
you need to do in most cases is to click the “Create Centerlines” button. Unlike most
other centerline extraction algorithms, there is no need for you to define the distal end of
the branches. The distal ends will be found automatically and the centerlines follow the
intensity ridge of the input images.
Now the “interactive segmentation tool” will lead you into a CPR view interface. In
the left top list there are candidate centerlines. With default centerline extraction setting,
all branches that are longer than 10 mm will be included in the list (you can change this
length threshold, see Interactive segment tool), and the list is sorted by the length of the
branches in descending order. It should be pointed out that the “length” in the list means
the distance from a distal end to the root point of main trunk, which is always longer than
the length of the branch.
-22-
CMIV CTA Tools For OsiriX -- User Manual
Fig 4-7 CPR of left femoral artery
You can rotate the CPR around the centerline by rotating the “main MPR view”. The
centerline will be projected into current reslice plane, and the CPR view represents a
curved surface, orthogonal to the main MPR view in each point of the curve. Choose
“straightened CPR” option will change the curved MPR view into a straightened CPR
view, to rotate it you can use the slider under the view directly. When you scroll the right
top view, it will give you the cross section images on current projected centerline (in
curved MPR mode) or the cross section images on the 3d centerline (in straightened CPR
mode).
You can also delete certain centerlines or rename them, if it is necessary.
4.5 Save Results for the Future
After exporting results in the last two steps, you can use OsiriX’s 2D/3D viewer to view
or measure these results. You should be aware that all results are now located on the
memory of the PC only, so you will lose them if you close those 2D windows. To save
the images and ROI markers onto your disk, you need to use the “Save Results” tool in
the plugin menu. The “seeds planted” series which contain seeds markers can be read by
interactive segmentation tool to repeat segmentation in non-supervised mode (see Open
Proceeded Cases and Run Non-supervised Procedure ), the “Centerlines” series can be
used by 2D views tool to create CPR images (see Create CPR Image from “Centerlines”
series), the series contains masks of different objects can be used by segmental VRT tool
-23-
CMIV CTA Tools For OsiriX -- User Manual
to create multiple-object VRT images (see Segmental VR tool), and other images can be
viewed on any kind of DICOM workstation.
Fig 4-8. Save results into the OsiriX database
4.6 Open Processed Cases and Run Non-supervised Procedure
After you save all the results series, you can view or measure them directly in OsiriX 2D
viewer or 3D viewer. But if you did not save all result series, as long as you save the
“seeds planted” series, you will be able to recreate all those results by running the
segmentation in a non-supervised mode.
First, open the “seeds planted” series with Osirix’s 2D viewer and choose the
“Interactive segmentation” from the plugin menu. Then from the left list choose the seeds
which will be used for the segmentation, and select the objects that will be include in the
results by click the chechbox in the “export” column of the right list. Finally, choose the
results formats that you want in the “Export result” box, and click “Run Non-supervised
Procedure” button.
-24-
CMIV CTA Tools For OsiriX -- User Manual
Fig 4-9 Choose Seeds to export
4.7 Create CPR Image from “Centerlines” series
When you click “Export Centerlines” button in the CPR view, or choose “Centerlines”
option for the Non-supervised mode, a series called “Centerlines”, which contains all
paths’ information, will be created. Using “2D views” tool, you will be able to create
CPR image from those centerlines.
Open the “Centerlines” series with OsiriX 2D viewer and choose “2D Views” form
the plugin menu. Open centerline selecting dialog box by choose “Load Path…” item
from the popup menu of CPR tool ( ). You can choose any centerline from the list and
after that the right bottom MPR view will change into CPR image along the centerline.
To learn more information about CPR operation, see 2D Views tool.
Fig 4-10. Load CPR path from markers.
-25-